


Improved access to food venues such as farmers’ markets and supermarkets is commonly proposed as a strategy to address the obesity epidemic, as studies have shown that those who live closer to farmers’ markets(Reference Rundle, Neckerman and Freeman1, Reference Jilcott, Wade and McGuirt2) and supermarkets(Reference Morland and Evenson3, Reference Morland, Diez Roux and Wing4) generally have lower BMI than those who live further from such food venues(Reference Spence, Cutumisu and Edwards5, Reference Babey, Diamant and Hastert6). The underlying assumption of such studies is that greater access to such food venues may lead to purchase and consumption of fresh produce. For example, Yoo et al.(Reference Yoo, Baranowski and Missaghian7) found that those who shop more frequently at supermarkets tended to have healthier diets when compared with those who shop less frequently at supermarkets. In a North Carolina-based study, we found that more frequent shopping at supermarkets was associated with healthier purchases among Supplemental Nutrition Assistance Program participants, when compared with those shopping at supermarkets less frequently(Reference Jilcott Pitts, McGuirt and Carr8). Greater knowledge about associations between access to food venues, shopping frequency and food purchases is needed to inform future efforts to increase access to healthy foods.
Furthermore, much of the research regarding the food environment has involved objective measures of the food environment via Geographical Information Systems (GIS)(Reference Rundle, Neckerman and Freeman1–Reference Morland, Diez Roux and Wing4), while some posit that perceptions of the food environment have a greater impact on shopping choices/behaviours than objective measures(Reference Moore, Diez Roux and Brines9–Reference Gustafson, Sharkey and Samuel-Hodge11). In particular, an understudied aspect of food venue access, particularly important for quantifying access to farmers’ markets, is ‘accommodation’, which includes the business hours a particular venue is open, seasonal schedules and other factors that may affect both perceived and objectively measured access to the food venue(Reference Caspi, Sorensen and Subramanian12). One group of researchers incorporated business hours to objectively measure food venue access, and found that those who consumed fruit more frequently had greater access to greengrocers (venues selling fruits and vegetables) that had longer hours of operation(Reference Thornton, Crawford and Ball13). Among Hispanic women in New York City, the presence of a farmers’ market in women's neighbourhoods was associated with greater fruit and vegetable consumption(Reference Park, Quinn and Florez14). Another group examined seasonality and access to farmers’ markets in New York State and found that higher-poverty census block groups had greater objectively measured access to produce markets during the summer months, but less access to such markets during the spring and winter months, when compared with all block groups(Reference Widener, Metcalf and Bar-Yam15). In the field of geography, researchers have used time and distance functions to create accessibility indices(Reference Goldsberry, Duvall and Howard16, Reference Weber and Kwan17), yet these techniques have not been widely used in the field of public health. This approach lends itself to exploring how objective space and time accessibility measures are associated with use of farmers’ markets, fruit and vegetable consumption and health.
Learning about individuals’ food shopping patterns and the locations where they shop will help facilitate more accurate assessments of true food environment exposures(Reference Lytle18, Reference Kerr, Frank and Sallis19). Not much is known about shopping patterns and frequencies, the distance individuals are willing to travel to purchase foods(Reference Lytle18, Reference Kerr, Frank and Sallis19). One study found that the mean distance travelled to supermarkets was 7·5 km (4·67 miles)(Reference Kerr, Frank and Sallis19), while a recent review of the literature indicated that individuals travel 9·7–27·4 km (6–17 miles) to farmers’ markets(Reference Byker, Shanks and Misyakc20). It is unknown whether individuals tend to shop at the food venues closest to their home or whether they travel past the closest venue to shop at another venue, perhaps due to more competitive prices, wider selection or other factors. Such knowledge is important because, in a previous study, those who travelled further to the grocery store had higher BMI(Reference Inagami, Cohen and Finch21). Determining individuals’ ‘food activity spaces’, or the geographic locations and variety of food venues at which individuals shop, is also important for future epidemiological studies of associations between food access and health.
Therefore, the purpose of the current study was to examine associations between access to food venues (farmers’ markets and supermarkets), shopping patterns and health indicators among low-income women of reproductive age in eastern North Carolina. It is important to learn about such women's access to and use of healthy food venues, as low-income populations may be less likely to shop at farmers’ markets than their higher-income counterparts(Reference Byker, Shanks and Misyakc20). Low-income women of reproductive age are also at increased risk of chronic disease(Reference Hayes, Fan and Smith22) and shopping at healthy food venues may help ameliorate this risk. In one study of health behaviours among a nationally representative sample of women of reproductive age, women with a history of gestational diabetes and with children in the household had significantly lower odds of consuming at least five servings of fruits and vegetables daily, compared with those with a history of gestational diabetes not living with children(Reference Kieffer, Sinco and Kim23).
In the current study, we examined associations between objectively measured access to food venues (farmers’ markets and supermarkets), frequency of shopping at venues and health indicators (e.g. fruit and vegetable consumption, BMI and blood pressure). Objectively measured access included: (i) distance to the closest food venue to the residential location; (ii) mean distance travelled to the food venues where women reported shopping (visited food venue); and (iii) a novel indicator of space and time accessibility to farmers’ markets, incorporating distance, seasonality and business hours. We hypothesized that better access to supermarkets and farmers’ markets would be associated with more frequent shopping and more favourable health indicators. As perceived access to food venues may be more important than objectively measured access(Reference Moore, Diez Roux and Brines9–Reference Gustafson, Sharkey and Samuel-Hodge11), we also examined the association between perceived and objectively measured access. Finally, we examined the mean distance travelled to food venues and further explored whether the mean distance travelled to food venues varied by rural/urban residence.
Experimental methods
Study setting
The present study was conducted in Pitt County, eastern North Carolina, USA (population estimate = 168 148). Pitt County is a primarily rural county, with a small urban centre as its county seat, which is home to a large regional medical centre and a large public university. According to the US Food Environment Atlas(24), 35·9 % of Pitt County adults are obese, and 4·25 % of Pitt County households without a vehicle live more than 1·6 km (1 mile) from a supermarket.
Participants
The present study was conducted ancillary to the InShape (Integrated Screening and Health Assessment, Prevention and Evaluation) Study, the primary purpose of which was to examine risk factors for heart disease among women of reproductive age. Participants were recruited from the Title X federally funded family planning clinic at the local health department. Eligibility criteria were: female, age 18–44 years, English speaking, attending an initial or annual family planning visit, and having valid address information. Eligible women were invited by a research assistant to take part in the study. If interested, the women reviewed and signed informed consent and were given an enrolment questionnaire to complete, which included demographic and health-related questions, as well as questions addressing access to food venues and shopping patterns. Health indicator data were obtained by chart review of clinical measurements and completed questionnaires, as described below. The study was approved and monitored by the University of North Carolina Institutional Review Board.
Perceived distance to food venues
Perceived distance to farmers’ markets and supermarkets was assessed by asking ‘How far from your home is the (farmers’ market/supermarket) where the primary shopper in your household does most of the shopping?’ Participants were asked to provide responses in both minutes and miles.
Objectively measured access to food venues
Participants’ home addresses were obtained via self-report and geocoded as point locations. Local farmers’ markets were identified from the NC Farm Fresh website (www.ncfarmfresh.com), a state-sponsored clearinghouse of market information. Field staff verification supplemented the information obtained from this website, and farmers’ market locations and hours were verified via telephone. Supermarkets were identified from the Reference USA business listings according the North American Industry Classification System (NAICS)/Standard Industrial Classification (SIC). The 2012 NAICS code (which replaced SIC codes in 1997) used for supermarkets (excluding convenience stores) was 445110 (SIC code 541101). Resulting listings were downloaded as Excel spreadsheets containing business name and latitude/longitude coordinates. A GIS point data layer of all supermarkets was created using ArcGIS version 10 software based on the coordinate information. Locations of each market were verified by examining corporate website listings and visual inspection using Google Maps to ensure that points were located at the proper location. In selected instances, spatial data editing was required to shift a point to its true location. Farmers’ markets and supermarkets were also geocoded as points.
The road network distance from participant residences to a designated food venue was calculated (in miles) for every participant–farmers’ market and participant–supermarket pair using ArcGIS Network Analyst, yielding variables measuring distances from participant residences to the closest farmers’ market and supermarket. Women were given a list of all farmers’ markets and supermarkets in the county and asked to indicate the food venues at which they most frequently shopped. The mean of all objectively measured distances to the farmers’ markets/supermarkets where women reported shopping (visited farmers’ market and supermarket) were calculated using a SAS function, which calculates driving distance using Google's Application Programming Interface.
Novel measure of access to farmers’ markets
Accessibility to farmer's markets was measured using techniques that incorporate both distance and time. It was assumed that greater distances to markets reflect less accessibility. Conversely, it was assumed that greater numbers of hours open for business reflect greater accessibility. To incorporate temporal accessibility of farmers’ markets relative to supermarkets, it was assumed that all supermarkets were open 365 d per year for an average of 12 h per day (4380 h). The temporal component for farmers’ market accessibility was quantified as the proportion of farmers’ market annual hours relative to supermarket annual hours and used as a weight potentially ranging from 0·0 to 1·0. A proportion value of 0·25 indicates that a farmers’ market is open for business 25 % of the time that supermarkets are open throughout the year. There were thirteen farmers’ markets in our study area, with time proportions ranging from 0·01 to 0·48 and a mean of 0·20. The accessibility measure is formally defined as:
 $${{A}_i}\: = \:\mathop{\sum}\limits_j {\frac{{{{t}_j}}}{{d_{{ij}}^{\beta } }}}, \eqno\rm$$
where Ai = farmers’ market accessibility of participant i, j = farmers’ market j, tj = time proportion of open hours relative to supermarkets weight for farmers’ market j, dij = distance in network miles from participant i to farmers’ market j and β = distance decay exponent.
An interpretation of Ai is that participants located close to farmers’ markets with many open business hours have greater accessibility than participants located distant from markets with few open hours. The choice of the β exponent reflects the importance of distance. A higher β exponent means that the effect of distance is non-linear and accessibility decreases more rapidly with increasing distance to markets. Two different accessibility measures using β = 1 and β = 2 were created for analyses with an interest in assessing the effects of accessibility and sensitivity of results to the distance decay exponent β. Note that for β = 0, Ai would simply be the sum of all tj values, and accessibility would be identical for all participants. Both measures were rescaled to range from 0 to 100 using the linear min/max technique. Because supermarkets are open year-round during normal business hours, we did not apply the novel measure of accessibility to supermarkets.
Shopping frequency
Shopping frequencies were assessed by asking ‘How often do you or the primary food shopper in your household shop for food at a (farmers’ market/supermarket)?’ Response options were: never, a few times per year, once per month, 2–3 times per month, one time per week, and 2 or more times per week. Due to the distribution of responses, frequencies were dichotomized into ‘never’ and ‘ever’ (a few times per year or more) for farmers’ markets and into ‘low’ (≤2–3 times/month) and ‘high’ (≥1 time/week) for supermarkets.
Health indicators
Fruit and vegetable consumption was assessed by chart review, using the most recent response to a single questionnaire item, asked during the family planning visit, indicating whether the participant self-reported eating five or more fruits and vegetables daily. BMI, weight in kilograms divided by the square of height in metres, systolic blood pressure (SBP) and diastolic blood pressure (DBP) measures were obtained by chart review of clinical measurements obtained at the family planning clinic visit. The fruit and vegetable consumption item came from a form used for clinical care and is typically completed at the initial family planning visit and updated periodically. Thus, the fruit and vegetable item may have been completed during a visit prior to the day of enrolment, whereas BMI, SBP and DBP were measured on the day of enrolment.
Covariates
Covariates included race, age, smoking status, education level and/or student status, rural/urban residence, car ownership and physical activity. Race was obtained from chart abstraction and was categorized into black, white and other. Age in years was calculated based upon date of birth and enrolment into the study. Smoking status was ascertained by asking if participants had smoked at least one cigarette in the last month. Education level was self-reported and dichotomized into less than v. greater than or equal to high-school graduation. Participants were asked to provide student and employment status. Urban residents were those with a Greenville or Winterville zip code, and rural residents were those with any other Pitt County zip code. Car ownership was ascertained by asking participants whether they leased or owned a car (yes/no). Physical activity was ascertained via self-reported number of minutes per week spent on vigorous and moderate physical activity, with min/week calculated by doubling the number of minutes for vigorous activity and adding this to moderate activity minutes. Because it seemed women over-reported their physical activity, in statistical modelling women were categorized as inactive (no physical activity), insufficiently active (some but <150 min/week) or active (≥150 min/week).
Statistical analyses
We examined participant characteristics using descriptive statistics (means, frequencies) and examined differences between those who did and did not shop at farmers’ markets using t tests and χ 2 tests. Poisson regression with robust variance was used for dichotomous outcomes(Reference Zou25) and multiple linear regression was used for continuous outcomes, controlling for race, age, smoking status, education level, rural/urban residence, car ownership and physical activity.
Specifically, we examined associations between health indicators, shopping frequencies and objectively measured: (i) mean (road network) distance to the farmers’ markets where women shopped (visited farmers’ market); (ii) distance to the closest farmers’ market; (iii) mean distance to the supermarkets where women shopped (visited supermarket); and (iv) distance to the closest supermarket, adjusting for race, age, smoking status, education level, rural/urban residence, car ownership and physical activity. We also examined associations between the novel measure of accessibility to farmers’ markets (incorporating distance and seasonality) described above, frequency of farmers’ market shopping and health indicators. We used the β = 1 accessibility variables as these variables had more variability than the β = 2 variables. We examined cross-sectional bivariate associations between perceived and objectively measured distance to the closest farmers’ market and supermarket using Pearson's correlation coefficients. We examined mean objectively measured distances to farmers’ market/supermarket from residential locations, with analyses stratified by urban/rural residence. A large state university and a community college are located in the town where the study was conducted. We learned from our formative work that many women seen in the family planning clinic were university or community college students. Students may have different shopping patterns from non-students, as they may live in dorms and eat in dining halls more often and thus not shop at farmers’ markets and supermarkets as frequently. Therefore, analyses were stratified by student status, as we expected students would have different shopping patterns and/or health indicators from non-students. As non-independence of the data due to clustering of participants may have been an issue in our data, we calculated the intra-class correlation coefficient for BMI and blood pressures among women in the same zip code. As the intra-class correlation coefficient for BMI was 0·020, and the intra-class correlation coefficient for blood pressure was nearly zero, we felt that the non-independence due to clustering was negligible and therefore did not use mixed models. All analyses were conducted using the statistical software package SAS version 9·2.
Results
Participant characteristics
Among the 462 InShape participants, 400 had valid home addresses and comprise the sample for the present study. Those who did not have a valid home address (and were thus not geocoded) were more likely to be rural residents than those with a valid home address who were geocoded (P < 0·001). Of these, 114 (28 %) reported visiting at least one farmers’ market on the list. Table 1 shows characteristics of all study participants and the subgroups of those who did and did not shop at a farmers’ market. Briefly, the mean age of participants was 26 (sd 6) years, 64 % were black, 39 % were students, 16 % lived in rural areas, 29 % ate five or more fruits and vegetables daily, the mean BMI was 30 (sd 8) kg/m2, the mean SBP was 118 (sd 13) mmHg and the mean DBP was 75 (sd 9) mmHg. Also, those who shopped at farmers’ markets were older on average (P = 0·018), less likely to be black (P = 0·001) and less likely to be students (P = 0·018), compared with those who did not shop at farmers’ markets. Of note, 42·1 % of those who shopped at a farmers’ market ate five or more fruits and vegetables daily, compared with 24·0 % of those who did not shop at farmers’ markets (P < 0·001).
Table 1 Characteristics of all participants and of subgroups who did/did not shop at farmers’ markets, with P values for differences between subgroups: low-income women of reproductive age (18–44 years), Pitt County, eastern North Carolina, USA
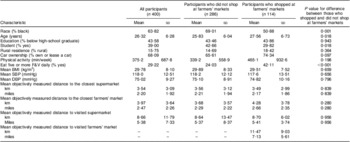
F&V, fruits and vegetables; SBP, systolic blood pressure; DBP, diastolic blood pressure.
Categorical variables are displayed as percentages, and continuous variables are displayed as mean and standard deviation.
Objectively measured access to food venues (farmer's markets and supermarkets), frequency of shopping at venues and health indicators
Among non-students, controlling for covariates, those who shopped at farmers’ markets were more likely to consume five or more fruit and vegetables daily (adjusted relative risk = 1·51, 95 % CI 1·03, 2·22; P = 0·036), compared with those who did not shop at farmers’ markets. There were no other statistically significant associations between daily fruit and vegetable consumption and shopping patterns or access to food venues (Table 2). Associations between shopping patterns and BMI or blood pressure were not statistically significant. Among students, those who had higher farmers’ market accessibility (using the novel measure of access) were less likely to shop at a farmers’ market (adjusted relative risk for students = 0·89, 95 % CI 0·82, 0·98; P = 0·006).
Table 2 Associations between daily fruit and vegetable consumption (dependent variable) and shopping patterns and access to food venues (independent variables): low-income women of reproductive age (18–44 years), Pitt County, eastern North Carolina, USA

Among all participants, adjusting for all covariates, the association between SBP and average distance travelled to supermarkets approached statistical significance (B = 0·17, 95 % CI 0·00, 0·34; P = 0·055). In stratified, adjusted analyses, there was no association between distance to supermarkets and SBP among non-students; but among students, lower SBP was associated with closer average distance travelled to supermarkets (B = 0·20, 95 % CI 0·02, 0·38; P = 0·031; data not shown).
Perceived and objectively measured distances to the closest food venue
The correlation between perceived distance to the farmers’ market where women shopped and the objectively measured mean distance to the farmers’ market where they reported shopping was r = 0·378 (P < 0·001, n 98). The correlation between perceived distance to the supermarket where women shopped and the objectively measured mean distance to the supermarket where they reported shopping was r = 0·135 (P = 0·012, n 342).
Distance travelled to food venues
Table 3 shows mean objectively measured distances to farmers’ markets and supermarkets where women reported shopping (visited market) and mean objectively measured GIS distances to markets closest to the residential address, with analyses stratified by urban/rural residence. The mean objectively measured distance to the farmers’ markets where women reported shopping was 11·4 (sd 9·0) km (7·1 (sd 5·6) miles) and the mean objectively measured distance to the farmers’ market closest to the residential address was 4·0 (sd 3·7) km (2·5 (sd 2·3) miles). The mean objectively measured distance to the supermarkets where the woman reported shopping was 8·7 (sd 11·7) km (5·4 (sd 7·3) miles) and the mean objectively measured distance to the supermarket closest to the residential address was 3·5 (sd 3·1) km (2·2 (sd 1·9) miles).
Table 3 Mean distances from residential address to the farmers’ market and supermarket where women reported shopping (visited markets), and mean distances to the closest farmers’ market and supermarket, by urban/rural residential status: low-income women of reproductive age (18–44 years), Pitt County, eastern North Carolina, USA

Discussion
In our study sample, among non-students, shopping at a farmers’ market was associated with increased likelihood of consuming five or more fruits and vegetables daily. Our cross-sectional study finding is in agreement with two recent longitudinal pilot studies(Reference Evans, Jennings and Smiley26, Reference Ruelas, Iverson and Kiekel27), one of which suggested that fruit and vegetable consumption increased upon introduction of a farm stand in Austin, Texas(Reference Evans, Jennings and Smiley26). The other found that farmers’ market customers in Los Angeles, California reported they ate more fruits and vegetables due to new neighbourhood farmers’ markets(Reference Ruelas, Iverson and Kiekel27). This work collectively supports the notion that improved access to and shopping at farmers’ markets is associated with dietary behaviours.
It is noteworthy that the association between farmers’ market shopping and likelihood of consuming five or more fruits and vegetables daily held true among non-students, but not among students. In the present study where most students attended a large university, food shopping patterns are likely to differ substantially from those of non-students. Specifically, most college students are likely to be on a school meal plan, wherein they purchase meals on campus, compared with non-students who typically purchase food from community food venues such as restaurants, supermarkets and farmers’ markets. In addition, many students who live in dormitories or small apartments may not have food preparation and storage facilities that are conducive to shopping and preparing meals at home (or in a dormitory room). More work should be done to examine if these findings hold true in other university towns, and whether women who are college students are more likely to obtain food from such university-based sources. If so, perhaps interventions to incorporate farmers’ markets on university campuses should be considered.
However, our findings did not confirm an association between distance to farmers’ markets or supermarkets and BMI, as found in previous studies(Reference Rundle, Neckerman and Freeman1–Reference Babey, Diamant and Hastert6), and we found no evidence that use of farmers’ markets is associated with the two health indicators studied (BMI and SBP). This may be due to the fact that these two outcomes are very distal from the primary exposure of food venue shopping, and perhaps fruit and vegetable consumption and other dietary measures are more appropriate outcomes for this type of study. We did find among students that lower SBP was associated with closer average distance travelled to supermarkets. While it could be that better access to supermarkets leads to greater consumption of fruits and vegetables and lower blood pressure, it is likely that this finding is due to chance, as there were no other associations between access to supermarkets and blood pressure.
In our study we used a novel indicator of access, or accommodation, which accounted for the distance from home to the farmers’ market, as well as seasonality and business hours. Counter-intuitively, among students, those who shopped at farmers’ markets had lower farmers’ market accessibility than those who did not shop at farmers’ markets. This indicates that farmers’ market shoppers may be motivated by factors other than distance when deciding to patronize a farmers’ market, and thus distance to food venues may not be the best indicator or predictor of shopping behaviour or consumption. The correlation between perceived and objectively measured distance to farmers’ markets was moderate (0·38) while the correlation between perceived and objectively measured distance to supermarkets was low (0·14), suggesting that women are better at judging distance to farmers’ markets v. supermarkets. While a prior Atlanta-based study found that the mean distance travelled to supermarkets was 7·6 km (4·7 miles)(Reference Kerr, Frank and Sallis19), we found the individuals travelled, on average, 8·7 km (5·4 miles) to their primary supermarket. This is a larger distance than the objectively measured 3·5 km (2·2 miles) to the supermarket closest to women's residential addresses. The mean objectively measured distance to the farmers’ markets where the woman reported shopping was 11·4 km (7·1 miles) in our study, which is similar to results of the recent review which indicated that individuals travel 9·7–27·4 km (6–17 miles) to farmers’ markets(Reference Byker, Shanks and Misyakc20). Again, this distance is larger than the objectively measured 4·0 km (2·5 miles) to the farmers’ market closest to women's residential addresses. This is noteworthy, as women in our study travelled much further than the 1·6 or 3·2 km (1 or 2 mile) buffers typically used to quantify the food environment, suggesting that methods of measurement of food environment exposure should include women's actual food activity spaces. In addition, as expected, rural women travelled much further to food venues than their urban counterparts, suggesting that rural dwellers’ food activity spaces are much larger than urban dwellers’.
The present study was limited by its cross-sectional design, as we cannot determine whether the independent variable (e.g. farmers’ market shopping frequency) preceded the dependent variable (e.g. fruit and vegetable consumption). The study is also limited by the small sample size, especially for the subgroup analysis of students v. non-students. Google's Application Programming Interface likely contains error, and there may be systematic bias in the group of women who were not geocoded. Those who were not geocoded (because they did not have a valid home address) were more likely to be rural residents than those with a valid home address who were geocoded. The measure of fruit and vegetable consumption was dichotomous, based on self-reported data that may not be current as it was obtained from chart review of a form that may have been completed at a prior clinic visit. In addition, all types of food, healthy and unhealthy options, are available at supermarkets(Reference Thornton, Cameron and McNaughton28). Despite these limitations, strengths of the study include the use of objective measures of distance to food venues women actually reported using v. those closest to the home address. Finally, we used a novel method to account for seasonality and business hours of farmers’ markets, contributing to a quantification of the nebulous construct of accommodation(Reference Caspi, Sorensen and Subramanian12).
As distances to venues where woman reported shopping were larger than the distance to the closest venue, future research should more accurately define the neighbourhood food environment and factors determining shopping patterns. In the present study, among non-students, we found a positive association between shopping at farmers’ markets and eating five or more fruits and vegetables daily. This association should be evaluated in future research using more robust study designs, including longitudinal studies that examine the use of farmers’ markets and fruit and vegetable consumption among probability samples of community residents.
Acknowledgements
Sources of funding: Research reported in this publication was supported by Cooperative Agreement Number 5U48DP001944 from the Centers for Disease Control and Prevention (CDC) and by the National Institutes of Health/National Cancer Institute (NIH/NCI) under award number 5R03CA155362-02. The findings and conclusions in this report are those of the authors and do not necessarily represent the official position of the CDC or NIH/NCI. This research was also supported by resources from East Carolina University's Center for Geographic Information Science. Conflict of interest: The authors have no conflicts of interest to disclose. Authors’ contributions: S.B.J.P. conceptualized and led the study, including guiding data collection, management, analysis and reporting, as well as led manuscript writing. Q.W. led data analysis and helped to draft the manuscript and revise it for intellectual content. J.T.M., T.W.C., T.C.K. and A.S.A. helped with study conceptualization and also helped to draft the manuscript and revise it for intellectual content. Acknowledgements: The authors are grateful to Cheryl Robbins, PhD, MS for manuscript review and to Ashley Ronay for her help in ascertaining farmers’ market locations and business hours. They are thankful for data collection assistance from Nadya Majette, MPH and Jessica Sisneros, MS, RD. They are also grateful to the study participants who provided a deeper understanding of their interactions with the food environment.


