


The European Prospective Investigation into Cancer (EPIC) study is a ten-country, half-a-million-participant collaboration. Its primary purpose was to elucidate diet–cancer associations; however, the aims of the study have broadened to incorporate other exposures and health outcomes. Before recruitment of participants for the EPIC study in Norfolk (EPIC-Norfolk) started, comparisons of dietary assessment methods were undertaken to establish their relative validity( Reference Bingham, Gill and Welch 1 ) as well as their associations with recovery biomarkers( Reference Bingham, Gill and Welch 2 ). Although it was acknowledged that the FFQ has its place within the wider EPIC study( Reference Bingham, Welch and McTaggart 3 ), Norfolk participants were asked to complete both a FFQ and a 7 d diet diary (7dDD) because of higher correlations with biomarker data( Reference Bingham, Welch and McTaggart 3 ), its flexibility with respect to hypothesis generation( Reference Bingham, Gill and Welch 2 ) and the growing food supply( Reference Bingham, Welch and McTaggart 3 ). The open-ended prospective recording of dietary intake in the 7dDD reduces recall bias( Reference Thompson, Subar, Coulston and Boushey 4 ), but it is substantially more laborious in terms of data entry because of data interpretation. The intakes obtained from 7dDD can be used in an absolute way, but similar to other observational measures of dietary assessment, they are prone to energy under-reporting and require vigilance when interpreting results( Reference Bingham, Welch and McTaggart 3 , Reference Subar, Kipnis and Troiano 5 ). After 16 years, the 7dDD of the full cohort of over 25 500 participants taking part in the EPIC-Norfolk study are available to study diet–disease associations.
Health advice to the general public is given in terms of the quantities of foods to be consumed, rather than in terms of nutrient intake( 6 ). This brings another layer of data interpretation, i.e. grouping the foods chosen during data entry into substantially enough groups for statistical analysis while maintaining consistency within food groups to aid in the formulation of clear guidelines for public health messages. We disaggregated composite dishes into their constituent parts, which in the case of meat dishes has already been shown to improve precision in the estimation of the amount of meat consumed using national survey( Reference Fitt, Mak and Stephen 7 , Reference Cosgrove, Flynn and Kiely 8 ) and cohort data( Reference Prynne, Wagemakers and Stephen 9 ). Disaggregation is important for the formulation of recommendations as well as the establishment of sources of nutrients. However, the extent to which the measures of disaggregated intakes and cruder measures are in agreement for groups such as fruit, vegetables and fish is less well documented. These comparisons are of importance when food group data across studies are compared or pooled, a process that is further complicated by decisions made by researchers on food classification( Reference Subar, Krebs-Smith and Cook 10 ) and unclear information provided by researchers regarding the foods that are included or excluded from particular food groups.
In the present study, we aimed to describe the process of dietary intake measurement, i.e. from data collection to data fit for statistical analysis, used in the EPIC-Norfolk study and the different interpretation stages that are involved. We analysed population energy and nutrient intakes from the largest prospective cohort that completed 7dDD. Knowing that under-reporting takes place, we estimated the proportion of participants who under-reported. Finally, we analysed the amounts of commonly consumed food groups quantified in the traditional (‘label-based’) way and using disaggregation, followed by an assessment of agreement between these two ways of data interpretation.
Methods
European Prospective Investigation into Cancer-Norfolk
Recruitment for the EPIC-Norfolk study started in 1993( Reference Day, Oakes and Luben 11 ). For the present study, 30 445 men and women between the ages of 40 and 79 years were invited via thirty-five general practices based in Norfolk, East Anglia (UK), of whom 25 639 came for a health examination and were asked to complete a 7dDD (Table 1). In the UK National Health Service, where all residents are registered with a general practitioner, practice registers provide a good proxy for population-based registers. The study was conducted according to the Declaration of Helsinki and was approved by the Norwich District Health Authority Ethics Committee, and all participants gave signed informed consent.
Table 1 Sociodemographic characteristics of the participants of the European Prospective Investigation into Cancer-Norfolk study (UK) who came for the health examination and recorded data for at least 1 d in their 7 d diet diaries between 1993 and 1998 (Mean values and standard deviations; number of participants and percentages)

* Physical activity was measured using a questionnaire and included occupational and leisure-time activity; there is no algorithm to convert the answers in this questionnaire to a physical activity level( Reference Wareham, Jakes and Rennie 43 ).
Anthropometry and energy requirements
During their health examination, participants' weight was measured to the nearest 0·2 kg using a digital scale (Salter). Height was measured to the nearest millimetre using a free-standing stadiometer; for both measures, the participants wore light clothing and no shoes. To estimate under-reporting, height and weight were used to calculate BMR using the Henry equation taken from the report of the Scientific Advisory Committee on Nutrition( 12 ). Total energy expenditure (TEE) was estimated by multiplying the BMR with three levels of assumed physical activity (PAL) in the EPIC-Norfolk population. The PAL were taken from the same report and based on studies that used doubly labelled water methods to estimate TEE: 1·40 (10th centile); 1·49 (25th centile); 1·63 (with 50th centile representing light physical activity)( 12 ). PAL values of 1·27 are considered a minimum survival requirement, and PAL in healthy, mobile, older adults are considered to be the same as those in adults. We included the 10th centile PAL of 1·40 to represent very low levels of physical activity.
The 7 d diet diary
The 7dDD is an A5 booklet with four pages for each day to record the foods and drinks consumed over seven meal occasions (before breakfast, breakfast, between breakfast and lunch, lunch, between lunch and dinner, dinner and after dinner), based on the diary used in the National Survey of Health and Development( Reference Prynne, Paul and Mishra 13 ). For each day, there is a separate area for recipe notation and a checklist of commonly consumed, but often forgotten, foods. The last four pages in the diary are in the style of a general questionnaire where details regarding the types of milk, bread and spread are recorded to aid data entry in case the participants did not provide enough details in their 7dDD.
During the participants' health examination, a nurse conducted a 24 h diet recall according to a standardised protocol( Reference Welch, McTaggart and Mulligan 14 ) and explained how to complete the booklets and record the amount of details that would be necessary in order to analyse the diaries, avoiding evaluation of their diet and using the aforementioned checklist to help them remember. The participants recorded data for the remaining 6 d at their home. They were asked to write down the type and amount of foods consumed at the time of consumption. Portions could be estimated using household measures (such as teaspoons and mugs) or one of the seventeen colour-print photos of commonly consumed foods/dishes or by recording weights from packaging. The participants returned the diaries to the study centre by post, where they were recorded as ‘returned’ and immediately stored; no contact with the participants was attempted.
Data entry
The returned diaries were initially selected for data entry as a series of nested case–control analyses. The diaries were entered into Data into Nutrients for Epidemiological Research (DINER), a computer-based coding system developed in house, described by Welch et al. ( Reference Welch, McTaggart and Mulligan 14 ). As resources permitted, diaries were entered between 1996 and 2011 by one to six trained data-entry clerks, who were blinded to the case or control status of the participants. Over 11 000 food items and nearly 600 portions were available to choose from by the time data entry was completed. To guide the data-entry clerks' work and ensure consistency, a manual that explained common situations and the decisions to be made was developed and maintained.
Data cleaning
The process of converting handwritten 7dDD into a digital format involved a two-part cleaning process, covering database- and diary-related errors.
Database checks
The database checks ensured that food items and their associated data such as portion sizes, nutrient quantities, density, cooking loss, water gain and edible part fractions were kept consistent across the various source tables.
Nutrient data from the 5th edition of McCance and Widdowson's Composition of Foods (CoF)( Reference Holland, Welch and Unwin 15 ) and the ten supplement books( Reference Holland, Unwin and Buss 16 – 25 ) were comprehensively checked and missing values were completed for carotenoids, vitamin C, Fe, vitamin D, vitamin E and vitamin K. The nutrient data have expanded extensively to include a total of thirty-two fat fractions, sixteen phyto-oestrogens( Reference Mulligan, Welch and McTaggart 26 , Reference Mulligan, Kuhnle and Lentjes 27 ), six phytosterols( Reference Klingberg, Andersson and Mulligan 28 ), haem and non-haem Fe and thirty-five distinct flavonoids. For the majority of the added phytochemicals, the nutrient quantity takes the ranges into account, i.e. the variety found in published and/or analysed data, by creating separate nutrients for ‘minimum’, ‘median/mean’ and ‘maximum’ nutrient amounts.
Diary checks
The first checks on a 7dDD were done after entry by the data enterers where a supplementary program to Data into Nutrients for Epidemiological Research (DINER) identified meal times missed or extreme portion sizes. Most checks, however, were done by the nutritionists' team using a suite of in-house designed programs. Notes on how to use the different parts were compiled in a single user manual CHEDDAR (Correct Handling of EPIC-Norfolk Data Diminishes Awful Results)( 29 ). CHEDDAR ensured similar handling and interpretation of the computer output, as well as an explanation of data management for both paper and digital diary data.
The programs for data cleaning and calculation have seen two extensive revisions in the past 6 years. The first revision took place at the start of the Medical Research Council Centre for Nutritional Epidemiology in Cancer Prevention and Survival in 2007( Reference Dahm, Keogh and Spencer 30 ). The original program relied on expensive commercial software and it was thought beneficial to use open-source software. The checking and calculation programs have been called ‘DINERMO’ since their inception (a name reflecting ‘moving onwards’ from data entry). The checks described by Welch et al. ( Reference Welch, McTaggart and Mulligan 14 ) were incorporated into DINERMO, and these were extended with date validity checks, whereby diaries containing details for less than three meal times per d were evaluated for validity; more detailed portion-size allocation checks, such as suitability of portion defaults; improvements on day completion checks and a general improvement of interface and data output provided. The second revision of DINERMO has taken place over the last 2 years and focused on making the checking process more efficient by merging elements of checking and calculation together as well as improving computer efficiency. We also incorporated the food group calculation into this version and revised the user manual to reflect these changes, which is now called the EPIC-Norfolk Diary All-in-one Method (EDAM).
Output
Nutrients
The recently revised nutrient calculation program can calculate all the 208 nutrient quantities (and food group data) for all the 25 507 diaries much more rapidly due to parallel processing capabilities. Each food item is calculated for the full range of nutrients. This ensures a high level of flexibility since data can be summed and averaged to provide nutrient variables that can be compared between the seven individual days (or any other time element in the dairies, such as per meal) or averaged over the number of days data have been recorded. The nutrient intake data can also be combined with the food group data to provide information on the sources of nutrients (e.g. the amount of vitamin C derived from vegetables).
Food group data
Food group data enable us to analyse the data in different ways. Most of the food groups are hierarchical in nature. Similar foods are grouped together in the same category, and in the crudest grouping system available, foods are labelled with names such as ‘vegetable’, ‘meat’ and ‘dairy’. (Table 2). A detailed food grouping system creates subcategories such as ‘Brassicaceae’, ‘beef’ and ‘cheese’. Another group focuses on all fruit and vegetable (F&V) varieties (e.g. further categorising Brassicaceae into vegetables such as Brussels sprouts, cabbage and broccoli) and their respective preparation methods such as ‘raw/fresh’, ‘cooked’, ‘dried’, ‘sauce/soup’, ‘juice’ or ‘dish’. Specific groups, not fitting into the hierarchy, were created for several projects such as a group that matches the 7dDD food items to their respective FFQ item (if present), dairy food groups and a group for canned products. For dairy products, the food items were characterised by three elements: dairy source (milk, cheese, cream, butter, yogurt, etc.), dairy fat content (skimmed/semi-skimmed/whole, double/single, full fat/reduced fat, and categories of the percentage of fat in spreads) and subjective dairy content (100 % dairy/high dairy/low dairy/non-dairy).
Table 2 Examples of several foods and the categories to which they belong, depending on the food group

F, fruit; V, vegetable.
* Another version of this quantitative fruit group that acknowledges the contribution of fruit juices to fruit (i.e. a proportion of ‘1’) exists.
The above-described crude, qualitative food groupings have in common that the food item (e.g. custard) can only be categorised into one category (e.g. cereal, other) of the same food group (‘crude’). Another, quantitative set of groupings identifies the fractions of a food item that are fruit, vegetables, red meat, white meat, processed meat, fatty fish and white fish (Table 2). For example, veal stewed in tomato sauce would be classified as 40 % red meat and 55 % vegetable (though in the crude group, 100 % of the weight consumed would have been assigned to ‘meat’). Fractions for disaggregation were mainly obtained by calculating recipes published in the CoF( Reference Holland, Welch and Unwin 15 ) and its supplements( Reference Holland, Unwin and Buss 16 – 25 ), as well as collected manufacturers' data for commercial products, an approach that is similar to the methods applied in other food databases( Reference Fitt, Mak and Stephen 7 , Reference Prynne, Wagemakers and Stephen 9 ).
Although a distinction was made between the qualitative and quantitative food groups, they can be combined (Table 2). For example, ‘apple crumble’ contains ‘apple, used in dishes’ according to the F&V variety group; multiplying the portion size consumed with the fruit fraction group (here 0·62) will give the amount of cooked apple in this dish. Another example is that an estimate of the minimum and maximum likely amounts of canned products within (homemade) food items can be obtained by adding the percentages in the latter seven columns in Table 2 (e.g. tuna and sweetcorn sandwich filling, though classified as a non-canned food item, could contain as much as 85 % of canned products).
Statistical analyses
All analyses were stratified by sex. We calculated the mean, median, standard deviation, 2·5th and 97·5th percentiles of energy intake (EI), and the amounts of macronutrients and a selection of micronutrients. Differences between the sexes were tested using the Mann–Whitney test; a P value < 0·05 was considered significant. In order to compare energy intakes with nationally representative data( Reference Henderson, Gregory and Irving 31 , Reference Finch, Doyle and Lowe 32 ), we stratified the results by age ( ≤ 65 years and >65 years).
The mean of a participant's EI and TEE was plotted against the difference (TEE–EI) to test for agreement using Bland–Altman plots( Reference Bland and Altman 33 ). Approximately 95 % of the observations are between the limits of agreement (meandiff± (1·96 × sd diff)). Under-reporters were crudely defined as participants with a difference in TEE–EI that resulted in values greater than 0; the degree of under-reporting was expressed in three categories (0–1, 1–2 and ≥ 2 MJ/d). We stratified the results by BMI ( ≤ 25 and >25 kg/m2), but without any further adjustment or transformation of the data.
A similar descriptive analysis was completed for meat, fish and F&V consumption, comparing the crude (qualitative) and the disaggregated (quantitative) food groupings (Table 3). The Spearman correlations of these food group data were calculated and Bland–Altman plots were created to assess agreement. All analyses were conducted using SPSS version 19 (IBM).
Table 3 Classification of food items into crude groupings and the criteria applied for disaggregating food items in the European Prospective Investigation into Cancer-Norfolk study

Results
Response rate for the 7 d diet diary
At their health examination, 25 639 participants were asked about their dietary habits during an interviewed 24 h diet recall (which formed the data for the 1st day of the 7dDD). Only 132 participants did not provide details during the recall. Diary data were obtained for 11 535 (99·4 %) of the men, of whom 10 354 (89·8 %) returned a fully completed 7dDD (data for 7 d). Among women, these numbers were 13 972 (99·6 %) and 12 779 (91·5 %), respectively.
Energy intake
The mean energy consumed was 9·44 (sd 2·22) MJ/d for men and 7·15 (sd 1·66) MJ/d for women. However, EI was 0·4 MJ/d lower among overweight and obese participants (P< 0·001) compared with that among participants with a BMI ≤ 25 kg/m2 (Table 4). The 95 % CI of the mean difference between EI and TEE (TEE–EI) showed wide limits of agreement and were associated with the mean, with marked differences being observed between the sexes and BMI categories (Table 4). For the median PAL value of 1·63, the non-stratified mean difference between TEE and EI was 1·79 (sd 1·98) MJ/d; we, therefore, created three levels of energy disagreement: < 1; 1–2; ≥ 2 MJ/d. The estimated proportion of under-reporters (assuming that all levels of disagreement were correctly identified) could be as large as 39–86 % among men and 49–91 % among women, depending on the assumed PAL. The degree of estimated under-reporting was lower in participants with a BMI ≤ 25 kg/m2, but two to three times as many participants under-reported by >2 MJ/d when overweight/obese. We explored whether the duration for which the participants were asked to record data in their diet diaries contributed to the mean lower EI, but found no evidence of declining EI as diary completion progressed (Fig. 1).
Table 4 Energy intake (EI) by subcategories of BMI* (Mean values and standard deviations)
TEE, total energy expenditure; PAL, physical activity level.
* TEE was calculated using the Henry equation and different levels of assumed activity (PAL) in the European Prospective Investigation into Cancer-Norfolk population. EI and TEE were compared using Bland–Altman plots. The limits of agreement and the proportion of under-reporters for each level of assumed PAL are given, stratified by BMI. Analysis only included participants who recorded data for 7 d in their 7 d diet diaries.
† The chosen PAL values represent the 10th, 25th and 50th centiles of the distribution used in the Scientific Advisory Committee on Nutrition report( 12 ).
‡ Under-reporters were defined as participants with a difference in TEE − EI that resulted in values greater than 0; the degree of under-reporting was expressed in three categories (0–1, 1–2 and ≥ 2 MJ/d).
§ The difference in energy was calculated as follows: estimated TEE − EI. Approximately 95 % of the observations are between the limits of agreement (meandiff± (1·96 × sd diff))( Reference Bland and Altman 33 ). The upper limit of agreement reflects under-reporting of EI and the lower limit of agreement reflects over-reporting of EI.

Fig. 1 Boxplot of averaged energy intake and energy intake on seven individual days (kJ/d), stratified by sex (n 25 507). The results of the averaged data are included since these data have been used for most publications to date. ![]() , Energy, average (kJ);
, Energy, average (kJ); ![]() , energy day 1 (kJ);
, energy day 1 (kJ); ![]() , energy day 2 (kJ);
, energy day 2 (kJ); ![]() , energy day 3 (kJ);
, energy day 3 (kJ); ![]() , energy day 4 (kJ);
, energy day 4 (kJ); ![]() , energy day 5 (kJ);
, energy day 5 (kJ); ![]() , energy day 6 (kJ);
, energy day 6 (kJ); ![]() , energy day 7 (kJ). A circle was assigned to every observation/value that is >1·5– < 3 times the interquartile range below the 25th percentile or above the 75th percentile, and an asterisk to every observation/value that is >3 times the interquartile range below the 25th percentile or above the 75th percentile.
, energy day 7 (kJ). A circle was assigned to every observation/value that is >1·5– < 3 times the interquartile range below the 25th percentile or above the 75th percentile, and an asterisk to every observation/value that is >3 times the interquartile range below the 25th percentile or above the 75th percentile.
Nutrient intake
There were small, but mostly significant differences in men and women, when comparing the two age groups ( ≤ 65 v. >65 years) for their contribution of macronutrient intake to total energy consumption (Fig. 2). Energy was mainly provided by carbohydrates, followed by fat, protein and alcohol. Of the energy providers, only sugars were consumed in a greater proportion by women than by men. Micronutrient intake, with the exception of vitamin C intake, was significantly higher among men than among women (P< 0·001), although when expressed per MJ of EI, women consumed a more nutrient-dense diet than men (Table 5).
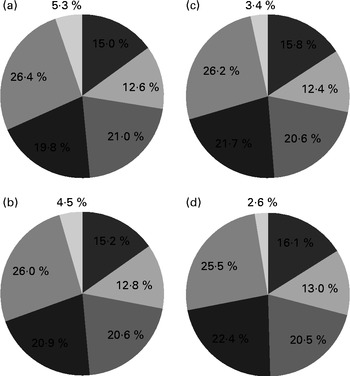
Fig. 2 Distribution of macronutrients as a percentage of total energy intake, stratified by sex and age (n 25 507). On using the Mann–Whitney statistic, all the differences between age groups (within the same sex) were statistically significant apart from the energy intake provided by unsaturated fatty acid intake in women. (a) Men ≤ 65 years: 9·75 (2·25) MJ/d (n 8095). (b) Men >65 years: 8·75 (1·96) MJ/d (n 3440). (c) Women ≤ 65 years: 7·27 (1·67) MJ/d (n 10 174). (d) Women >65 years: 6·81 (1·57) MJ/d (n 3798). ![]() , Protein;
, Protein; ![]() , saturated fat;
, saturated fat; ![]() , unsaturated fat;
, unsaturated fat; ![]() , sugar;
, sugar; ![]() , starch;
, starch; ![]() , alcohol.
, alcohol.
Table 5 Measures of central tendency and spread in energy, macronutrient and micronutrient intakes in the European Prospective Investigation into Cancer-Norfolk cohort, stratified by sex (n 25 507) (Mean values and standard deviations; medians, 2·5th and 97·5th percentiles)

NSP, non-starch polysaccharides; TE, tocopherol equivalents.
* The distribution among consumers of alcoholic beverages only (alcohol (as a nutrient) >0·5 g/d): men, n 8665; women, n 8660.
Intake of fish, meat, fruit and vegetables
Table 6 shows that the mean intakes of foods consumed were influenced by aggregation or disaggregation of the data. For F&V, the crude groupings underestimated the amounts consumed; however, for meat and fish, the quantities were overestimated with the crude grouping system. The Spearman correlations between the crude and disaggregated data varied between 0·85 and 0·99 (Table 6). Despite these high correlations, the agreement between the two measures was low (Fig. 3). For example, disaggregated meat consumption could be 93 g/d higher or 39 g/d lower than the crude measure of meat consumption. We observed for all the food groups that with higher mean consumption, the differences between the two food grouping methods became larger (heteroscedasticity).
Table 6 Consumption of fruit, vegetables, meat and fish in the European Prospective Investigation into Cancer-Norfolk cohort (n 25 507)* (Mean values and standard deviations; medians, 2·5th and 97·5th percentiles)

* Weights are given for two types of food groupings: crude (C) (qualitative groups) and disaggregated (D) foods.
† Spearman's correlation (r S) between the disaggregated and crude variables. All correlations were significant at P< 0·01.

Fig. 3 Comparison of the crude and disaggregated methods used for measuring (a) fruit, (b) vegetable (veg), (c) meat and (d) fish consumption in the European Prospective Investigation Into Cancer-Norfolk cohort using Bland–Altman plots. Data only included those of participants who completed their 7 d diet diaries for all 7 d (n 23 149).
Discussion
We have shown the developments and capacities of the DINERMO nutrient and food group calculation programs for 25 507 participants (99 %) who contributed diary data at baseline to the EPIC-Norfolk study. Their mean EI remained stable across the diary days. There was under-reporting of EI, especially among overweight/obese participants. Micronutrient density was higher among women than among men. The food groups compared correlated highly, but they were in disagreement greatly with regard to absolute quantities, with the biggest differences being observed for meat and vegetables.
In nutritional epidemiology, under-reporting of EI is well established. Results from the OPEN (Observing Protein and Energy Nutrition) study have shown energy under-reporting to be prevalent in 21 % of the men (by reporting 10 % lower EI than required) and 22 % of the women (by reporting 14 % lower EI than required)( Reference Subar, Kipnis and Troiano 5 ). Measurements of urinary nitrogen and potassium excretion in a subcohort of the EPIC-Norfolk study confirmed that under-reporting takes place( Reference Bingham, Welch and McTaggart 3 ). When EI was graphed against BMR quintiles, PAL values decreased with increasing BMR and these PAL values were relatively low (1·22–1·33)( Reference Bingham, Welch and McTaggart 3 ). In the present analysis, we wanted to express under-reporting in energy amounts and not in PAL, as is common with the Goldberg criteria( Reference MacIntyre, Gibney, Lanham-New and Cassidy 34 ). Hence, we chose to apply a Bland–Altman plot to assess the agreement between TEE and EI and compensated for our crude definition of defining even small deviations above zero to mean under-reporting, by including three levels of energy disagreement. We used age, weight and height as biomarkers for energy requirement and calculated the BMR with the Henry equation, which is used to estimate energy requirements in the UK( 12 ). This BMR formula has indicated that 79 % can be categorised within ± 10 % of the measured RMR( 12 ). Results showed that the TEE exceeded EI in at least 40–50 % members of the EPIC-Norfolk cohort. Although these proportions of under-reporters cannot be directly compared against those studied using the doubly labelled water methods or the Goldberg cut-offs, since we did not account for error in both the TEE and the EI, we saw similar trends: women were more likely to under-report and that under-reporting increased in overweight/obese participants. However, for EI in the 50–65 years age category in the National Diet and Nutrition Survey, a mean of 9·55 (sd 2·38) MJ/d for men and 6·91 (sd 1·74) MJ/d for women( Reference Henderson, Gregory and Irving 31 ) has been reported, which is close to the EI in the EPIC-Norfolk study. A similar comparison can be made with the 65–74 years age category in the survey for people aged above 65 years, where men consumed a mean EI of 8·21 (sd 1·97) MJ/d and women 6·07 (sd 1·38) MJ/d( Reference Finch, Doyle and Lowe 32 ). The percentages of energy derived from protein and fat were slightly lower and those derived from carbohydrate and alcohol were slightly higher than those observed in the EPIC-Norfolk cohort( Reference Finch, Doyle and Lowe 32 ). Under-reporting in the EPIC-Norfolk study is hence comparable, and the small differences in EI in these surveys are likely to be because of sampling (different age distributions) as well as differences in data processing programs.
The EI was approximately stable during diary completion. This is encouraging considering that others have observed a downward trend with the duration of diary completion exceeding 3 d( Reference Thompson, Subar, Coulston and Boushey 4 ). However, the diary days are (mostly) consecutive and measures of variety could, as a result, be lower than expected. This has been compensated for by requesting the participants to complete another 7dDD after 18 months( Reference Nelson, Bingham, Margetts and Nelson 35 ); a subset of these repeat 7dDD has been used to correct OR for measurement error due to variation in nutrient intakes( Reference Dahm, Keogh and Spencer 30 ).
The micronutrient data presented herein do not include data on sources of dietary supplements. Supplements are being used by 40 % members of the cohort( Reference Lentjes, Bhaniani and Mulligan 36 ) and have been shown to change the nutrient intake distribution( Reference Lentjes, Bhaniani and Mulligan 37 ). How this affects the proportions below the estimated average requirements or above the safe upper levels in this cohort is yet to be assessed.
A food is more than the sum of its nutrients, and public health messages on the types and amounts of foods to be consumed are being given; hence, many studies and surveys tend to analyse food consumption rather than nutrient consumption, but as a result, comparisons of study results become more complicated. We were unable to compare the consumption data of meat and fish due to differences in groupings of foods in the National Diet and Nutrition Survey data; however, fruit consumption in the EPIC-Norfolk study appeared to be up to 15 % (men) and 18 % (women) higher and vegetable consumption ranged from 4 % lower (men) up to 13 % higher (women)( Reference Henderson, Gregory and Swan 38 ). These differences became more pronounced when comparing disaggregated weights and reached 27 % for fruit and 8 % for vegetables in men and 20 % for both F&V in women. F&V consumption after disaggregation could add as much as 0·5–1 portion to a participant's 5-a-day; however, it is still unclear whether health effects of F&V are similar when used in a dish such as an apple pie or cauliflower cheese.
The EPIC-Norfolk 7dDD data are the largest data collection of its kind. Until now, the only dietary data from the full EPIC-Norfolk cohort were based on a FFQ( Reference Welch, Luben and Khaw 39 ), which is known to overestimate fruit, vegetable and milk consumption( Reference Bingham, Welch and McTaggart 3 ). Moreover, the 7dDD enables us to study diet variety and meal patterns, which are areas that have shown potential for intervention( Reference Purslow, Sandhu and Forouhi 40 , Reference Cooper, Sharp and Lentjes 41 ).
The computer programs described are still undergoing development, and we hope to change the calculation method to an approach that separates all ingredients within dishes, similar to that described by Subar et al. ( Reference Subar, Kipnis and Troiano 5 ), providing a fully ‘matured’ system, which we plan to name PECORINO (Precision in EPIC-Norfolk: Calculation Of Recipes Improves Nutrient Output). This system will have several advantages: first, the reporting of disaggregated amounts would no longer be restricted to the seven groups mentioned in the present paper; second, any extension of the food database with nutrient or phytochemical data will be a process that can be limited to ‘simple/single foods’, since only food items such as ‘flour’, ‘apple’ and ‘sugar’ rather than dishes such as ‘apple crumble’ and ‘apple pie’ will need assessment of their nutrient profile; lastly, it enables modifications and updating of default recipes published in the CoF to make them better suited for the EPIC-Norfolk cohort data.
Conclusion
The response rate for 7dDD in the EPIC-Norfolk study has been extremely good. Under-reporting may be an issue, but not more so than that found in national surveys, and under-reporting is not likely to have been caused by the duration for which participants were asked to record data in their diet diaries, since EI did not decrease during the 7 d. Despite this, the association of under-reporting with BMI will be important for the interpretation of future endpoint analyses. The large number of variables in the EPIC-Norfolk data has made these data highly flexible to test new hypotheses in nutritional epidemiology or even use new approaches such as hypothesis-free nutrient-wide association studies along the lines of gene-wide association studies( Reference Forman and Willett 42 ). Groupings of food items and/or disaggregation can cause differences in absolute estimates, though the ranking of individuals will be less affected. The choice of aggregated or disaggregated variables will influence the estimates of food groups and comparison of results between studies.
Acknowledgements
The authors thank the dedicated team of data enterers who entered data for over 6 500 000 food items and all nutritionists who made a major contribution to data checking and cleaning in the past 16 years. They cordially thank Sheila Rodwell (Bingham) for her fundamental contributions to the work on dietary biomarkers and development of the 7dDD. The collection of data on the quantitative food groups was partly made possible by collaboration with the Medical Research Council Centre for Nutritional Epidemiology in Cancer Prevention and Survival (CNC); the authors thank the nutritionists who provided these data.
This work was supported by the Medical Research Council. The Medical Research Council had no role in the design and analysis of the study or in the writing of this article.
Contribution of each author was as follows: M. A. H. L. prepared the manuscript, carried out the statistical analyses, checked diary data and assisted in the re-writes of the different DINERMO programs; A. M., A. A. M. and N. A. P. checked diary data, oversaw data entry and contributed with their experience to the many program revisions; D. P.-S. wrote the last revision of the DINERMO program; R. N. L. and A. B. maintained the earlier versions of DINERMO programs as well as the wider range of cohort data available; A. A. W. developed the concept of Data into Nutrients for Epidemiological Research and was involved in the early versions of the programs; K.-T. K. is the principal investigator of the EPIC-Norfolk study. All co-authors read the manuscript and provided their input.
None of the authors has any conflicts of interest.
Additional/online material: More detailed information on the categorisation of foods and food groups will be provided on the website http://www.epic-norfolk.org.uk or can be obtained from the corresponding author.


