


Nutrition is a key element in geriatric health. Undernutrition or protein–energy malnutrition is prevalent among the elderly. Studies have shown that approximately 10–15 % of the general elderly population or community-living elderly are malnourished or at risk of malnutrition(Reference Tsai, Ho and Chang1, Reference Tsai, Chang and Yang2). Rates are higher for the elderly in various living settings: 30–50 % for the elderly in care centres; about 80 % in nursing homes; up to 100 % in hospitalised patients(Reference Cereda3, Reference Tsai, Chang and Wang4). Malnutrition generally develops inconspicuously and if not stopped early in time, it can have serious consequences ranging from weight loss, general weakness, fatigue, anaemia, weakening of the immune system, increased susceptibility to diseases and infections, functional impairment, cognitive decline and even death. To stop this vicious cycle, early detection is crucial. To enable early detection, routine screening is necessary. However, to be used routinely, the tool must be simple, non-time-consuming and friendly to the users, and gentle and non-invasive to patients. It should not cause much pain, discomfort, suffering or great inconvenience to patients. Most importantly, diagnosis must be valid and reliable.
Although there are several geriatric nutrition assessment tools, few meet all these conditions. The Mini-Nutritional Assessment (MNA) is one that is closely meeting all these conditions. The MNA is one of the most widely used nutritional screening/assessment tools. It was developed in the 1990s by Guigoz et al. (Reference Guigoz, Lauque and Vellas5, Reference Vellas, Guigoz and Garry6) based on the clinical data of Western elderly. The MNA consists of eighteen items and evaluates anthropometric, dietary, global and self-rated aspects of nutritional status; it normally takes about 10–20 min to administer, but the process could be much longer if the subject is frail or bedridden. This lengthy feature, to some degree, impedes its usefulness. To save rating time, Rubenstein et al. (Reference Rubenstein, Harker and Salva7) restructured it into a two-part and two-stage tool. The first part is the short form (SF) that consists of six items and serves as a pre-screening unit. Those who are pre-screened as possible malnutrition are further evaluated with twelve additional items (the rest of the full scale) to confirm the diagnosis. The SF generally predicts the full MNA well(Reference Tsai, Chang and Wang4). Recently, Kaiser et al. (Reference Kaiser, Bauer and Rämsch8) have further proposed to use the MNA-SF as a stand-alone unit. In addition to rating the nutritional status, the MNA-SF also predicts the follow-up mortality risk of hospitalised or institutionalised elderly(Reference Persson, Brismar and Katzarski9, Reference Tsai, Yang and Wang10). Since the MNA was developed for grading the nutritional status of Western elderly, modification would be necessary, especially regarding anthropometric and dietary items(Reference Deurenberg, Deurenberg-Yap and Guricci11–13), if the tool is to be applied to a non-Western population(Reference Chumlea14, Reference Chumlea15).
Thus, we have recently modified the MNA-SF for the Taiwanese elderly (Taiwanese version 1, T1) by adopting population-specific anthropometric cut-off points. We have also further developed an alternative MNA-SF (Taiwanese version 2, T2) by replacing calf circumference (CC) for the BMI item(Reference Tsai, Chang and Yang2, Reference Tsai, Chang and Wang4). However, the abilities of these SF in rating the nutritional status of the elderly have not been robustly tested in large population-based samples. Since a simple, reliable and non-invasive tool is crucial for identifying the elderly who are at risk of malnutrition, we undertook the present study to validate the two versions of MNA-SF in a large national sample of elderly Taiwanese.
Methods
Source of data
The source of data was the ‘Taiwan Longitudinal Survey on Aging’, a population-based longitudinal cohort study conducted by the Bureau of Health Promotion of Taiwan. The study sample was drawn with a multistage national probability sampling process in 1989(16). The first stage was to stratify the Taiwanese population into 361 primary sampling units and from which to randomly select fifty-six primary sampling units for further sampling, The second stage was proportional-to-size random selections of blocks (lins, the smallest administrative unit) from each of the selected primary sampling units, and the final stage was random selections of two eligible persons from each of the selected blocks. The process selected 4412 men and women, ≥ 60 years old in 1989, to serve as the initial cohort for a longitudinal study. In order to maintain and further extend the younger age range of the study cohort, a second sample of 2462 subjects, 50–66 years old, was drawn from the population with the same procedure and added to the original cohort in 1996. The original or the combined cohort has undergone a series of six surveys to date (including 1989, 1993, 1996, 1999, 2003 and 2007).
In each survey, trained interviewers performed face-to-face interviews with a structured questionnaire on each subject at the participant's residence for eliciting demographic, socio-economic, lifestyle and health- or healthcare-related data. A research institute trained all interviewers to ensure good consistency in interview skills. All components of the questionnaire were pre-tested and field-tested to ensure the validity and reliability before data collection. The completion rate of the survey ranged from 79·1 to 91·8 %. The 1999 survey had expanded coverage on diet and nutrition, and included a nutritional assessment with the MNA administered by the interviewer. Therefore, it was appropriate for the present study. The dataset included all MNA items, except fluid intake. The survey from which the present study was based on was conducted according to the guidelines laid down in the Declaration of Helsinki and all procedures involving human subjects were reviewed and approved by government-appointed representatives. Written informed consent was obtained from all subjects. Further detail of the sampling process has been described elsewhere(Reference Tsai, Yang and Wang10). The Bureau has released datasets of all six waves of the study for academic research. The present study analysed the data of 2674 participants who were ≥ 65 years of age in 1999.
Mini-Nutritional Assessment
We have recently developed two modified MNA versions for the Taiwanese. MNA-T1 adopted the Taiwanese-specific anthropometric cut-offs (items F, Q and R) and food patterns (items K and M)(Reference Tsai, Ho and Chang17, Reference Tsai and Ku18). MNA-T2 further replaced mid-arm circumference and CC items for the BMI item (by redistributing one of the three BMI points to the mid-arm circumference and two points to the CC). So, items Q and R in MNA-T2 are two and three points, respectively, instead of one point each in the original MNA. For MNA-T2-SF, CC replaces BMI. Thus, MNA-T2 contains no BMI item and needs no weight or height measurement, a process that can be quite involved and with questionable accuracy in functionally impaired subjects. MNA-T2 has been shown to function at least as well as MNA-T1(Reference Tsai, Chang and Wang4, Reference Kaiser, Bauer and Uter19).
Grading the nutritional status and follow-up mortality
The nutritional status of each subject was rated with the full and MNA-T1-SF and -T2-SF. All items, except fluid intake, were available in the dataset. Therefore, the score of the full MNA was based on seventeen items (sixteen items in T2) totalling twenty-nine points rather than eighteen items and thirty points. However, the total score was proportionately adjusted on a full-score (thirty-point) basis. A total score < 17 was classified as malnourished, 17–23·5 as at risk of malnutrition and >23·5 as normal(Reference Guigoz, Lauque and Vellas5). The grading ability of the full scales of MNA-T1 and -T2 has been validated in elderly Taiwanese living in various settings(Reference Tsai, Chang and Wang4). Thus, these full scales were used as the criterion scales in the present study. For the MNA-SF, data for all six items were available in the dataset. The MNA-SF has a maximum score of 14, and a score ≤ 7 was considered as malnourished, 8–11 as at risk of malnutrition and ≥ 12 as normal(Reference Kaiser, Bauer and Rämsch8).
In geriatric populations, malnutrition is a strong predictor of follow-up mortality(Reference Persson, Brismar and Katzarski9, Reference Tsai, Yang and Wang10). The MNA has also been shown to predict follow-up mortality in the elderly living in various settings. Lack of any better nutritional reference standard, we used the follow-up 4-year mortality as an external reference. Mortality data were taken from records gathered by the survey and confirmed by the data maintained by the National Household Registry and the National Health Insurance System.
Statistical analysis
All statistical analyses were performed with the SPSS/Windows 15.0 software package (SPSS, Inc.). Descriptive data are expressed as n and percentages or means and standard deviations. The nutritional status of each subject was graded with the full and MNA-T1-SF and -T2-SF. Cross-classification and weighted κ were performed to determine the agreement between the full and SF scales of the MNA. Cox regression analyses were performed to determine the association of follow-up 4-year relative mortality risk with the nutritional status graded with various versions of the MNA at baseline adjusted for age, sex and years of formal education. In the analysis, lengths of survival time were calculated according to the records for subjects who died during the follow-up 4 years, and taken 48 months as the censoring time for subjects who survived. All values were weighting-adjusted according to the survey design. Statistical significance for all analyses was set at α = 0·05.
Results
Table 1 shows the characteristics of the subjects. The sample included more men (55 %) than women; 57 % were 65–74 years old, 37 % were 75–84 years old and the rest were over 85 years old; 23 % were current smokers and 21 % were past smokers; 22 % drank alcohol ≥ 1 time/week; roughly 4 % were current betel-nut chewers and 4 % were past chewers (betel quid is used as a psychoactive substance mainly by adult males in Southeastern Asia and it increases the risk of oral cancer)(Reference Reichart and Warnakulasuriya20); and 56 % had physical exercise ≥ 3 times/week. Of the 2674 elderly, 500 died during the follow-up 4 years.
Table 1 Characteristics of the subjects (n 2674) (Number of subjects and percentages)
* Defined as >30 min of medium or heavy exercise.
Table 2 shows the distribution of item scores graded with MNA-T1 and T2. With the exception of items F, Q and R, the two versions shared the same questions and scores. Among the SF items, roughly 10 % of subjects had poor appetite and 16 % lost weight during the last 3 months, nearly 8 % had impaired mobility, slightly over 10 % had neuropsychological problems and about 28 % had less than desired BMI (21 kg/m2) but only about 8 % had less than desired CC. Among the non-SF items, about 15 % had skin sores, 13 % consumed less than desirable protein-rich foods, 19 % self-rated poor nutrition or unsure about own nutritional status, 45 % rated own health status not as good as peers and 6 % had less than desired mid-arm circumference. The full MNA-T1 rated 2·0, 13·9 and 84·0 %; the full MNA-T2 rated 1·6, 12·9 and 85·5 %; the MNA-T1-SF rated 3·6, 19·5 and 76·9 %; and the MNA-T2-SF rated 2·8, 18·3 and 78·9 % as malnourished, at risk of malnutrition and normal, respectively. Table 3 shows the cross-classifications of the nutritional status rated with the MNA-SF against that rated with the full MNA. Both versions showed good consistency between the SF and the full scales. The two versions had comparable agreement between the respective SF and the full scale (weighted κ: 0·679 for T1 and 0·677 for T2, both P< 0·001). Only thirty-eight subjects were rated downward (rated as normal instead of as at risk of malnutrition or malnourished) by the MNA-T1-SF and forty-five by the MNA-T2-SF compared with the respective full MNA.
Table 2 Item-score patterns of the Mini-Nutritional Assessment (MNA) Taiwan version 1 (T1) and Taiwan version 2 (T2) by 2674 elderly Taiwanese* (Number of subjects and percentages)
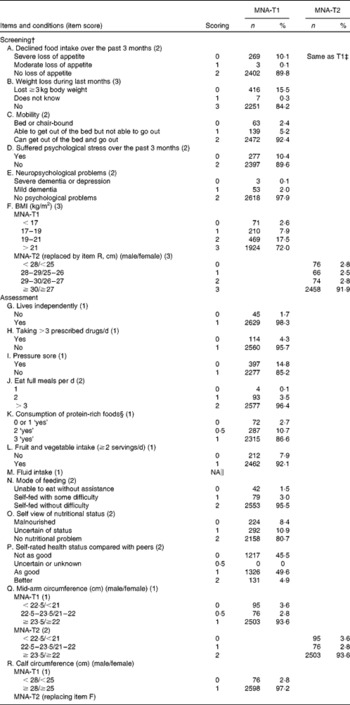
* The full MNA-T1 rated 2·0, 13·9 and 84·0 %, the full MNA-T2 rated 1·6, 12·9 and 85·5 %, the short-form (SF) MNA-T1 rated 3·6, 19·5 and 76·9 % and the MNA-T2-SF rated 2·8, 18·3 and 78·9 % as malnourished, at risk of malnutrition and normal, respectively.
† The screening section (first six items) is the SF. Item F is replaced by item R in MNA-T2.
‡ Items not indicated are the same as MNA-T1.
§ Item K – frequency of consumption, instead of servings, was used.
∥ Data not available in the dataset.
Table 3 Cross-classification of the nutritional status graded with the full Mini-Nutritional Assessment (MNA) and the short-form (SF) MNA (n 2674)
T1, Taiwan version 1; T2, Taiwan version 2.
***P <0·001.
Fig. 1 shows the Cox regression analyses of the follow-up 4-year survival curves stratified by nutritional status rated with the full and MNA-T1-SF and -T2-SF, respectively, adjusted for age, sex and years of formal education. Hazard ratios were 1, 2·39 (95 % CI 1·95, 2·94) and 6·59 (95 % CI 4·69, 9·27) for the full MNA-T1; 1, 1·82 (95 % CI 1·49, 2·22) and 4·17 (95 % CI 3·10, 5·62) for the MNA-T1-SF; 1, 2·50 (95 % CI 2·03, 3·08), and 8·10 (95 % CI 5·67, 11·57) for the full MNA-T2; and 1, 2·10 (95 % CI 1·73, 2·56) and 5·70 (95 % CI 4·16, 7·79) for the MNA-T2-SF, for the elderly rated as normal, at risk of malnutrition and malnourished, respectively (all P< 0·001). MNA-T2 (both full scale and SF) seems to have stronger ability in predicting follow-up mortality than MNA-T1.
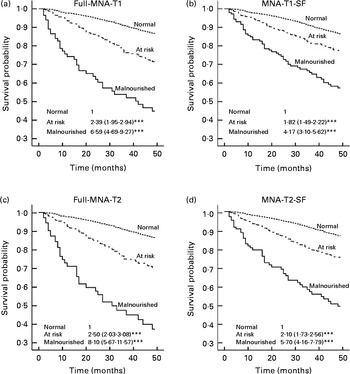
Fig. 1 Cox regression analyses of the follow-up 4-year survival curves stratified by nutritional status rated with the full and short-form (SF) versions of Taiwan version 1 (T1) and 2 (T2), respectively, adjusted for age, sex and years of formal education. Sets of data in each panel are hazard ratios (HR) and 95 % CI for subjects rated as normal (reference), at risk of malnutrition and malnourished, respectively. (a) Full Mini-Nutritional Assessment (MNA)-T1: normal – HR 1, at risk of malnutrition – HR 2·39 (95 % CI 1·95, 2·94, P< 0·001), malnourished – HR 6·59 (95 % CI 4·69, 9·27, P< 0·001); (b) MNA-T1-SF: normal – HR 1, at risk of malnutrition – HR 1·82 (95 % CI 1·49, 2·22, P< 0·001), malnourished – HR 4·17 (95 % CI 3·10, 5·62, P< 0·001); (c) full MNA-T2: normal – HR 1, at risk of malnutrition – HR 2·50 (95 % CI 2·03, 3·08, P< 0·001), malnourished – HR 8·10 (95 % CI 5·67, 11·57, P< 0·001); (d) MNA-T2-SF: normal – HR 1, at risk of malnutrition – HR 2·10 (95 % CI 1·73, 2·56, P< 0·001), malnourished – HR 5·70 (95 % CI 4·16, 7·79, P< 0·001). In the analysis, lengths of survival time were calculated according to the records maintained by the ‘Taiwan Longitudinal Survey on Aging’ project for subjects who died during the follow-up 4 years, and taken 48 months as the censoring time for subjects who survived.
Discussion
Consistency between the short-form Mini-Nutritional Assessments and full Mini-Nutritional Assessments
The results show that both MNA-T1-SF and MNA-T2-SF have good consistency with the respective full scales in classifying nutritional status and have good abilities in predicting the follow-up 4-year mortality risk in a large population-representative sample of elderly Taiwanese. Compared with the full MNA, the respective SF rated larger proportions of the elderly as malnourished or as at risk of malnutrition and both SF were as effective as the full MNA in predicting mortality during the follow-up 4 years. Nutritional classifications graded with the normalised SF are well supported by the follow-up 4-year mortality.
Comparing with other studies
According to Cox regression, MNA-T2 is at least as effective as MNA-T1 in predicting the follow-up 4-year mortality risk. Both full and MNA-T2-SF have slightly higher hazard ratios (and 95 % CI) than the respective T1 scales. This finding is somewhat different from that observed by Kaiser et al. (Reference Kaiser, Bauer and Uter19) who reported that CC-MNA-SF (equivalent to MNA-T2 in the present study) tended to underestimate nutritional risk compared with BMI-MNA-SF (equivalent to MNA-T1). A possible reason could be the differences in the scoring of item R (CC). Kaiser et al. (Reference Kaiser, Bauer and Uter19) used an all-or-none (either three points or none with a single cut-off point of 31 cm) scoring system in CC-MNA-SF, whereas MNA-T2 used a graded scoring system (one additional point for each incremental centimetre for up to three points). Thus, subjects with marginal CC would get partial scores similar to item F (BMI) in MNA-T1.
Short-form Mini-Nutritional Assessments compared well with the full Mini-Nutritional Assessments
Thus, in principle, the MNA-SF can function as a stand-alone unit for screening/assessing the nutritional status. Recently, Kaiser et al. (Reference Kaiser, Bauer and Rämsch8) found that the MNA-SF compared well with the full MNA by analysing studies conducted in many countries and proposed to revise the two-category MNA-SF into a three-category scale so that it could function as a stand-alone tool similar to the full MNA. In the present study, we have seen that the normalised SF can function satisfactorily in classifying the nutritional status, and CC could substitute BMI and still at least preserve the rating ability of the scale.
A stand-alone short-form Mini-Nutritional Assessments with calf circumference has advantages
A stand-alone MNA-SF with CC clearly has many advantages. It is probably simpler and easier to measure CC than to measure weight and height, especially for the frail or bedridden elderly. The simplicity, brevity and non-invasiveness of the tool can make ‘routine screening and timely intervention’ an easier goal to fulfil in geriatric care. These features will also make the MNA-SF a more acceptable tool for screening or monitoring the nutritional status of the elderly at the community or population level. However, the applicability of the MNA-SF in persons on haemodialysis requires further investigation because the tool has been observed to underrate the risk of malnutrition in these persons(Reference Tsai and Chang21).
Limitations of the study
The present study has some limitations. (1) Ideally, the reference standard used to compare the predictive ability of the MNA scales should be a widely accepted nutritional indicator such as serum albumin. However, the ‘Taiwan Longitudinal Survey on Aging’ does not contain such data. Further confirmation of the present study results with a more robust nutritional indicator is desired. (2) The full MNA were based on seventeen, instead of eighteen, items due to the lack of water intake data in the dataset, which might lead to a slight underestimation of nutritional risk by the full scale. (3) Most data of the survey were collected by questionnaire interviews which generally have acceptable quality but shortcomings are inevitable. A feature of the present study is that the dataset is from a relatively large population-based sample. The present results should be applicable to populations that share the anthropometric and lifestyle characteristics of the Taiwanese.
Conclusion
The study has shown that both MNA-SF are appropriate for classifying the nutritional status of elderly Taiwanese. Both versions have high consistency with the full scales and have strong ability in predicting follow-up mortality which is a major variable reflecting the nutritional status. These results suggest that both MNA-SF can function as stand-alone units for screening the nutritional risk of elderly Taiwanese. We recommend both versions (T1 and T2) of this simple, time-efficient and non-invasive MNA-SF for ‘routine screening’ of the nutritional status of elderly Taiwanese living in most settings.
Acknowledgements
The present study is based on the data from the ‘Taiwan Longitudinal Survey on Aging’, provided by the Bureau of Health Promotion, Department of Health, ROC (Taiwan). Descriptions or conclusions herein do not represent the viewpoint of the Bureau. The study received no funding support from any source. A. C. T. conceived the idea and directed the study, and is the main writer of the manuscript; T.-L. C. performed the statistical analysis and reviewed the manuscript; J.-Y. W. directed the statistical analysis and reviewed the manuscript. All authors declare that they have no competing interests.


