


The prevalence of obesity is high in different geographic regions worldwide(Reference Low, Chin and Deurenberg-Yap1). In Brazil, overweight (BMI ≥ 25 kg/m2) was detected in 49 % of adults and obesity (BMI ≥ 30 kg/m2) in 14·8 %, with a higher prevalence of obesity in women (16·9 %) than in men (12·5 %)(2). Overwhelming evidence supports the importance of obesity in the pathogenesis and progression of CVD(Reference Lavie, Milani and Ventura3). Weight control is an important strategy to decrease morbidity and mortality.
Dietary intervention is an important aspect in the treatment of excess body weight(Reference Tsigos, Hainer and Basdevant4) and a decrease in energy intake is the most important component of any weight-loss strategy(Reference Bessesen5). However, the possibility that dietary Ca and/or dairy products (which are the main source of dietary Ca) may affect energy balance, with an anti-obesity effect, has attracted considerable attention(Reference Zemel6, Reference Dougkas, Reynolds and Givens7).
The initial evidence of an inverse relationship between dietary Ca and/or dairy product intake with total or abdominal adiposity came from some epidemiological studies involving different populations(Reference Pereira, Jacobs and Horn8–Reference Eilat-Adar, Xu and Loria14). Randomised clinical trials were developed to test the effects of dietary Ca supplementation on adiposity; however, the results of these trials are controversial and inconclusive(Reference Zemel, Thompson and Milstead15–Reference Palacios, Bertra'n and Ríos19). The supplementation of dietary Ca, associated or not with energy restriction, induced beneficial effects on total and/or abdominal adiposity in some studies(Reference Zemel, Thompson and Milstead15–Reference Faghih, Abadi and Hedayati17), but not in others(Reference Harvey-Berino, Gold and Lauber18, Reference Palacios, Bertra'n and Ríos19). One factor that probably contributes to the conflicting results is the lack of uniformity in the design of the studies. According to Van Loan(Reference Van Loan20), three important elements were present in studies showing a favourable effect of Ca and/or dairy product intake on weight loss. First, all individuals participating in the studies were overweight and/or obese. Second, subjects’ Ca intake was habitually inadequate ( < 600 mg/d) and an appropriate control group ( < 600 mg Ca/d) was used. Third, a moderate energy restriction was maintained throughout the study.
The ionised fraction of serum Ca is the biologically active form and it is controlled by different hormones, including parathormone (PTH)/and calcitriol(Reference Vaskonen21). It is recommended that adults aged between 19 and 50 years ingest 1000 mg Ca/d(22). Unfortunately, the ingestion of Ca by adults from Brazil is very much lower than the recommended levels, especially in women. It is estimated that men and women aged between 19 and 59 years consume daily 546·4 and 476·4 mg Ca, respectively(2).
The mechanism underlying the possible relationship between Ca and adiposity is still unclear. One of the suggested mechanisms is that a low Ca intake raises serum levels of calcitriol, which can stimulate adipocyte Ca influx. This increase in intracellular Ca levels ([Ca2+]i) could promote lipogenesis and inhibit lipolysis by increasing fatty acid synthase and inhibiting hormone-sensitive lipase. On the other hand, an increase in Ca intake can reduce serum levels of calcitriol, consequently reducing lipogenesis and stimulating lipolysis(Reference Zemel6, Reference Astrup, Kristensen and Gregersen23).
An inverse relationship between dietary Ca and/or dairy intake and blood pressure (BP) has been reported in various epidemiological studies showing that a reduced intake of Ca was associated with higher levels of BP and/or an increased risk of developing hypertension(Reference Wang, Manson and Buring24, Reference Engberink, Hendriksen and Schouten25). The randomised clinical trials that evaluated the effects of Ca supplementation found modest reduction of BP(Reference vanMierlo, Arends and Streppel26).
Recent studies have also suggested that dietary Ca may have beneficial effects on insulin resistance(Reference Tremblay and Gilbert27, Reference Richart, Thijs and Nawrot28) and dyslipidaemia(Reference Jacqmain, Doucet and Després9, Reference Lorenzen and Astrup29). However, the effects of Ca on these cardiovascular risk factors have not been proven. Few studies have evaluated the association of dietary Ca and/or dairy intake with biomarkers of inflammation and endothelial function and their results are conflicting(Reference Panagiotakos, Pitsavos and Zampelas30–Reference Stancliffe, Thorpe and Zemel34).
Therefore, the present study aimed to evaluate the associations of dietary Ca intake with total and abdominal adiposity, [Ca2+]i, metabolic profile, BP, inflammatory state and endothelial function in healthy Brazilian women. A secondary purpose was to investigate the association of [Ca2+]i with metabolic profile, BP, inflammatory state and endothelial function.
Subjects and methods
The present cross-sectional study was conducted at the Laboratory of Clinical and Experimental Pathophysiology, CLINEX, located at Pedro Ernesto University Hospital, of Rio de Janeiro State University. Participants were enrolled between May 2009 and August 2011. The study was conducted according to the guidelines laid down in the Declaration of Helsinki, and all procedures involving human subjects/patients were approved by the committee on ethics and research of the Pedro Ernesto University Hospital (1152-CEP/HUPE – CAAE: 0039.0.228.000-08). Written informed consent was obtained from all patients.
Potential participants were recruited at the Department of Plastic Surgery among candidates for lipoplasty and at the Department of Gynaecology among participants in the Family Planning Program. The inclusion criteria were women aged 18–50 years, without postmenopausal status.
The exclusion criteria were as follows: current Ca supplementation or use of any medication known to interfere with Ca metabolism; use of medications for weight loss; use of antidiabetic, antihypertensive and lipid-lowering drugs; recent changes (within previous 6 months) in dietary intake, body weight (>3 kg) and intensity or frequency of physical exercise. Individuals with eating disorders, major depression or a medical history of drug addiction were excluded. Those with any metabolic disease, such as diabetes mellitus or hypothyroidism, or chronic diseases severely affecting the cardiovascular, gastrointestinal and renal systems were also excluded. Pregnant or lactating women were not allowed into the study. Women who met eligibility criteria and agreed to take part in the study were submitted to clinical, nutritional, biochemical and endothelial function evaluations. Anthropometric measurements, as well as blood collections, and endothelial function evaluation were performed from 08.00 to 10.00 hours after a 12 h fasting period.
The sample size of the present study was determined based on a previous study conducted by our group, in which subjects in the low-Ca group (LCG) compared with those in the high-Ca group (HCG) exhibited significantly higher levels of BMI after adjustments for confounders (30·81 (sem 0·93) v. 28·12 (sem 1·01) kg/m2; P= 0·03)(Reference Torres, Ferreira and Carvalho35). Assuming a type I error of 0·05 and a 20 % dropout rate, we needed seventy-two participants in the study.
Nutritional assessment
A semi-quantitative FFQ was used to assess the usual dietary intake of Ca, energy, proteins, carbohydrates and lipids over the previous 6 months. This FFQ, containing eighty items and usual portions, was developed for the Brazilian population based on commonly consumed foods and was validated against more accurate methods of dietary intake assessment(Reference Sichieri and Everhart36).
Height was measured using a stadiometer accurate to ± 0·5 cm, and weight was obtained with a calibrated scale accurate to ± 0·1 kg (Filizola S.A.), after participants, wearing light clothing and with no shoes, attempted to empty their bladder. BMI was calculated using the standard equation (kg/m2).
Waist circumference (WC) was measured in the standing position, midway between the lower margin of the last rib and the iliac crest, at mid-exhalation. Hip circumference was measured at the widest point of the hip/buttocks area with the measuring tape parallel to the floor. Waist:hip ratio was determined by dividing WC (cm) by hip circumference (cm). Waist:height ratio (WHEIR) was obtained by dividing WC (cm) by height (cm). Anthropometric measurements were taken twice and mean values were used in all analyses.
Percentage of body fat (%BF) was estimated by electrical bioimpedance using a Biodynamics BIA-450 body fat analyser (Biodynamics Corporation). Values of %BF and BMI were used to evaluate total adiposity (excessive adipose tissue, independent of site). To evaluate abdominal adiposity, WC, waist:hip ratio and WHEIR were used.
Laboratory parameters
Plasma samples were stored at − 80°C. Laboratory parameters included fasting circulating levels of creatinine, Ca, PTH, calcitriol, glucose, insulin, lipid profile, leptin, high-sensitivity C-reactive protein (hs-CRP), adiponectin, intracellular adhesion molecule 1 (ICAM-1), vascular cell adhesion molecule 1 (VCAM-1) and E-selectin. Participants were asked to collect 24 h urine and urinalysis was performed for Ca and creatinine.
Fasting plasma glucose was determined by using the glucose oxidase method. Fasting plasma insulin levels were determined by the RIA method using the commercially available human insulin specific kit (EMD Millipore Corporation). Insulin resistance status was assessed by using the homeostasis model assessment of insulin resistance (HOMA-IR) index, which was calculated as follows(Reference Mathews, Hosker and Treacher37):
 $$\begin{eqnarray} HOMA\hyphen IR = fasting\,insulin\,(\mu U/ml)\times fasting\,plasma\,glucose\,(mmol/l)/22\cdot 5. \end{eqnarray}$$
Total cholesterol, HDL-cholesterol and TAG concentrations were assessed by using an automated analyser (Du Pont Company). When TAG values were lower than 4000 mg/l, LDL-cholesterol was calculated using Friedewald's formula(Reference Friedewald, Levy and Frederickson38). Leptin was determined by RIA using a commercially available kit (Linco Research, Inc.).
Plasma PTH (intact molecule) and calcitriol were determined by ELISA using commercially available kits (Uscn Life Science, Inc.). In erythrocytes, [Ca2+]i were measured by atomic absorption spectrometry, using the modified method of Cheng et al. (Reference Cheng, Feinfeld and Briscoe39). Serum and urinary Ca was determined by colorimetry. Serum and urinary creatinine was assessed by the kinetic method.
To evaluate biomarkers of inflammatory state, circulating levels of adiponectin and hs-CRP were determined. The multiplex method was used to assess serum adiponectin (EMD Millipore Corporation) and turbidimetry was used to determine hs-CRP (Helica Biosystems, Inc.).
Circulating levels of cellular adhesion molecules (ICAM-1, VCAM-1 and E-selectin) were evaluated by the luminex xMAP method using a commercial kit (EMD Millipore Corporation), as biomarkers of endothelial function.
Blood pressure
Participants’ BP was recorded using a calibrated Dinamap 1846 Critikon automated sphygmomanometer (Critikon) after a resting period of at least 10 min in the sitting position. An appropriate arm cuff was used. Arm position was adjusted so that the cuff was at the level of the right atrium. On the non-dominant arm, BP was measured every 3 min for 15 min. The first value was discarded, and the mean of the last five readings was used in the analysis.
Endothelial function
Endothelial function was also evaluated by the peripheral arterial tonometry method, using Endo-PAT 2000®, a finger plethysmographic device (Itamar Medical Limited). This is a non-invasive method that offers the possibility of an easy and rapid assessment of vascular function in which data are analysed independently of the examiner(Reference Bonetti, Pumper and Higano40). Alterations in pulsatile arterial volume detected by peripheral arterial tonometry have been associated with flow-mediated dilatation measurement results(Reference Kuvin, Patel and Sliney41). The measurements were performed through fingertip probes placed on both index fingers and pulse wave amplitudes were detected and recorded. A 5 min measurement was taken at baseline. Sequentially, arterial flow was occluded using a cuff on the non-dominant arm which was inflated to 60 mmHg above systolic BP, but never above 200 mmHg. The cuff was rapidly deflated after 5 min of occlusion to allow reactive hyperaemia. The following 5 min were also recorded. The other arm served as a control and the difference between the two arms was used by Endo-PAT 2000® software to automatically calculate the reactive hyperaemia index.
Statistical methods
Participants were stratified into two groups according to their median usual dietary Ca intake in order to test the possible association of dietary Ca intake with adiposity, biochemical variables, [Ca2+]i, biomarkers of inflammatory state and endothelial function. The median daily Ca intake among evaluated women was 632·09 mg (interquartile interval: 474·82–807·15 mg) and a cut-off point of 600 mg/d was chosen to establish the two groups. Volunteers with a dietary Ca intake below 600 mg/d were allocated to the LCG and those with a Ca intake above or equal 600 mg/d were allocated to the HCG.
Means with their standard errors were used to summarise continuous variables. Normality was tested by using the Shapiro–Wilk normality test. Skewed data (age, body weight, BMI, WC, hip circumference, WHEIR, systolic BP, heart rate, glucose, TAG, hs-CRP, [Ca2+]i, reactive hyperaemia index, leptin, insulin, HOMA-IR, adiponectin, ICAM-1, E-selectin, PTH, dietary energy, proteins, carbohydrates, lipids, cholesterol and Ca) were log transformed to improve normality. Unpaired Student's t test was used to compare continuous variables between the two groups, and multiple linear regression was used to adjust for confounding factors. Comparisons among proportions were performed using the χ2 test.
Intracellular Ca was analysed as a continuous variable. Pearson's correlation was performed to determine the existence of a relationship between [Ca2+]i and variables of interest. Partial correlations controlled for different confounders were also used.
To evaluate associations between Ca intake and the presence of overweight, obesity, abdominal obesity, elevated BP, dyslipidaemia, hyperglycaemia and insulin resistance, multiple logistic regression was used. Participants were considered overweight if their BMI was ≥ 25 kg/m2 and obese if their BMI values were at least 30 kg/m2(42). Abdominal obesity was defined as a WC larger than 88 cm(43). Hyperglycaemia was defined when fasting glucose levels were at least 1000 mg/l(44) and insulin resistance when HOMA-IR was at least 4·65(45). Systolic BP and diastolic BP were considered above the recommended levels when they were >120 and >80 mmHg, respectively(Reference Chobanian, Bakris and Black46). The diagnosis of dyslipidaemia followed the Adult Treatment Panel III criteria(43): elevated cholesterol (total cholesterol ≥ 2000 mg/l); elevated LDL-cholesterol (LDL-cholesterol ≥ 1300 mg/l); low HDL-cholesterol (HDL-cholesterol < 600 mg/l); elevated TAG (TAG ≥ 1500 mg/l).
Daily energy intake lower than 2510 kJ (600 kcal) or higher than 14 650 kJ (3500 kcal) was considered biologically implausible(Reference Subar, Thompson and Kipnis47). Women whose FFQ-estimated energy intake in this range were excluded from the analysis.
STATA 10.0 (STATA Corporation) was used for statistical analysis. P< 0·05 was considered as statistically significant.
Results
A total of 268 women were interviewed, of which ninety-six met eligibility criteria and agreed to participate in the study. Of these ninety-six women, eighty completed all evaluations. Daily energy intake of four volunteers was considered biologically implausible and seventy-six women were included in the final statistical analysis. The average age of the participants was 31·40 (sem 1·01) years and their mean BMI was 26·20 (sem 0·65) kg/m2.
After stratifying the participants into two groups according to their usual dietary Ca intake (LCG and HCG), both groups were comparable in age, race, alcohol intake, serum creatinine, total serum Ca and ionised serum Ca. Serum levels of PTH and calcitriol were higher in the LCG than in the HCG; however, only calcitriol reached statistical significance (Table 1). The nutrient composition of food intake evaluated by the FFQ is presented in Table 2.
Table 1 Characteristics of the participants according to calcium intake (Mean values with their standard errors; number of subjects and percentages)

Table 2 Nutrient composition of food intake evaluated by the FFQ according to calcium intake (Mean values with their standard errors)

Women in the LCG compared with those in the HCG exhibited significantly higher body weight, BMI, WC, WHEIR and %BF, after adjustments for variables that could interfere with adiposity parameters (Table 3).
Table 3 Parameters of nutritional state according to calcium intake (Mean values with their standard errors)

* After adjustment for energy intake and age.
† After adjustment for age and intake of energy, alcohol, protein, carbohydrates and lipids.
Comparative analysis of the biochemical variables between the LCG and the HCG showed similar serum levels of glucose, total cholesterol, LDL-cholesterol, TAG, hs-CRP, ICAM-1 and E-selectin (Table 4). Subjects in the LCG compared with those in the HCG, after controlling for potential confounders, presented significantly higher levels of insulin, HOMA-IR and leptin; and significantly lower levels of HDL-cholesterol, adiponectin and VCAM-1. Average values of diastolic and mean BP were significantly greater in the LCG than in the HCG, after adjusting for confounders (Table 4).
Table 4 Biochemical variables, reactive hyperaemia index and blood pressure levels according to calcium intake (Mean values with their standard errors)
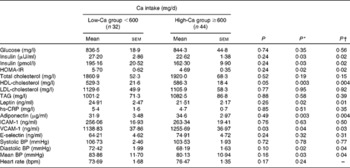
HOMA-IR, homeostasis model assessment of insulin resistance; hs-CRP, high-sensitivity C-reactive protein; ICAM-1, intracellular adhesion molecule 1; VCAM-1, vascular adhesion molecule 1; BP, blood pressure; bpm, beats/min.
* After adjustment for energy intake and age.
† After adjustment for age and intake of energy, alcohol, protein, carbohydrates and lipids.
Even after controlling for confounding factors, participants in the LCG and HCG presented similar levels of reactive hyperaemia index (2·16 (sem 0·14) v. 1·95 (sem 0·08), respectively, P= 0·23) and [Ca2+]i (9·12 (sem 1·03) v. 9·47 (sem 1·01) mEq/l per Cell, respectively, P= 0·82).
There was no significant relationship (even after adjustments for confounders) between [Ca2+]i, modelled as a continuous variable, and (1) dietary Ca, (2) nutritional status, (3) biochemical variables, (4) reactive hyperaemia index and (5) BP levels (TS Ferreira, MRSG Torres and AF Sanjuliani, unpublished results).
After controlling for potential confounders, subjects in the HCG had a lower OR for prevalent overweight, obesity, abdominal obesity, insulin resistance, low HDL-cholesterol and systolic BP above the recommended levels (Table 5).
Table 5 Odds of the occurrence of overweight, obesity, abdominal obesity, hyperglycaemia, insulin resistance, dyslipidaemia and blood pressure above the recommended levels according to calcium intake (Odds ratios and 95 % confidence intervals)

* Adjusted for energy intake and age.
† Adjusted for age and intake of energy, alcohol, protein, carbohydrates and lipids.
Discussion
In the present study, after adjustments for potential confounders, women in the LCG, in comparison with those in the HCG, showed (1) higher body weight, BMI, WC, WHEIR, %BF, serum insulin, HOMA-IR, leptin, diastolic BP and mean BP, and (2) lower HDL-cholesterol, adiponectin and VCAM-1. No difference was found between the two groups in relation to [Ca2+]i and endothelial function assessed by peripheral arterial tonometry. Participants in the HCG compared with those in the LCG presented lower OR for overweight, obesity, abdominal obesity evaluated assessed by WC, systolic BP above the recommended limits, HDL-cholesterol below 600 mg/l and insulin resistance, after controlling for confounding factors.
The mean Ca intake of all women evaluated in the present study was 666·28 (sem 295·90) mg/d, which is higher than Brazilian women's mean intake (476·40 mg/d)(2), but is below the amount of Ca recommended for this age group (1000 mg/d)(22).
The inverse relationship between Ca intake and total and/or abdominal adiposity found in the present study as also been observed in several observational studies conducted in different geographic regions around the world and published in the last decade(Reference Barr, Fulgoni and Pereira10, Reference Loss, Rankinen and Leon11, Reference Richart, Thijs and Nawrot28, Reference Azadbakht, Mirmiran and Esmaillzadeh48–Reference Shahar, Schwarzfuchs and Fraser50). This association between Ca intake and adiposity as also been observed in specific groups such as hypertensive adults(Reference Torres, Ferreira and Carvalho35), renal transplant patients(Reference Torres, Gioseffi and Guimarães51) and diabetic individuals(Reference Shahar, Abel and Elhayany52).
On the other hand, some epidemiological studies did not find this association between Ca intake and adiposity(Reference Murakami, Okubo and Sasaki53, Reference Boon, Kopes and Saris54). In the study of Murakami et al. (Reference Murakami, Okubo and Sasaki53), involving young (18–20 years) Japanese lean women with a relatively low intake of Ca (268 ± 93 mg/4184 kJ/d (1000 kcal/d)) and dairy products, the lack of association may be due to the existence of a threshold for Ca intake and/or BMI needed to observe this relationship.
Boon et al. (Reference Boon, Kopes and Saris54) found a weak inverse relationship of Ca intake and body composition in healthy subjects whose habitual daily Ca intake was 1027 (sem 82) mg. As the authors have stated, this finding may be due to the high average Ca intake that is much higher than that observed in other epidemiological studies. These authors have suggested that there is a threshold for Ca intake above which no additive beneficial effect exists and suggested that in their study, the threshold was about 800 mg/d. Other authors have suggested that this threshold may vary between 500 and 700 mg/d(Reference Dougkas, Reynolds and Givens7).
One of the proposed mechanisms of action of dietary Ca on adiposity is through the increase in [Ca2+]i in adipocytes. It was observed an elevated [Ca2+]i in obese human adipocytes and a potent anti-lipolytic effect of agouti protein in human adipocytes via a Ca-dependent mechanism. An experimental trial demonstrated that low Ca intake raises [Ca2+]i, and sequentially high Ca intake associated with energy restriction reduces [Ca2+]i in adipocytes, suppressing lipogenesis and stimulating lipolysis in rats(Reference Zemel6).
Therefore, we decided to evaluate [Ca2+]i in erythrocytes, because: (1) these cells are more easily obtained; (2) the [Ca2+]i of these cells may reflect adipocytes’ Ca concentration; (3) other studies have already investigated the relationship of erythrocyte [Ca2+]i and dietary Ca or hypertension(Reference Hilpert, West and Bagshaw55, Reference Kosch, Hausberg and Westermann56). A high intake of dairy products was able to reduce [Ca2+]i in erythrocytes and BP in hypertensive subjects when compared with a diet rich in fruits and vegetables and with a classical occidental diet(Reference Hilpert, West and Bagshaw55). Alterations in [Ca2+]i and changes in the kinetics of Ca transport were also identified in platelets, adipocytes and lymphocytes(Reference Barbagallo, Dominguez and Licata57, Reference Byyny, Lo Verde and Lloyd58).
In this sample of healthy women, erythrocyte [Ca2+]i was not associated with dietary Ca and with adiposity. This result did not exclude the possible link between dietary Ca and adiposity via modulation of [Ca2+]i, because we did not evaluate [Ca2+]i in adipocytes. However, this result suggests that other mechanisms may be important. These proposed mechanisms include: (1) Ca can increase faecal fat excretion through the formation of insoluble complexes; (2) Ca intake could interfere in the regulation of appetite; (3) calcitriol stimulates the expression of 11β-hydroxysteroid dehydrogenase-1 and cortisol production by human adipocytes, favouring abdominal obesity; (4) calcitriol can also acts via the classical nuclear vitamin D receptors in adipocytes to inhibit the expression of uncoupling protein-2 and thus increase energy efficiency(Reference Zemel6, Reference Dougkas, Reynolds and Givens7, Reference Astrup, Kristensen and Gregersen23).
The lower BP observed in the HCG in comparison with the LCG in this sample of women is in accordance with a variety of epidemiological studies and clinical trials evaluating the relationship between dietary Ca and BP(Reference Wang, Manson and Buring24–Reference vanMierlo, Arends and Streppel26). The protective effect of Ca on BP can be partly explained by the influence of calcitriol on [Ca2+]i. An increase of [Ca2+]i in vascular smooth muscle cells can result in vasoconstriction and a consequent rise in BP(Reference Zemel59). Other bioactive components present in dairy products could also influence BP, such as peptides that inhibit the angiotensin-converting enzyme(Reference Zemel6, Reference Zemel, Sun and Sobhani31).
In the present study, HDL-cholesterol was higher in the HCG compared with the LCG. A direct relationship between dietary Ca and HDL-cholesterol as been observed in some studies(Reference Jacqmain, Doucet and Després9, Reference Liu, Song and Ford60, Reference Reid, Mason and Horne61). The exact mechanism of Ca and/or dairy products on HDL-cholesterol is not known. We can also speculate that as in the HCG, the intake of milk (either whole or skimmed) was greater than in the LCG, this should have increased the intake of MUFA (which can increase HDL-cholesterol levels). Approximately 25 % of milk fat is made up of the MUFA oleic acid, making oleic acid the second most abundant fatty acid in milk(Reference Rice, Cifelli and Pikosky62).
As leptin is synthesised by adipocytes in response to changes in body fat(Reference Ronti, Lupattelli and Mannarino63), the inverse relationship between dietary Ca and leptin observed in the present study can be explained by the higher body adiposity observed in the LCG in comparison with the HCG.
The present findings related to glucose metabolism are in agreement with other studies that investigated the associations between Ca and insulin resistance(Reference Tremblay and Gilbert27, Reference Richart, Thijs and Nawrot28). In a sample of Belgian adults, fasting blood glucose decreased across quartiles of habitual Ca intake(Reference Richart, Thijs and Nawrot28). A literature review concluded that a large amount of evidence suggests that there is an inverse relationship between dietary Ca and/or dairy product intake and insulin resistance and type 2 diabetes(Reference Tremblay and Gilbert27).
Since adiponectin is an anti-inflammatory cytokine with anti-atherogenic properties that improves insulin sensitivity(Reference Ronti, Lupattelli and Mannarino63), the higher levels of adiponectin observed in the HCG may suggest a lower risk of atherogenesis, insulin resistance and CVD in this group of women. Beneficial effects of dairy product intake on adiponectin have been already been reported by Stancliffe et al. (Reference Stancliffe, Thorpe and Zemel34).
Obesity is associated with a higher risk of CVD, which can be in part attributed to vascular endothelial dysfunction(Reference Hadi, Carr and Suwaidi64). So, it was expected to lower endothelial dysfunction in the HCG when compared with the LCG. However, this was not observed in the present study. On the other hand, the LCG presented lower values of VCAM-1 in comparison with the HCG. Further studies are necessary in order to clarify the relationship between dietary Ca and endothelial function.
In the present study, the association of dietary Ca with the metabolic profile (serum insulin, HOMA-IR, leptin and adiponectin) and BP may be secondary to the lower body adiposity found in participants with higher Ca intake, because after additional adjustment for BMI, these associations were no longer significant (data not shown). However, the association of HDL-cholesterol with dietary Ca remained significant even after controlling for BMI.
There are some limitations in the present study. One of them is that [Ca2+]i analysis was conducted in erythrocytes and not in adipocytes. Another limitation is that the mean Ca intake of all women was low, which could constitute a limiting factor for the observation of other associations between dietary Ca and metabolic variables. Measurements of total and abdominal adiposity used in the present study were indirect estimates. The present study is associational in nature and thus cannot provide evidence of cause and effect.
Conclusion
The findings of the present study suggest that, in a sample of healthy women, Ca intake could be inversely associated with the development of some cardiovascular risk factors such as excessive total and abdominal adiposity, insulin resistance and elevated BP; and directly associated with serum levels of adiponectin and HDL-cholesterol. However, dietary Ca may not be related to erythrocyte intracellular Ca and endothelial function.
Acknowledgements
The present study was supported by Fundação Carlos Chagas Filho de Amparo à Pesquisa and do Estado do Rio de Janeiro (FAPERJ). The role of each author in the study is as follows: T. d. S. F. contributed to the study conception and design, data collection, assembly, analysis and interpretation, manuscript drafting and the approval of the final version of the manuscript; M. R. S. G. T. contributed to the study conception and design, data analysis and interpretation, manuscript drafting and the approval of the final version of the manuscript; A. F. S. contributed to the study conception and design, data interpretation, manuscript revision and the approval of the final version of the manuscript. The authors declare no conflicts of interest.


