


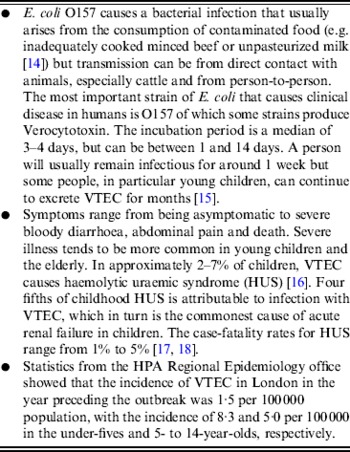
INTRODUCTION
Health and healthcare are inextricably social events. How individuals interact can modify their risk of acquiring illness, have profound effects on their own illnesses, and influence the illnesses of others. Social network analysis has developed as a discipline to examine these relationships and the ways in which the intricate interconnections that comprise our various social networks can affect a variety of outcomes.
The dynamics of social networks – such as which persons (or groups) in a network constitute its major nodes (hubs) and the ‘connectedness’ of its members–can be used to predict the spread of a disease within an interconnected population [Reference Christakis and Fowler1]. This information can also be used to predict epidemiological trends. Social networks have been most widely used in social science [Reference House, Landis and Umberson2], to track non-communicable illnesses such as depression [Reference Smith and Christakis3] and suicidal tendency [Reference Bearman and Moody4], and risk factors for disease such as obesity [Reference Christakis and Fowler5, Reference Hill6]. However, their use is becoming common in tracking infectious diseases, which lend themselves to the examination of social networks. During an outbreak, a contagion that stochastically infects some individuals and then spreads from person-to-person in the social network will tend to reach individuals at the centre of the network more quickly than random members of the population because central individuals are a smaller number of steps (or degrees of separation) away from the average individual in the network [Reference Christakis and Fowler1]. The duration of exposure between people with social ties is also typically much higher than between strangers.
In public health terms, social network analysis is particularly useful when trying to ascertain, which individual is most likely to become infected and which individual is most likely to infect others [Reference Bell, Atkinson and Carlson7]. It may even be useful in identifying diseases that are spread by an alternative media or a vector, by highlighting geographical locations and by helping to rule out alternative causes.
In this paper we show the use of social network mapping in the management of an outbreak of E. coli O157 (VTEC), and demonstrate its utility for outbreak investigation within a resource-constrained public health service.
The incident
In early 2010, the Health Protection Agency (HPA) North West London Health Protection Unit (HPU) was notified of a possible case of Verocytotoxin-producing E. coli in a 5-year-old child (see Table 1 for a description of the features of VTEC). When a second epidemiologically linked case was subsequently identified, the HPU established a multi-disciplinary outbreak control team. Early on in the management of the outbreak the decision was made to screen all schoolchildren, staff and families of cases. The social network diagrams were created in addition to this in an attempt to assess whether they could be of additional benefit. The outbreak was managed by the immediate closure of the school, screening of pupils, staff and family contacts and deep cleaning of the school.
Table 1. Characteristics of E. coli O157 VTEC
The total number of pupils in the school was 356 children. The school was made up of four year groups (Nursery, Reception, Year 1, Year 2), each split into three classes of approximately 30 pupils. Including teachers, assistants and other support staff, there was total of 61 staff. The Nursery class was taught in a separate building that shared a play area with Reception. The other three year groups were all taught in the same building but in separate areas.
Adjacent to the infant and primary school, on a separate site, was a junior school that contained many siblings. There was also an out-of-hours centre nearby which was attended by a number of children from the primary school.
METHODS
Early in the course of the outbreak, the decision was made to map the affected children to identify possible routes of transmission. Social network diagrams were produced to illustrate this using PowerPoint 2007 (Microsoft Corporation, USA). An initial template was developed and amended dynamically as cases evolved. Diagrams depicted the cases (possible, probable, confirmed; see Table 2) in their predominant locations within the school. Each individual case was shown as a node in the network, connected to other nodes via a line depicting the status of their relationship, i.e. relative or close friend. No directionality was shown in the diagram. To anonymize the diagrams the initials of the individual was used rather than their full name. The code to identify the individuals was kept securely with the lead organization in the outbreak control team. All information was gained through speaking to the families of the children to establish their family and friend contacts, especially in relation to particular events. A close friend was defined as being more than just a classroom contact, for example the children would play together in the playground or at each other's house. The degree of friendship was determined by the parent.
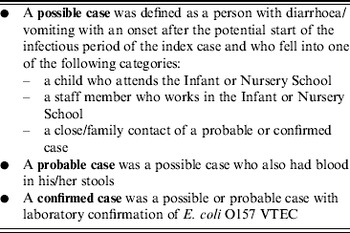
Table 2. The case definitions used in the outbreak
Information on the status of samples was reported daily or twice daily by the environmental health team and microbiology department. As new information became available, the diagrams were updated with cases added or removed. A new diagram was produced in time for the daily outbreak control team meetings. They were shared via a secure email transfer with the other members of the outbreak control team to depict and explain social networks as social ties and relationships were ascertained. We used the diagrams to identify early individuals linked to cases identified and thus focus on those individuals as a priority in our screening of contacts. As the outbreak progressed the diagrams became increasingly complex and required the addition of new locations. In addition to the daily diagrams that were produced, bespoke diagrams were created to show networks pertaining to particular situations, e.g. a birthday party attended by the index case. These were kept separate in order to keep the main diagrams as clear as possible.
In addition to the social network analysis, all pupils and staff were asked to provide stool samples and complete a standardized self-completion questionnaire. Further in-depth questioning of early cases with semi-structured interviews was performed to identify any common exposures. This information was used to conduct a cohort study of pupils and staff. Environmental testing was also done in the school and food supplier.
RESULTS
The outbreak was successfully controlled through the measures applied. The school remained closed for 2½ weeks with pupils and staff allowed to return after submitting two negative stool samples. All school pupils and staff were screened. This included the 356 schoolchildren and 61 staff members. In addition 64 contacts of cases were screened. Fifty-nine possible cases that had gastrointestinal symptoms were identified and investigated. Thirteen cases of VTEC were identified in six separate families. Two of these cases developed haemolytic uraemic syndrome and required hospitalization; one of them required intensive care. Figure 1 shows the epidemic curve for the outbreak. Their dates of onset were separated by 20 days. The outbreak centred around the Reception class of the school, from which four cases aged 5 and 6 years were identified early in the outbreak. The attack rate was 2·0% (7/356) in the school as a whole, but 13·3% (4/30) in one Reception class. Family contacts were infected later. The cohort study found no indication of a common food source and the epidemic curve was consistent with person-to-person transmission. All 21 environmental samples were negative for VTEC.
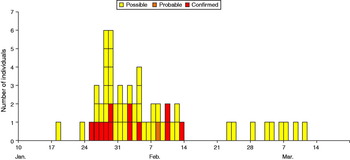
Fig. 1 [colour online]. Epidemic curve showing confirmed, probable and possible cases of E. coli O157 VTEC at a primary school in London by date of onset of symptoms. The graph does not illustrate asymptomatic carriage
In total 22 diagrams were created showing chronologically the spread of the disease. The diagrams are best interpreted in the light of the preceding ones showing the change from day to day. Figure 2(a–c) shows a selection of the social network diagrams created including a key explaining the diagrams.
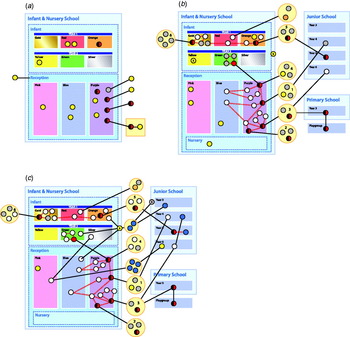
Fig. 2. A selection of social network diagrams.
The diagrams shown here are replicas of the ones created during outbreak. They had been anonymized, the place names and dates removed and re-created using Adobe Indesign (Adobe Systems Inc., USA). In the case of this outbreak, we started off assuming the index case was central, but by looking at the diagrams it became apparent that this individual was more peripheral in the network and thus of less importance. After the initial cases were identified, no further cases were linked to this individual. Using the social network diagrams we assumed that an individual from family 3 is the central node within the network as individuals from this family had the most edges. In contrast to the index case, this family was more important as further cases were linked to them. Identifying the central node helped to focus the attention of the outbreak control team, which was particularly important in the early stages when there were many leads to be investigated with limited resources. This involved additional in-depth interviews and frequent phone calls to check on the status of each member of the family and additional testing of those thought to be at increased risk. The social network diagrams also helped to identify the close association of two families with cases, one being family 3. This helped us to broadly stratify the risk of each family and led us to consider other potential sources of infection, which on investigation turned out to be negative. Another example of the use of social network diagrams in this outbreak was the creation of a network for children who attended the party along with the index case. Friends of the index case at the party were then screened. None tested positive, so in this instance no further testing was done.
From the social network diagrams, routes of transmission were hypothesized. Figure 3(a, b) shows examples of these. It is not possible to determine the direction of transmission from the available information, but it can be assumed from the timeline of the infection. This was, however, uncertain due to the variation in the length of the incubation period and the possibility of re-infection.
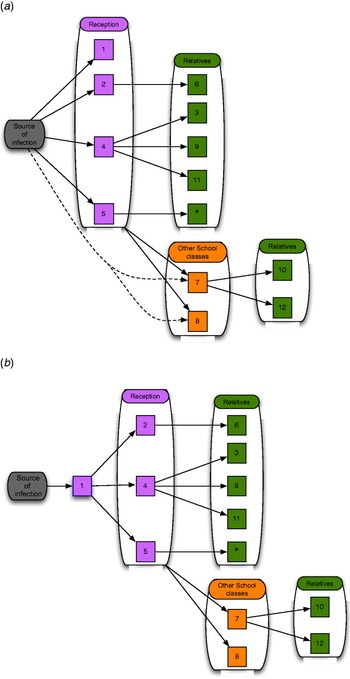
Fig. 3 [colour online]. (a) In this scenario, a source infects the four children in the Reception class. These four children pass on the infection to their family members. The two children in Year 1 acquire the infection either from a Reception class child or from the original source. (b) In this scenario the index case passes on the infection to the other cases in the Reception class, who then pass it on to the other cases as before. Cases 2, 4 or 5 could have been the primary case rather than case 1. Cases 7 and 8 are less likely in this scenario to have acquired the infection directly from the source because of the longer time period until they became unwell.
DISCUSSION
The use of social network diagrams with basic tools and analysis demonstrated how the management of a serious infectious disease outbreak can be supported. The social network mapping visually illustrated links to explain secondary transmission, helped to target control measures and mapped the spread of the infection over time. By highlighting links both inside and outside of the schools the maps informed the attention and allocation of resources for outbreak management.
The social network diagrams were used alongside the screening and risk-factor questionnaire analysis of all school pupils and staff. The precise impact of using social network diagrams to analyse and manage this outbreak is therefore not known. Nevertheless, we trialled their use in a real-life outbreak setting to improve our understanding of their benefits in relation to the other tools used. It is likely that the early closure of the school was the most important measure in controlling the outbreak. Nevertheless, an untargeted mass-screening approach was very time consuming and resource intensive, and using a more focused approach orientated around the identification of social networks and the more central cases including their potential routes of transmission would have enabled us to rationalize resources (in particular outbreak control member's time). Screening of individuals at a party may have helped but no cases emerged from this setting so this line of investigation proceeded no further. Even in the presence of mass screening, the interpretation of social networking charts increased our confidence about routes of transmission and the absence of a point source.
In this outbreak we would have identified all the cases if we had relied entirely on testing of symptomatic individuals and creating social network diagrams to identify others and if mass screening were not done. In this scenario, although the more extensive research into networks and friendships may have generated the need for more stool samples, these would have been much less and more targeted than in the mass-screening scenario. Conversely, mass screening gave us greater confidence that there were no more (asymptomatic) E. coli O157 carriers in the school. A potential problem could have been in identifying cases in Year 1. In reality these children presented with symptoms and would therefore have been tested but if this were not an institutional setting where symptoms could be monitored, they may have been missed.
Social network analysis has been used in the management of infectious diseases and has been advocated as an important component in the control and management of syphilis and sexually transmitted diseases, in support of traditional or standard contact tracing [Reference Ogilvie8]. In addition, its use has been prominent in researching the spread of infections, especially HIV [Reference Bell, Atkinson and Carlson7, Reference Klovdahl9], and interactions between social factors and the risk of disease, such as between social diversity of contacts and stress levels in upper respiratory tract infections [Reference Hamrick, Cohen and Rodriguez10]. A good example of the use of social networks is by Gardy et al., who used whole-genome sequencing and social network analyses to trace transmission events and find socioeconomic factors behind a British Columbia tuberculosis outbreak. This led to identification of previously unreported interactions and shared locations and a rise in crack cocaine use that may have helped spark the outbreak [Reference Gardy11].
Social networks can be egocentric, where the contacts emerge from an individual, and only the individuals of interest are shown; and sociocentric networks, which attempt to connect all the members of a group or society [Reference Smith and Christakis3]. In the management of a changing infectious disease outbreak the social network maps, such as the one we produced, are likely to be egocentric. While we appreciate the advantages of sociocentric networks, time and resources usually preclude the construction of this type of network. They tend to be the remit of post-hoc analysis or research.
Simple social network maps are created informally by health protection professionals when dealing with an infectious disease. However, standard contact tracing is often limited to connections between two individuals producing a linear map(s). Going from one individual to the next misses the opportunity to see that two individuals who are distally related on a linear map may be closely related through another individual in a network. The extent to which multiple individuals interact with each other is often not illustrated and the position of a person within a network may be unknown, making it difficult to stratify someone's risk according to their position. Rothenberg et al. described this concept as ‘risk-space’: a categorization of the time, place and social connection of a person [Reference Rothenberg12]. In terms of outbreak management this risk stratification can then help in targeting those at greatest risk. In this outbreak, risk stratification was done in a qualitative way with the social network diagrams forming part of the decision-making process. We accept that this could have been more systematic, possibly applying a risk-profile score or matrix where pre-defined rules, such as the number of edges an individual has, leads to a control measure. The stratification of risk gives a probability of infection. The consequences of the disease need to be taken into account when considering this probability. As stated previously, mass screening gave us confidence that all cases were found and it may not be possible to rely solely on social network diagrams with E. coli O157 as we cannot be sure of this.
In general the more social contacts an individual has, the greater the risk of contracting an infectious disease and transmitting it, so determining the centrality of an individual is essential. According to Bell et al. in their work on HIV transmission, in short timescales degree centrality (i.e. the person with the most linkages) is most important and can predict who is most likely to become infected and to infect others [Reference Bell, Atkinson and Carlson7]. Similarly, in simulated outbreaks Christley et al. recommend that the identification of more central individuals can help to ‘inform surveillance and infection control strategies’ [Reference Christley13]. In a disease where person-to-person transmission is common, the central individual is therefore more important than the index case. If on the contrary, the primary source of infection is the most important finding, then identifying the index case is paramount. Social networks can thus help to differentiate at an early stage between outbreaks which rely on person-to-person transmission to propagate or ones which rely on a point source. This was of particular importance as the mode of transmission for E. coli O157 could be either. In this outbreak, the index case was of less importance than the central case. It is possible that the infection passed from this individual to the others at the start of the outbreak, but no further cases were linked to this person during the course of the outbreak. On a daily basis, moving from one diagram to the next showed the outbreak control team how the infection was passing from person-to-person. Importantly it also showed who was not infected and who we should spend more resources to care for.
Explicit creation of a social network map in its simplest sense, clarifies the associations visually. This can be useful for those who work best with visual diagrams and can be a useful tool for communication between colleagues. As an extension of this, social network maps could be used to devise a screening schedule. The shape of the diagram can help to determine whether a targeted approach focusing on a few individuals or a more global approach is better suited. Examples of this are shown in Figure 4(a, b). Social network diagrams would be more useful outside of an institutional setting where individuals at risk are not as easy to identify. While there are limitations to such an approach and a risk that the social network may not be complete, the communication of someone's position in a network may help to improve compliance if it helps to illustrate the reason for screening. While problematic, due to issues of confidentiality, showing the diagrams to those at risk could prove useful. While contemporaneous detection of infectious outbreaks is ideal, more typically our detection lags behind the actual epidemic [Reference Christakis and Fowler1]. If the careful collection of information from a sample of central individuals within social networks could be used to detect contagious outbreaks before they happen in the general population, this information could also support the prevention of outbreaks. Key people and places and certain behaviours that might be contributing to an outbreak's spread could become more apparent and allow for adjustments of the outbreak investigation and response in real time as this new information becomes available.
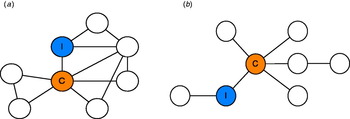
Fig. 4 [colour online]. (a) In this figure both the index case and central case (i.e. the one with the greatest number of links) are important, but the whole group is highly interconnected meaning a control strategy targeted at the entire network is ideal. (b) In this diagram the central figure is the key to disease transmission, so control efforts should be skewed towards this individual.
One of the limitations for the practical use of social networks in outbreak management is the time-consuming nature of the work. De novo creation of a network is complicated especially as this occurs at a time when resources are stretched during an outbreak. Moreover, deciding the degree of connection between individuals who warrant inclusion in the network can be difficult. Disease and situation specific rules need to be applied. In a frontline setting, use of social network mapping to support an outbreak investigation may have to be limited to certain diseases, e.g. where morbidity and mortality are high and, for practical reasons, to avoid large numbers of cases where the infectivity is low. We feel that an outbreak of E. coli O157 is a good example of such an outbreak but acknowledge that where the consequences of illness are serious, the tendency is to perform additional screening.
The creation of templates (or software programs) for particular common outbreak scenarios such as diarrhoea in a hospital or nursing home could help facilitate the use of social network mapping in outbreak investigations. A novel approach could be to use already created networks within social networking internet websites. This may be appropriate for a high-school population for example.
Other limitations come from gaps in the network from the inability to ascertain all contacts. This is of particular importance in a disease such as VTEC where asymptomatic excretors exist. Further to this, as in any contact tracing, a case may forget or withhold information, leading to missing branches in the network.
In conclusion, for selected infectious diseases social network diagrams can provide a valuable tool in the management of an outbreak. We believe that resources should be directed to supporting the use of these networks in a routine and time-efficient manner for use in frontline public health practice.
ACKNOWLEDGEMENTS
The authors thank all members of the North West London Health Protection Unit, and in particular those who were part of the outbreak control team: M. Gribbin, W. Liu, Dr M. Naroee, Dr C. Seng, S. Toussaint. The work was routinely conducted in the local Health Protection Unit of the Health Protection Agency, and hence there was no further financial support during the intervention. However, the manuscript was written while D. Devakumar was conducting a Research Training Fellowship, funded by the Wellcome Trust (grant no. 092121/Z/10/Z).
DECLARATION OF INTEREST
None.


 Open access