Grocery shopping is a behaviour that is highly habitualized and driven primarily by taste motives (rather than health motives( Reference Grunert, Fernández-Celemín and Wills 1 )). Providing nutrition information on the packaging is considered one strategy to increase the proportion of healthful food products in consumers’ shopping baskets. However, previous field studies indicate that consumers are often reluctant to change their shopping behaviour in response to variations in nutrition labelling (such as the introduction of the Nutrition Facts Panel( Reference Balasubramanian and Cole 2 )). There may be two reasons for this: (i) low salience of nutrition labelling, particularly when implemented on the back of the packaging; and (ii) high focus on informational cues as opposed to directive cues as part of the labelling. These limitations affect consumer decision-making processes, where attention is the key bottleneck for healthful in-store food choices( Reference Van Herpen and van Trijp 3 ).
The goal of the present study was to assess the effectiveness of front-of-pack nutrition labelling stimuli in increasing both consumer attention and the healthfulness of food choices. More specifically, the study considered directive cues as part of the nutrition labelling. Directiveness describes the degree to which nutrition labelling provides guidance about a food's healthfulness( Reference Hodgkins, Barnett and Wąsowicz-Kiryło 4 ).
The two most prominent directive cues are health marks and traffic light colouring. Health marks provide an overall healthfulness evaluation of a product without mentioning further details such as nutrient composition. They deliver a binary distinction between more and less healthful products and thus allow heuristic processing. Health marks are presented in a symbolic way that allows consumers to immediately classify healthful food, such as a healthy choice tick( Reference Hodgkins, Barnett and Wąsowicz-Kiryło 4 ). Traffic light colours provide nutrient-specific guidance by the colours green (i.e. go), amber and red (i.e. stop) – colours that have been implicitly learned in traffic contexts. Traffic light colours signify low (green), medium (amber) and high (red) levels of negative-attribute nutrients, such as fat or salt content( 5 ).
There are reasons to assume that traffic light colours do not function independently from health marks. The presence of health marks on food packages should reduce the duration that consumers attend to the packaging because the format is easy to recognize and provides a cognitive short cut by signalling the ‘right’ choice( Reference Van Herpen and van Trijp 3 , Reference Bialkova and van Trijp 6 ). However, we predict that the reduced attention shift caused by health marks is contingent on the presence (v. absence) of traffic light colours. Adding colour-coding attracts consumer attention to nutrient-specific evaluations( Reference Jones and Richardson 7 ). This is expected to inhibit consumers’ propensity to use cognitive short cuts based on binary overall healthfulness classifications. Thus, in the presence of traffic light colour-coding, visual attention to the product may be unaffected by the additional presence (v. absence) of health marks. H1 is stated as follows;
H1: If front-of-package nutrition labelling includes an overall evaluation of a food product's healthfulness (i.e. a health mark), visual attention will decrease compared with nutrition labelling without health marks. This decrease in attention will not occur if traffic light colour-coding provides a nutrient-specific evaluation of a product's healthfulness.
We have argued that the combined use of health marks and traffic light colour-coding keeps attention levels high. But does this combination help consumers make healthful food choices? We propose that the combination of the two heuristic cues makes consumers select more healthful products, because health marks guide consumers to a healthful evoked set of food products and the colours green and red automatically activate the associated meanings (‘go’ for green, ‘no-go’ for red) when assigned to more or less healthful nutrients of a food, thereby implying automatic approach-avoidance reactions( Reference Koenigstorfer, Groeppel-Klein and Kamm 8 , Reference Genschow, Reutner and Wänke 9 ). The colouring (red, in particular) facilitates consumers’ nutrient-level evaluation that a product is (less) healthful. Since the presence of objects (here: health marks) is easier to recognize and classify than the absence of objects( Reference Bialkova and van Trijp 6 ), traffic light colours should have stronger effects in the presence of health marks. We therefore predict the following;
H2: If front-of-package nutrition labelling provides an overall evaluation of a food product's healthfulness (i.e. a health mark) and nutrient-specific traffic light colour-coding, consumers will make more healthful food choices compared with traffic light colour-coded nutrition information without health marks.
Method
Participants
One hundred and sixty participants (103 women; mean age 37·8 (sd 11·7) years; between 19 and 64 years) took part in the study in exchange for a monetary reward of EUR 10 in cash. All participants were mainly responsible for grocery shopping in their household (mean size 2·8 (sd 1·0) members; between one and six members). None of the participants had any colour-vision deficiencies. The study was conducted according to the guidelines laid down in the Declaration of Helsinki. Written informed consent was obtained from all participants. A full debriefing took place at the end of the study.
Design
Participants were randomly assigned to one of the four experimental conditions of a 2 (health marks present v. health marks absent) × 2 (traffic light colour-coding present v. traffic light colour-coding absent) between-participant design.
Materials
The nutrition labels (7·5 cm × 2·5 cm) were implemented on the front of the real packaging of fifteen snack foods ranging from foods considered to be more healthful (e.g. rice cakes) to foods considered to be less healthful (e.g. chocolate, fried banana chips) at a consistent position via computer artwork. The nutrition label information showed energy (calories), fat, saturated fats, sugar and salt content of the food and, for ease of comparison, referred to one identical reference weight of the foods (i.e. 100 g; the most frequently used reference in Europe( Reference Garsetti, de Vries and Smith 10 )). In the health mark condition, the cut-off values provided by the Choices International Foundation( 11 ) were used to determine whether a food was labelled with a health mark (stating ‘healthy choice’ in association with a check mark) or not (in this case, the area where the health mark would appear was blank). Four of the fifteen foods were given a health mark. In the traffic light colouring condition, traffic light colours were used to signal that a food contained low, medium or high amounts of the four nutrients. The cut-off values provided by the British Food Standards Agency determined whether the content of nutrient was labelled green, amber or red( 5 ). The Appendix shows the energy and nutrient content, as well as the distribution of health marks and traffic light colours as part of the front-of-package nutrition information within the assortment of snack foods. Fig. 1 displays examples of the four manipulations of the nutrition information.
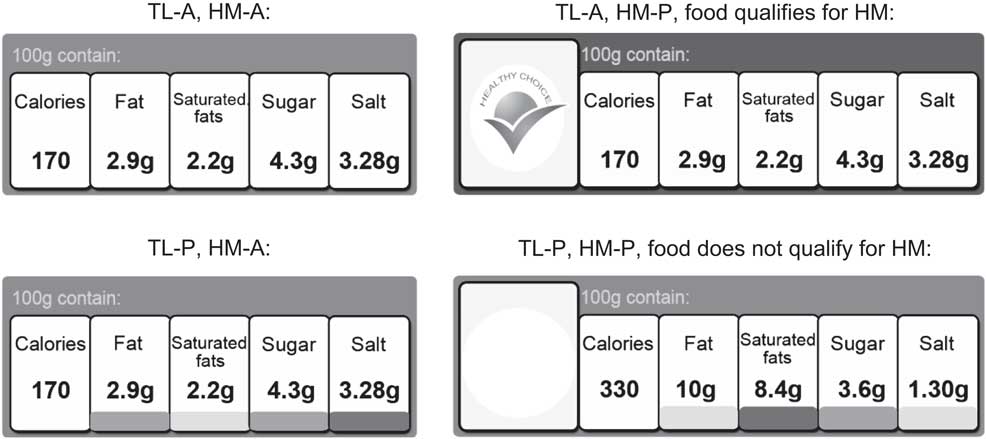
Fig. 1 Examples of the front-of-package nutrition information stimuli (according to the experimental manipulations): TL-A = traffic light colour-coding absent; TL-P = traffic light colour-coding present; HM-A = health mark absent; HM-P = health mark present. Fictitious values are provided in Fig. 1; in the study, the value corresponded to the actual nutrient content of the foods
The snacks were presented to consumers in a random order at eye level on two supermarket shelves (upper shelf: six products, lower shelf: nine products). The prices of the foods did not appear on the shelf to exclude unwanted price effects. The foods had about the same price.
Procedure
A laboratory store with four shelves was set up for the purpose of the study. Participants were informed that the study was about their orientation behaviour when they shop for groceries. None of the participants was aware of the real purpose of the study, in order to avoid priming and socially desirable responses. Participants received a shopping list containing three products (one ready meal, one package of sweets and one fruit juice). They were asked to select one product of their choice each from the first three shelves. A shopping basket was given to the participants and they were told that they should behave as they would normally do. This simulation of a buying episode was performed to bring participants into shopping mode. An interviewer welcomed them at the end of the third shelf (each of the shelves featured products from one food category). Participants were told that the study was over and the shopping basket was taken away from them.
However, they were informed that, before they would be released, they could choose one snack to take home as a thank you for their participation. Participants were told to go to a neighbouring shelf to make a selection of whatever snack they wanted to have. They were left alone before they turned into the area of the shelf so that their gaze and choice behaviours were unaffected by the presence of the interviewer. After participants had made their choice, they went back to the area where the study had started.
During a funnelled debriefing, they were asked whether they had noticed anything unusual with the products that they had seen. None of the participants realized that the product packages or the nutrition information had been manipulated. Also, the participants rated how relevant health and taste motives were to them when they made their choice of snack food, as well as the appeal of, and familiarity with, the nutrition information schemes (while a picture of the scheme was presented to them). Lastly, participants were released.
Measures
Visual attention was measured via mobile eye tracking. A monocular system based on the cornea reflex methodology was used (30 Hz, Tobii Glasses, Danderyd, Sweden). The system allows free movement of participants and captures scenes up to 56° horizontally and 40° vertically. Participant gaze fell into this range because the products of interest were presented at eye level and the shelf was 60 cm wide, thus fully able to capture the range of gazes. Two measures of visual attention were assessed: (i) gaze duration, i.e. the sum of fixations (during which eyes are relatively stable) and saccades (during which eye movements occur) that fall within in a certain area (here: product packaging); and (ii) gaze frequency, i.e. a measure of how often a certain area has been looked at. These measures are valid indicators of visual attention( Reference Rosbergen, Pieters and Wedel 12 ).
The healthfulness of the food choice was measured via the SSAg/1 score( Reference Rayner, Scarborough and Stockley 13 ) – an open-ended score that is calculated based on a food's composition. The choice of the snack food was recorded via eye-tracking videos and then matched with the SSAg/1 scoring. SSAg/1 scores of 0 represent the lowest amounts of nutrients that are considered to be harmful as part of a hyperenergetic diet (e.g. saturated fats, salt). The higher the score, the less healthful is the food. The scores of the products under examination ranged from 1 (healthiest; rice cakes) to 18 (unhealthiest; banana chips, see Appendix).
The importance of health and taste when choosing the snack was assessed via two single items (‘How important was taste [health] when you chose the snack?’), measured on a seven-point scale (1 = not important at all, 7 = very important). Familiarity with the scheme was assessed via a single-item measure (‘How familiar are you with the nutrition labels?’ 1 = very unfamiliar, 5 = very familiar).
Results
A two-factorial ANOVA was conducted to test H1. The presence (v. absence) of health marks, the presence (v. absence) of traffic light colour-coding and their interaction were modelled as independent variables. The gaze duration on all fifteen packages was modelled as the dependent variable. Eight participants were excluded from the analysis because of invalid eye-tracking data. Gender, familiarity with the nutrition labels and healthfulness of the choices of the three filler products did not affect any of the hypothesized relationships in the ANOVA and in any of the forthcoming analyses. Thus, for reasons of clarity, we report the analyses without these variables.
The results revealed a main effect of traffic light colour-coding, with longer gaze duration on the product packaging when nutrition information was labelled green, amber or red (mean 17·35 (sd 13·62) s) than without such labelling (mean 13·77 (sd 9·70) s; F(1, 148) = 3·97, P < 0·05, η 2 = 0·026). The presence of health marks did not affect gaze duration (F(1, 148) = 2·13, P = 0·15, NS). However, more importantly, there was a significant two-way interaction (F(1, 148) = 5·72, P = 0·02, η 2 = 0·037). As postulated in H1, the presence of health marks decreased gaze duration in the absence of traffic light colour-coding (t(73) =3·48, P < 0·001) while gaze duration was not affected and generally high when traffic light colours were present (t(75) = −0·56, P = 0·58, NS). Fig. 2(a) visualizes the results.
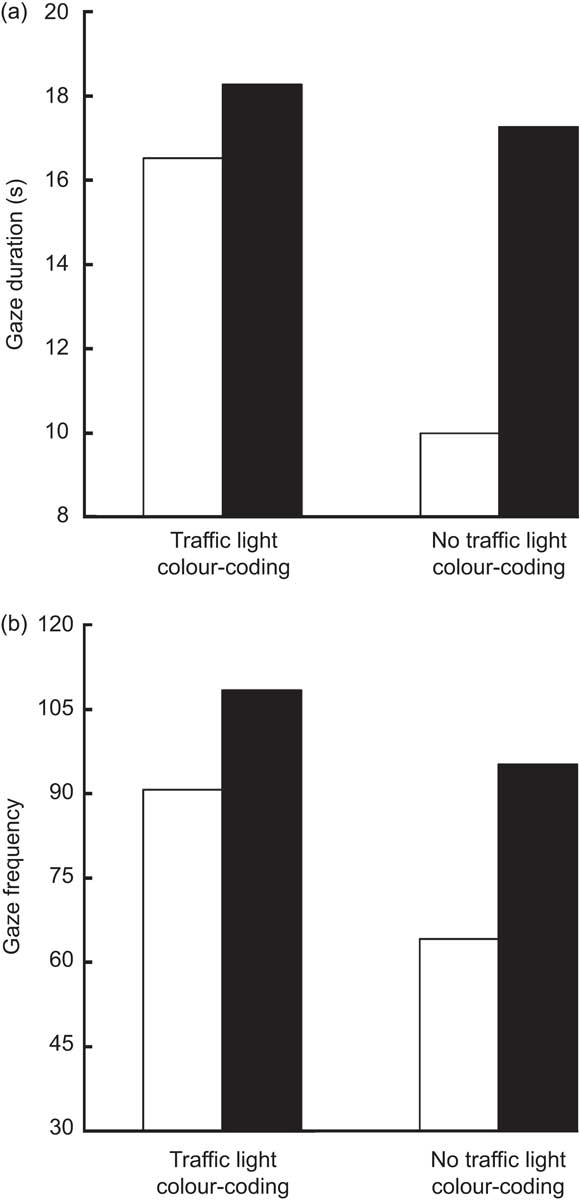
Fig. 2 Gaze duration (a) and gaze frequency (b) on the product packaging of the snack foods as a function of numeric front-of-package nutrition information with (v. without) health marks and with (v. without) traffic light colour-coding among 160 consumers aged 19–64 years who were mainly responsible for grocery shopping in their household (![]() , with health marks;
, with health marks; ![]() , without health marks)
, without health marks)
The hypothesized two-way interaction between health marks and traffic light colour-coding was also significant for gaze frequency (F(1, 148) = 6·26, P = 0·01, η 2 = 0·041). The presence of health marks decreased gaze frequency in the absence of traffic light colour-coding (t(73) = 2·83, P = 0·006) while gaze frequency was not affected when traffic light colours were present (t(75) = −1·11, P = 0·27, NS; see Fig. 2(b)). This supports H1. Again, there was a main effect of traffic light colour-coding with higher gaze frequency on the product packaging when nutrition information was labelled green, amber or red (mean 99·21 (sd 70·34)) than without such labelling (mean 80·27 (sd 49·74); F(1, 148) = 4·16, P = 0·04, η 2 = 0·027). The presence of health marks did not affect gaze frequency (F(1, 148) = 0·47, P = 0·49, NS).
The healthfulness of the snack food choices could be assessed from the eye-tracking videos. To evaluate the overall healthfulness of the choices, one may consider a situation where consumers make a random choice of one snack. Given a random selection had been made, participants would have chosen a product with an average SSAg/1 of 9·47. However, the actual mean of 13·31 was well above this figure, and this was true for all experimental groups (see Fig. 3). This observation supports previous findings that, in actual in-store choice situations, food selections are driven by the anticipated tastiness of the food( Reference Grunert, Wills and Fernández-Celemín 14 ) and that higher tastiness goes along with less healthful food choices( Reference Raghunathan, Walker Naylor and Hoyer 15 ). A mixed ANOVA revealed that taste (mean 6·13 (sd 0·96)) was more important to consumers than health (mean 3·83 (sd 1·70); F(1, 156) = 220·26, P < 0·001, η 2 = 0·585) when making their choice. Neither the experimental conditions nor any of the interactions affected the ratings.
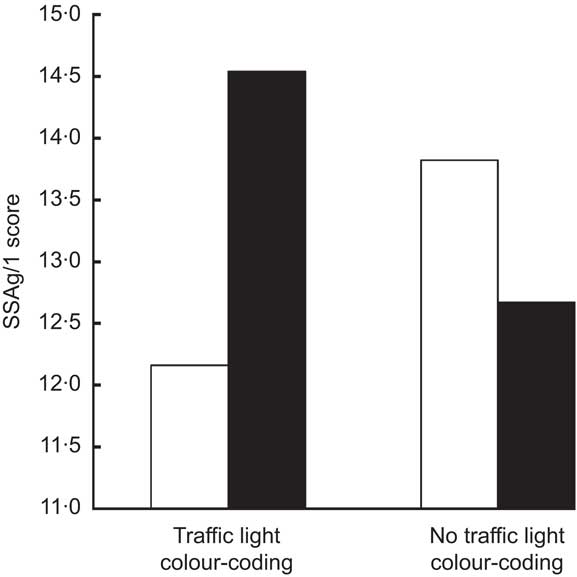
Fig. 3 Healthfulness of snack food choices as a function of numeric front-of-package nutrition information with (v. without) health marks and with (v. without) traffic light colour-coding among 160 consumers aged 19–64 years who were mainly responsible for grocery shopping in their household (higher SSAg/1 scores reflect less healthful food choices; ![]() , with health marks;
, with health marks; ![]() , without health marks)
, without health marks)
But did the presence of directive cues on the nutrition labels affect the healthfulness of choices? To test whether the combination of the two heuristic cues led to more healthful snack choices (H2), a two-factorial ANOVA with the SSAg/1 score as the dependent variable was conducted. The presence (v. absence) of health marks did not influence the healthfulness of the choices (F(1, 156) =0·54, P = 0·46, NS). Also, the presence of traffic light colours had no effect (F(1, 156) = 0·02, P = 0·90, NS). However, as predicted, there was a significant interaction between the two variables (F(1, 156) = 4·44, P = 0·04, η 2 = 0·028; see Fig. 3). Follow-up analyses revealed that the presence (v. absence) of health marks led to more healthful food choices when traffic light colours were present (from mean = 14·54 to mean = 12·16; t(76) = 2·11, P = 0·04). In the absence of traffic light colour-coding, health marks did not exert any influence on the healthfulness of the choices (from mean = 12·67 to mean = 13·82; t(80) = −0·93, P = 0·35, NS). This supports H2.
Discussion
The present study captured behavioural reactions (i.e. gazes and actual food choices) of a broad consumer sample in response to changes in front-of-pack nutrition labelling. Researching behavioural decisions seems necessary because ‘consumer self-reports on evaluation and intended use of nutrition labeling schemes are poor predictors of the actual effect of such labeling schemes on healthy choices’( Reference Van Herpen and van Trijp 3 ). Choice behaviour was assessed in situations where consumers were not aware of the purpose of the study and when no health goals were primed, with the aim to reduce the bias of social desirability.
Public policy implications
Public policy makers have been struggling to identify types of front-of-package nutrition information schemes that truly affect in-store choices made by consumers. The present research has built upon the results of previous studies: it implemented key elements of nutrition information that are well understood by consumers( Reference Grunert, Fernández-Celemín and Wills 1 ) and presented the information in a uniform format and in a consistent way( Reference Bialkova and van Trijp 6 ) on all products( Reference Königstorfer and Gröppel-Klein 16 ). Although these conditions are not met in real-life markets, they can be assumed to be a prerequisite to make front-of-package nutrition labelling work. Regulations standardize such conditions and reduce confusion among consumers (such as in the Nutrition Labeling and Education Act( Reference Draper, Adamson and Clegg 17 )).
The aim of the present study was to depart from these baseline conditions and identify how combining directive nutrition labelling elements affects behavioural decisions. The combination of numeric nutritional information (here: energy (calories), fat, saturated fats, sugar and salt) with health marks (here: healthy choice tick) and traffic light colours (here: referring to the four nutrients) was most effective. This combination did not reduce consumers’ visual attention and produced more healthful outcomes (compared with traffic light colour-coding only). Based on the results of our study, public policy makers may prefer such types of nutrition information.
Generalizability of the results
The study showed that, in the absence of traffic light colour-coding, health marks on nutrition labels reduced attention to the packaging. This effect did not occur when traffic light colours were present. The combination of health marks and traffic light colour-coding (v. presenting traffic light colours only) made consumers choose more healthful products, according to the nutrient profile. However, one may question whether the effects can still be observed in real-life supermarket environments because the selection of the snack products and their placement on a shelf do not resemble a real-life shopping situation, where products are grouped by category and favour intra-category and not inter-category decision-making. As a result of this, the variation in the SSAg/1 is likely to be smaller in real life and health marks would be awarded according to intra-category criteria. Therefore, the results cannot be transferred to real-life nutrition labelling.
Outlook
Future research should assess whether the findings can be replicated in real life. Future studies may also find out whether other directive elements of nutrition information produce the same effects as traffic light colour-coding and health marks( Reference Hodgkins, Barnett and Wąsowicz-Kiryło 4 ). The effects of the traffic light colours may be unique to these colours, because they induce automatic approach and avoidance tendencies in consumers that have been implicitly learned and thus can influence behavioural reactions within milliseconds( Reference Koenigstorfer, Groeppel-Klein and Kamm 8 ). Therefore, other directive cues such as star ratings of each nutrient may be less effective. Also, providing summary information (e.g. numeric average values per product category( Reference Viswanathan and Hastak 18 )) may not be as effective as traffic light colour-coding. In regard to the generalizability of the health marks effect, we expect that the results can be replicated as long as the symbol allows an immediate classification and is associated with the meaning of overall healthfulness. Heart or smiley symbols are potential candidates in this context.
Future studies may also assess the effects of front-of-pack nutrition labelling when not only stimulus characteristics but also consumer variables change. The health effect may be stronger in situations where consumers are motivated to make healthy decisions and where consumers are educated about nutrition labelling( Reference Moorman 19 ). Our studies took place in a country where traffic light colours did not appear on real food products. Educating consumers about the use of the colours may increase public health benefits.
Conclusion
The present study was designed to assess the behavioural effects of front-of-package nutrition labelling elements on consumers. Adding both health marks and traffic light colours (v. traffic lights only) to numeric nutritional information produces favourable outcomes from the perspective of public health. Future studies should assess the impact of such labelling on consumer behaviour in real life and in food consumption contexts in order to fully evaluate the public health effects.
Acknowledgements
Sources of funding: The authors gratefully acknowledge the European Community financial contribution under the Seventh Framework Programme for Research, Technological Development and Demonstration Activities, for the Small Collaborative Project FLABEL (Contract no. 211905). The content of the paper reflects only the views of the authors; the European Commission is not liable for any use that may be made of the information contained in this paper. Conflicts of interest: There are no conflicts of interest. Authors’ contributions: J.K. designed and conducted the study, did the statistical analyses and was mainly responsible for writing and revising the paper. G.W.-K. and M.S.-K. designed and conducted the study and gave feedback on drafts of the manuscript. A.G.-K. designed the study and gave feedback on drafts of the manuscript. Acknowledgements: The authors thank Magdalena Marczak, Jakub Wąsowicz-Kiryło and Elżbieta Bednarska for setting up the laboratory store and generating the mock-up products. They also thank Izabela Pilarska, Dominika Świerżewska, Kamila Bilska, Anna Reinholz-Trojan, Agnieszka Słupecka, Anna Pańczuk and Victoria Dehnhard for their help with the data collection. They thank Anastasia Blocha, Michael Engstler, Jennifer Helfgen, Andreas Keim, Rebecca Mascioni, Julia Math, Sonja Michel, Sandra Nitschke, Steffi Schweickard, Sabrina Trautmann and Jessica Zeibe for the help with the coding of the eye-tracking videos.
Appendix
Snack foods presented on the shelf