


INTRODUCTION
Surveillance for exotic diseases is becoming increasingly challenged by changes in international trading patterns, and is at least partially driven by increases in commercial livestock production in less industrialized countries. These challenges are exacerbated by shifts in global climate patterns that have resulted in changing agricultural systems and changing vulnerability to different diseases. This is also complicated by the recent global economic recession, making cost savings an essential component of any surveillance system. In this environment, risk-based surveillance based on statistically rigorous evidence offers opportunities both to reduce cost and better identify potential outbreaks of disease [Reference Stark1].
One example where a risk-based surveillance strategy could be exploited is for bovine tuberculosis (bTB) in Scotland. bTB is caused by Mycobacterium bovis and is a zoonotic disease that continues to be a major problem to the cattle population in Great Britain (GB) and Ireland [Reference Bourne2–Reference White6]. In increasingly large areas of England and Wales the prevalence of bTB continues to rise (see Defra website [7]). However, the prevalence in Scotland has remained at a very low level throughout this period and there is little evidence that prevalence is increasing [8]. Due to regularly recording a prevalence of <0·1% of non-introduced cases, Scotland was granted status as an officially (bovine) TB-free (OTF) region on 8 September 2009 [9]. However, in order to retain OTF status Scotland must continue to demonstrate maintenance of freedom from disease. As a result, new bTB controls were introduced shortly after the granting of OTF status not only because of the proximity to England and Wales but also in the light of the recent German and Swiss experience of relying on slaughterhouse surveillance alone [10–Reference Hadorn and Stark13]. However, by implementing a well-designed risk-based surveillance strategy, it may be possible for Scotland to continue to effectively demonstrate freedom from disease while testing considerably fewer animals than are tested under the current surveillance systems.
In Scotland ante-mortem testing for bTB is currently performed using the single intradermal comparative cervical tuberculin test (SICCT). The SICCT requires one visit to the farm to inoculate the animals with a bovine and an avian tuberculin and a second follow-up visit 72 h later to assess the reaction of the inoculated animals [Reference de la Rua-Domenech14]. This requirement for a follow-up visit for the SICCT is a major cost factor, so alternative tests requiring only a single visit are considered attractive. Animals that exhibit a stronger reaction to the bovine tuberculin relative to the avian tuberculin are said to be ‘reactors’, the herd is designated as a ‘breakdown’ and certain movement restrictions placed on the farm. Marginal results are known as inconclusive reactors (IRs) and are retested individually 60 days later [Reference Green and Cornell15]. Any reactor animal is slaughtered and the case is only confirmed following the successful culture of M. bovis from suspect lesions.
Currently all eligible herds in Scotland are tested once every 4 years under the routine herd testing (RHT) policy. Under RHT breeding bulls, females that have calved and younger animals that have been bought in and could be used for breeding (and are aged >42 days) are eligible for testing [Reference Green and Cornell15]. There is some local risk assessment applied, for example herds with animals that are resident for only a short period of time can apply for non-eligible stock (NES) status and are exempted from testing. RHT is supplemented by further whole herd tests, triggered by post-movement testing of cattle moving from England and Wales and Ireland into Scotland and contact tracing following a confirmed breakdown (Table 1).
Table 1. The number of herds and animals tested by different surveillance types between 2002 and 2008 (note that whole herd tests do not require that the entire herd is tested)
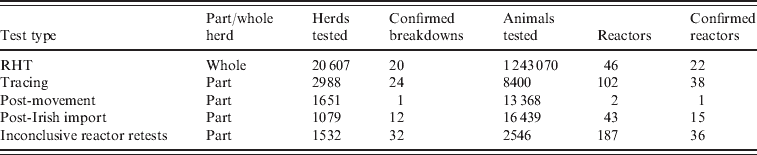
RHT, Routine herd testing.
Post-mortem surveillance is performed at the slaughterhouse by inspecting the lungs, lymph nodes and other viscera of all carcasses for evidence of TB lesions. A case is confirmed if M. bovis is successfully cultured from a suspect lesion; then the herd that sent the animals to slaughter and if necessary in-contact herds, are followed up for further testing. The number of animals that are sent to slaughter varies greatly between different types of herds.
Thus, the aims of these analyses are to:
(1) Evaluate whether slaughterhouse surveillance alone is sufficient to ensure a high level of confidence of freedom from infection.
(2) Evaluate alternative strategies to RHT that are based upon risk. This should incorporate both the risk of infection and the risk of detection at the slaughterhouse. The strategy should involve the testing of fewer herds while not impacting greatly on the ability of the system to detect new cases.
(3) Minimize the number of false-positive herds identified by testing.
(4) Evaluate the interferon-gamma (IFN-γ) test as an alternative to SICCT.
METHODS
These analyses used a mixed logistic regression model to define the probability of a herd becoming infected, and implemented components of a stochastic simulation model developed by the Veterinary Laboratories Agency (AHVLA meta-analysis study team, personal communication), to calculate the probability of a herd's freedom from infection. The specifics of implementing these models and adapting them to consider the specific requirements of a surveillance framework for Scotland are described below and the parameters are summarized in Table 2.
Table 2. Summary of the parameters used in this study

SICCT, Single intradermal comparative cervical tuberculin test.
Model description
To evaluate the likelihood of herd-level freedom from infection with bTB during a specified time period (t) the model requires that the following parameters are defined:
(1) The probability of the herd becoming infected during t (p(intro)). This is derived from the regression model (described in the online Supplementary material).
(2) The number of animals in the herd (N).
(3) The bTB surveillance implemented on the farm. Two types of surveillance can be considered:
(a) slaughterhouse meat inspection of animals sent to slaughter;
(b) whole herd testing (i.e. testing the entire herd).
(4) The herd-level prevalence of infection p star.
The efficacy of the surveillance system is evaluated by calculating the herd-level test system sensitivity (se system), which allows the inclusion of multiple tests. However, in this framework only the routine ‘whole herd’ SICCT testing and part herd slaughterhouse testing are considered, thus the formula takes the form:
 $$se_{{\rm system}} \equals 1 \minus \lpar 1 \minus se_{{\rm herd}} \rpar \lpar 1 \minus se_{{\rm part}} \rpar \comma $$
in which se herd is the sensitivity of the SICCT implemented as a herd test, and se part is the part herd sensitivity for slaughterhouse surveillance. The herd sensitivity for a whole herd test is calculated as:
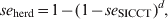 $$se_{{\rm herd}} \equals 1 \minus \lpar 1 \minus {\mathop{se}\nolimits} _{{\rm SICCT}} \rpar ^{d} \comma $$
in which se SICCT is the sensitivity of the diagnostic test. The distributions of the test sensitivities (Table 3) were defined by a meta-analysis performed by the Veterinary Laboratories Agency (AHVLA meta-analysis study team, personal communication; Downs et al. [Reference Downs16]). The parameter d is the number of infected animals in the herd defined as:
Table 3. Parameters for diagnostic tests used in these analyses
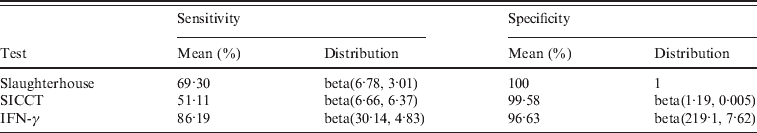
SICCT, Single intradermal comparative cervical tuberculin test; IFN-γ, interferon-gamma test.
 $$d \equals N \times p_{{\rm star}}.$$
The value of d is derived from the product of a beta(2, 90) distribution and the number of animals in the herd (see Supplementary material for the derivation of this parameter). The sensitivity for a part herd test for the proportion of the herd that is sent to the slaughterhouse is:
 $$se_{{\rm part}} \equals 1 \minus \left( {1 \minus {{n \times se_{{\rm slh}} } \over N}} \right)^{d} \comma $$
where n is the number of animals tested (sent to slaughter).
In these analyses the detection of reactors that do not go on to be confirmed and thereby consume resources through slaughter of the unconfirmed reactors and follow-up testing on the herd is given by:
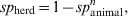 $$sp_{{\rm herd}} \equals 1 \minus {sp_{{\rm animal}}^{n}} \comma $$
where n = N for whole herd tests and sp animal is the specificity of the test.
The probability of freedom (the posterior) at t is given by:
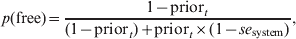 $$p\lpar {\rm free\rpar \equals }{{1 \minus {\rm prior}_{t} } \over {\lpar 1 \minus {\rm prior}_{t} \rpar \plus {\rm prior}_{t} \times \lpar 1 \minus se_{{\rm system}} \rpar }}\comma $$
where priort is the prior probability that the herd is infected. The prior for t+1 is:
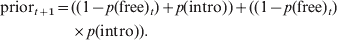 $$\eqalign{ {\rm prior}_{t \plus \setnum{1}} \equals \tab \lpar \lpar 1 \minus p\lpar {\rm free \rpar }_{t} \rpar \plus p\lpar {\rm intro\rpar \rpar \plus \lpar \lpar 1} \minus p\lpar {\rm free \rpar }_{t} \rpar \cr \tab \times p\lpar {\rm intro\rpar \rpar }{\rm .} \cr} $$
The model was implemented in the R statistical environment [17] and run for 100 iterations. The model was implemented for all herds in Scotland for all years between 2002 and 2008. Proxy data for 1998–2001 were derived from the observed data from 2002 and 2003 [years for which data are available and excluding the time-frame around the 2001 foot-and-mouth disease (FMD) epidemic]; this was to enable a ‘burn-in’ period for the model to ensure that it was stable for the period of simulation. Model stability was further tested by comparing the results from 2003 to 2008 with those from just 2005 to 2008 in a sensitivity analysis. The defined time period for implementation (t) is 1 year. As 2002 was the first year for which there was actual data and as this was a ‘rebound year’ from the 2001 FMD epidemic the statistics from this year were found to be unstable. As a result the fitted values from 2002 were discarded. For whole herd tests over a regular repeat period (such as 4-year testing) the start year of the herd testing cycle (e.g. between years 1 and 4 for 4-year testing) was generated randomly for each iteration.
Model implementation
A number of risk-based surveillance options were explored based upon both how likely a holding is to become infected and how likely an infection is to be detected at the slaughterhouse. We required that any system replacing RHT would need to largely identify the breakdowns that historically were identified by RHT. The following were identified as likely determinants of the risk of infection and subsequent detection (based upon the analysis of Bessell et al. [Reference Bessell18] and expanded in the Supplementary material):
(1) The size of the holding – larger holdings being at greater risk of infection.
(2) The proportion of the farm's total stock that is sent to slaughter during each time period –holdings that send less stock to the slaughterhouse require more active surveillance.
(3) Where the holding sources its stock – whether the holding is buying in animals from high-risk (1-year testing) areas in England, Wales and Ireland.
These risk-based scenarios were plotted against the minimal surveillance scenario comprising just slaughterhouse surveillance and combined to understand their importance in determining missed infections at slaughterhouse (Supplementary material).
Three different baseline scenarios can be modelled based upon an annual time-frame for surveillance and assuming that slaughterhouse surveillance will continue:
(1) Minimal model – slaughterhouse surveillance only.
(2) Current scenario – 4-year whole herd testing and slaughterhouse surveillance.
(3) Maximal model – annual whole herd testing and slaughterhouse surveillance.
The maximal and minimal scenarios represent the bounds of what can be achieved using this framework. Herds with a low probability of disease freedom in the minimal model are those that should be targeted in any risk-based surveillance scheme. The risk-based combinations were compared with the current (4-year testing) surveillance scenario. Depending on whether the herd is deemed to be at-risk and the identified level of risk (herds may have different levels of risk assigned), the following time-frames for testing were explored:
(1) Four-year testing for all risk herds.
(2) Staggered 4- and 2-year testing depending upon the level of risk.
(3) Staggered 4-, 2- and 1-year testing depending upon the level of risk.
Model evaluation
The risk-based scenarios were evaluated by comparing their fitted number of latently infected premises to the equivalent fitted values from modelling current 4-year RHT surveillance. The following were calculated over the period 2003–2008:
(1) The number latently infected in 2008.
(2) The annual mean number latently infected between 2003 and 2008.
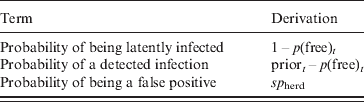
The total number of detected breakdowns in each year between 2003 and 2008 was calculated as the difference between the model prior and posterior. The parameter sp herd gives the probability of a given herd being a false positive (i.e. an unconfirmed reactor). Therefore, the summation of sp herd for all herds for a given year gives the expected number of false positives (Table 4).
Table 4. The derivation of each term for each farm at time t. The national totals for each term are given by summing the values for all herds
By examining situations that require fewer annual tests than current surveillance, a number of scenarios were identified with testing regimens and various cut-offs selected based upon epidemiological relevance and ease of implementation. The composition of these scenarios was developed by exploring the determinants of infection and detection across the testing windows (both described above). Based on this the following scenarios were more fully evaluated relative to the number of latent infections produced by current surveillance:
(1) Improved detection. The mean number of latently infected herds is >5% lower than produced by current surveillance (i.e. detecting at least one extra infected herd). This can only be achieved using a temporal window that includes surveillance over intervals that are shorter than 4 years.
(2) Similar surveillance. The mean number of latently infected herds is within 5% of the current surveillance, for fewer herds tested.
(3) Lower detection surveillance. The mean number of latently infected herds is between 5% and 15% greater than current surveillance, the latter figure is taken as a cut-off above which no surveillance system would be considered.
Data
The data used to populate the model were derived from VetNet and the British Cattle Movement System (BCMS) Cattle Tracing System (CTS). The following steps were used to derive the cattle herd data:
(1) All herds with a unique county parish holding (CPH) number on the VetNet herd table that were active during all of the years between 2002 and 2008 (inclusive) were identified. This comprised 12 016 herds.
(2) Of the herds identified above, only those that had animals recorded on CTS were included; this comprised 11 730 herds. For these the number of animals in the herd on 1 January was calculated. There were a total of 1 757 168 animals on 1 January 2008.
(3) The number of animals sent to slaughter from these herds in each year was calculated. For the purposes of this study, the holding that sent the animal to slaughter is the last holding on which the animal spent at least 7 days prior to slaughter. In 2008, 5 06 239 animals were sent to slaughter from holdings in Scotland.
Assumptions and simplifications
These analyses are dependent upon a number of assumptions that must be considered when interpreting the results:
(1) That all herds are tested. These analyses have included herds currently exempt from testing as NES herds.
(2) The entire herd is tested under RHT. Those animals that are not included in RHT were included in these analyses. This is due to the complexity of identifying stock and herds that are eligible for testing under RHT, and the impacts of this assumption is explored in sensitivity analysis.
(3) That slaughterhouse meat inspection will continue.
(4) That current additional tests will continue to be used such as tracings, pre- and post-movement tests and post-import tests.
(5) That all testing is random and independent. For example, while there will be some variability in the test sensitivity and specificity, this is not meaningfully clustered, and therefore no herds or herd types have an inherently higher sensitivity than others.
(6) That the SICCT and slaughterhouse surveillance are independent.
(7) That SICCT is the optimal test for RHT as it is the standard test for bTB surveillance in GB. Sensitivity analysis was performed using the IFN-γ test.
RESULTS
Basic models
The results of the three baseline scenarios – the maximal, minimal and current surveillance models are summarized in Table 5. Analysis of the mean number of animals sent to slaughter per year during the period 2002–2008 against the mean herd size on 1 January shows a linear relationship with distinct clustering of fattening and dairy herds (Fig. 1). While dairy herds are typically larger, they typically have far fewer per capita movements to slaughter compared to fattening herds.

Fig. 1. Scatterplot showing farm size on 1 January against the mean number of animals moved to slaughter between 2002 and 2008 broken down by herd type as listed in VetNet. The axes have been truncated for clarity.
Table 5. Summary of test results. The current system which forms the baseline for comparison is highlighted in bold.

Risk-based methods
Following screening of possible surveillance combinations using a system of matrix analysis of these risk measures, four different scenarios based upon identifying herds that are more likely to be infected and not detected have been identified for further consideration. Under all scenarios, importing animals from high-incidence areas was considered a high risk [of which there were 1843 (15·7%) herds]. These are the optimal testing scenarios for the better, similar and two lower detection scenarios (Table 6).
Table 6. Composition of the risk-based surveillance scenarios

bTB, Bovine tuberculosis; RHT, routine herd testing.
* bTB is the number of confirmed breakdowns between 2003 and 2008 that fell into that category. RHT is the breakdowns that were detected by RHT.
The risk-based surveillance system that delivers improved detection and freedom from disease can be achieved through testing slightly fewer herds and animals (Fig. 2, Table 5). The system that reproduces similar levels of detection to those seen currently can be achieved through testing 697 fewer herds and 122184 fewer animals (Table 5). The two ‘lower detection’ scenarios were developed because one offers a saving of 40% of the number of herds tested (1768 herd tests per annum compared to 2933 under the current scenario) but would have missed a large number of the breakdowns that were identified by RHT (Table 5). The second offers a smaller saving in terms of herds tested – a reduction of 28% (2110 herd tests per annum compared to 2933 under the current scenario) but would have identified 32 of the breakdowns that were identified by RHT (Table 6).

Fig. 2. Cumulative distribution plot of the probability of each herd harbouring undetected infection at the end of each model time step for all herds in Scotland from the three baseline models. The ‘Slaughterhouse only’ scenario represents a minimal model (the lowest amount of surveillance that could be under) and the ‘Annual routine herd testing’ scenario is the maximal model (the most surveillance that could be undertaken under the current testing regimens). The remaining four scenarios are the four risk-based surveillance systems. The x axis has been truncated for clarity.
Sensitivity analyses
The current model tests all animals rather than all eligible animals. Accordingly, to check the results for sensitivity to the number of animals that are actually tested, the number of animals tested in the model was set equal to the number tested in the previous test that is recorded for that herd on the VetNet database. The results, with the exception of the ‘lower detection 2’ scenario were not substantially different. Furthermore, the results were insensitive to the selection of testing period; when the period 2005–2008 was analysed the results were similar to those presented here, with the exception of the ‘lower detection 2’ scenario, which required a large increase in the numbers of animals and herds tested. Testing using the IFN-γ test resulted in a substantially larger number of false positives due to the relatively poor specificity of the IFN-γ test (Tables 3 and 5).
DISCUSSION
This paper has described the development of a model to evaluate strategies for risk-based surveillance for bTB. The strategies developed here provide different balances between the requirements for disease detection and minimizing the surveillance effort, and all have broadly similar efficacy to detect infections, compared to the current 4-year RHT. The levels of detection under current surveillance can be replicated by testing 76% of the herds and animals that are currently tested. This strategy would have included all but one of the breakdowns that were identified through RHT and in the model provides statistically equivalent results.
Of the scenarios developed here, the improved, similar and one of the lower detection scenarios selected holdings for testing based upon the proportion of stock slaughtered and the number of batches of high-risk animals moving onto the farm. They differed only in terms of the cut-off thresholds for inclusion (Table 6). The fourth scenario – the second of the lower detection scenarios included the testing of large herds as well as those that slaughter few animals and import animals from high-incidence areas.
Three different temporal windows were investigated: the current 4-year testing and two staggered systems: 1-, 2- and 4-year testing and 2-/4-year testing. Different solutions emerged from these testing windows. The results show that current 4-year testing is effective. However, if greater freedom from infection were desirable, then testing certain herds on a more regular basis would facilitate this.
The principal conventional risk factor for being a breakdown herd that was incorporated in the risk-based surveillance strategies is the importing of animals from high-risk areas of England, Wales and Ireland. Of the 1843 herds that import animals from high-incidence areas, 1267 (69%) would be tested under this strategy; the remainder slaughter >40% of stock and are exempt (Table 6). Two of the systems presented here require testing herds that slaughter <25% of stock per year (Table 6). This ensures that those herds that would not on average replace their entire stock over a 4-year period are tested for bTB.
During the period 2003–2008 there were 98 breakdowns; 32 of the cases were identified by slaughterhouses and 36 by RHT (either directly or by triggering an IR retest that resulted in a confirmed breakdown). However, despite comprising only RHT and slaughterhouse surveillance, the model predicts around 95 cases detected. This is because the remainder of the surveillance is made up of other types of testing not made up for here, such as pre- and post-movement tests and tracings. These are not included in this analysis; however, in essence the model is allowing for their detection at slaughterhouse or by routine surveillance at a later time point; these factors are not expected to affect the scenarios modelled here. However, for the system to function effectively slaughterhouse surveillance must be performed to an equal standard across slaughterhouses. Variation is accounted for by sampling from a distribution, but this does not allow for differences in ascertainment that may exist between slaughterhouses. Any failure to implement surveillance to a uniform standard throughout the country may lead to a clustering of latently infected premises and consequent disease spread in certain areas.
The surveillance scenarios presented here are taken from a continuum and can be adapted and tailored to specific needs. Of the four scenarios developed there were two scenarios that produced up to 15% lower surveillance. Two ‘lower’ scenarios were chosen for illustration because they offered different advantages. One missed 15 of the herds that were detected by current RHT but involved many fewer tests, while the other scenario performed better but required the testing of many more animals (Tables 5 and 6). It also had the advantage of ‘penalizing’ those herds that were at greater risk, especially due to importation. Thus it would serve as a disincentive to this behaviour. The similar and the better detection scenarios were variants of each other and both detected 35 of 36 RHT breakdowns (Table 6). Therefore, the ‘similar’ scenario that requires less testing is recommended.
The systems presented here require the continued implementation of the standard SICCT with the disadvantages already described. However, at present there are no credible alternative tests. The mean specificity of the IFN-γ test is 96·6%. While the improved sensitivity of the test means that there is greater detection, the lower specificity in a low-prevalence setting with a large number of animals per herd results in around 50% of herds returning at least one false positive. However, the development of such tests and test combinations should be continually monitored and tested to investigate whether they offer an improvement to the scenarios presented here.
These surveillance systems are very effective at ensuring that not only are the herds with the highest risk of harbouring infected animals tested, but also herds that recorded a breakdown are detected, thereby validating the model. In addition to this, the improved targeting of surveillance means that fewer false positives are found, as fewer animals are tested. As the strategies are based upon the proportion of stock slaughtered, herds that are not detected by routine surveillance are sending sufficient animals to slaughter to ensure that the slaughterhouse picks up infections.
Slaughterhouse surveillance will be assisted by pre-movement testing which minimizes the movement of infected animals between holdings within Scotland. Pre- and post-movement testing is also routinely performed on virtually all imports from England and Ireland [Reference Christley19]. In spite of these movement tests, the risk-factor model demonstrates that the type of holdings that import higher risk animals are more likely to become infected. However, these holdings should be tested by risk-based RHT in addition to continued pre- and post-movement testing. Out of 36 breakdowns, the 35 that were identified by RHT are included in the ‘similar’ surveillance strategy. However, only 18/32 slaughterhouse identified breakdowns and 6/14 breakdowns that were identified by epidemiological tracing are included for RHT surveillance in the ‘similar’ risk-based system. Therefore, these other testing systems must continue to be implemented, in order to detect these extra breakdowns.
In conclusion, with increased demand for more effective and efficient surveillance for livestock diseases, risk-based surveillance presents an attractive opportunity to both better our ability to detect disease, while making considerable cost savings. This opportunity is enhanced by the availability of detailed demographic and livestock movement databases, allowing for more precise identification of herds and premises at risk. This will only be enhanced by the likely adoption of electronic tagging at the individual level. While our analysis pertains only to the surveillance of bTB in Scotland, similar approaches could be envisaged for targeting surveillance of both bTB and other infectious livestock diseases throughout the European Union, where such detailed databases are becoming widespread.
SUPPLEMENTARY MATERIAL
For supplementary material accompanying this paper visit http://dx.doi.org/10.1017/S0950268812000635.
ACKNOWLEDGEMENTS
This work was commissioned and funded by the Scottish Government. R.R.K., R.O. and A.O'H. are supported by the Wellcome Trust. We are grateful to Andy Mitchell (AHVLA) for support with data. We acknowledge the contribution of the distributions of test performance derived from the SE3238 Meta-analysis of diagnostic test performance and modelling of testing strategies for control of bovine tuberculosis in GB project led by Sara Downs (VLA), with meta-analysis component led by Javier Nunez-Garcia (AHVLA) and Matthias Greiner [Federal Institute for Risk Assessment (BfR)], modelling to control TB component led by Jessica Parry (AHVLA) and Angus Cameron (AusVet), with systematic review of test performance conducted by many scientists [Reference Downs16] and funded by Defra.
DECLARATION OF INTEREST
None.


 Open access