


INTRODUCTION
Understanding the spread of respiratory pathogens is a public health priority as many of the greatest threats to human health are spread by direct person-to-person contact. A major challenge is identifying and quantifying the behavioural, social and environmental factors which permit the transmission of such pathogens and generate larger-scale patterns of spread. Accurate predictions of the likely impact of new or re-emerging pathogens and improved targeting of control interventions require a quantitative understanding of the factors and mechanisms that promote or inhibit the spread of pathogens through populations.
A principal assertion within the epidemiology of respiratory pathogens is that patterns of social mixing behaviour at the individual level contribute to the dynamics of infection seen at the population level. Despite controversy about the precise role different mechanisms may play in infection [Reference Tellier1, Reference Brankston2], proximity or social contact is thought to be a major factor in the transmission process for many important infections, including SARS, influenza and tuberculosis [Reference Musher3, Reference Rea4]. The prevention of social interactions lies at the heart of non-pharmaceutical interventions for these and other respiratory pathogens. However, robust measures of social encounters were, until recently, lacking, making it difficult to identify the interactions most likely to lead to transmission or the impacts of interventions meant to curtail those interactions. The lack of quantitative measures of infectious contacts makes the parameterization of large-scale transmission models difficult as well, particularly for models which rely explicitly on simulated social contacts to generate infection events.
Currently, there are a number of published studies which have sought to quantify potentially infectious contacts between individuals. This paper seeks to highlight recent and current research in this area and to review the various methodologies and instruments available to quantify social interactions that might lead to transmission. Relevant studies come from many different disciplines and, as such, we have not conducted a systematic review. We discuss the strengths and weaknesses of the methods employed in relevant studies, and suggest promising alternative technologies. Finally, we outline key research challenges currently preventing a better understanding of the role played by specific social contacts in the transmission of respiratory and close-contact infections.
NETWORKS OF CONTACTS
First, we define a potentially infectious contact. Brankston et al. [Reference Brankston2] identified four main modes of transmission for respiratory infections, each of which defines a contact differently: we refer to these modes as airborne, droplet, direct, and fomite. Airborne transmission involves pathogens expelled from an infectious host through coughing or sneezing within small droplets, which become aerosolized. In this form, pathogens can remain suspended and viable in the air for long periods depending on environmental conditions, may be widely dispersed, and can be inhaled by susceptible hosts causing infection [Reference Yang, Elankumaran and Marr5–Reference Weber and Stilianakis7]. Droplet transmission is where pathogens are expelled from the host in larger, heavier droplets, which do not travel far from the infecting host, quickly settling on surfaces, whether those surfaces are inanimate objects or the mouth or mucosal surfaces of susceptible hosts [Reference Stilianakis and Drossinos6, Reference Tellier8–Reference Gralton10]. Direct transmission can occur where the secretions of an infector are transferred directly to the respiratory tract of a susceptible individual, such as through kissing or sharing a cigarette [Reference Fleisher, Pasquariello and Warren11–Reference Rhoads, Magaret and Zerr13]. Fomite transmission is where pathogen is deposited by an infector onto an inanimate object (door handles, keyboards, etc.) also handled by susceptible individuals and ingested [Reference Li14–Reference Winther16]. It is unlikely that any respiratory pathogens are passed between hosts via a single transmission mode: transmission is more likely to occur to differing degrees via all four modes [Reference Weber and Stilianakis17]. However, understanding the relative role of each mode is important, both for control and for defining the type of contact networks to quantify. Significantly, airborne and fomite transmission pathogens do not necessarily require hosts to have close contact to enable infection, while direct and droplet transmission do. Environmental conditions – such as temperature, humidity and ultra-violet light levels – affect the survival rate of pathogens, particularly viruses [Reference Tellier8, Reference Jones18], influencing the exposure risk to individuals and whether it is appropriate to consider them a contact. In a similar way, the use and material of surfaces upon which fomites are deposited influences pathogen viability [Reference Weber and Stilianakis7, Reference Rheinbaben19] and who should be considered a contact.
Contacts between individuals are often represented as a network, where nodes represent individuals and links between nodes represent their contacts and opportunities for transmission (Fig. 1). Network theory has provided epidemiology with many insights into how different patterns of contact and their network structures can affect transmission [Reference Keeling and Eames20]. Visualizing transmission opportunities as networks is difficult, and often fails to capture many of the complex characteristics of the interactions. Sexual partnerships, which may often be more discrete in time and lower in number than social contacts, are difficult to reduce to simple networks based around degree distributions, due to other important characteristics such as sexual behaviour within partnerships which affect transmission risks [Reference Britton, Nordvik and Liljeros21, Reference Nordvik and Liljeros22]. Moreover, the dynamical nature of interactions – changes in contact with individuals or changes in the duration or intensity of contact – is well known to be important for the transmission and control of infections, but is difficult to represent in a static network unless weighted links between nodes are used [Reference Wasserman and Faust23–Reference Eames and Keeling27]. For respiratory infections, where contacts can be classified along a continuum of proximity and duration according to the transmission modes involved, there are likely to be severe limitations by representing interactions as a simple static network. The network approach, however, continues to be a useful way for researchers to think about interactions and transmission between individuals despite its shortcomings. In addition, network theory has shown the importance of different network properties and structures, such as clustering and centrality, for the spread of infections [Reference Keeling and Eames20, Reference Szendroi and Csányi28–Reference Smieszek, Fiebig and Scholz30].
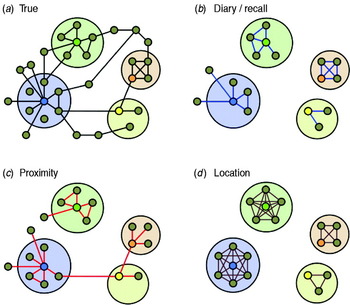
Fig. 1. A stylized illustration of the abilities of different methodologies to capture contact network structures. Individuals are represented as small circles and interactions which permit transmission are links between them. Larger circles represent particular environments or locations in which enclosed individuals are present at the same time. Individuals participating in hypothetical studies are coloured. (a) The true network of contacts between individuals which are viable transmission opportunities for a particular pathogen. (b) The network as measured by anonymous contact diaries, where contacts are not named. Egocentric contact diaries can be used to capture some information on the clustering of contacts, but cannot easily identify links between participants. As the information is subjective it can contain inaccuracies, both missing and erroneous contacts. (c) The network as measured by proximity sensors. Here, clustering may be inferred by the co-location of contacts, and some information on higher-order network structure (longer range links) between participants can be captured. (d) The network inferred by location-based network modelling, where modelled locations are depicted by larger circles. This method is critically dependent on accurate location description, and may lead to overestimation of both the number of contacts made and the local level of clustering.
The network framework permits detailed modelling of different pathogens, for a range of different scenarios, at the individual level. For certain infections where contact tracing is conducted (e.g. SARS or tuberculosis), some network information may be routinely collected in combination with outbreak and case data. For the majority of respiratory infections, however, there is relatively little data available to relate outbreak data to the contact network of cases. Studies of clustered outbreaks involving microbiological sampling may uncover the network structure behind the cases, but are expensive, labour-intensive and difficult. A more practical solution is to measure likely proxies of the true underlying network of potentially infectious contacts, with the presumption that these types of interactions are representative of those that effect transmission. For respiratory infections, these proxy contacts are likely to include spatial and temporal proximity. The methods and studies described below are all based on this contact-proxy approach.
DIRECT OBSERVATION
The direct observation of individuals and their association in time and space is the foundation of many recent studies of contact between animals and their behavioural ecology [Reference Kasper and Voelkl31, Reference Hamede32], but has rarely been employed to study human social interactions from the perspective of disease transmission. There is, however, a history of using video methods in ethnographic studies in the social sciences, for example to study family cohesion [Reference Ochs, Pitt-Catsouphes, Kossek and Sweet33] or pedestrian interaction dynamics [Reference Helbing34].
We know of only two published studies which directly observed and quantified human contact patterns and networks. Polgreen et al. [Reference Polgreen35] observed the number of encounters made by health-care workers during the course of their duties. Villaseñor-Sierra and colleagues [Reference Villaseñor-Sierra, Quinñonez-Alvarado and Caballero-Hoyos36] asked teachers to observe contacts between children at daycare centres, where the children were too young to question directly.
Recent advances in software and technology mean that automation of observation studies may now be possible [Reference Ge, Collins and Ruback37–Reference Gavrila40]; this may help considerably in gathering and analysing interaction data. Observations could be made using video cameras and relevant contacts between participants identified with computer software detection methods (e.g. spatial location and face-recognition technology) [Reference Cheriyadat and Radke41]. Neck-mounted cameras which automatically take a picture every few seconds have been trialled as a memory aid for patients suffering memory impairment [Reference Doherty, Moulin and Smeaton42, Reference Berry43], and a similar system could record much of the social interactions an individual might make during a day, as well as detailing some information about the type of interaction and duration. Security camera recordings are a potentially useful data source for interactions in public space, if such data could be accessed in an ethical way: perhaps by using image processing algorithms to anonymize individuals immediately after they are recognized.
However, there are several reasons why this methodology may be unattractive for human subjects' research. Observational studies are likely to be expensive and logistically challenging if they are to capture the behaviour of a large number of people. There are limitations to the ability of current face-recognition and movement-tracking software algorithms to accurately identify and track the motion or interaction of individuals. Observation from multiple angles is often required to assist the software and to reduce occlusion [Reference Gavrila40], although this is unlikely to be sufficient in high-density public areas. Such studies may also be perceived as too invasive of individuals' privacy, however well the data are anonymized. Additionally, there is the perception that any observation of a subject would need to be exhaustive to capture all the contacts relevant to infection.
Nonetheless, there is great potential for utilizing observations or video recordings of normal interactions to quantify networks of potentially infectious contacts. An important innovation that video-based data provides is that it enables the estimation of several different types of social interaction relevant to transmission. Further, the entire interaction network may be documented (including sharing of objects and fomite pathways). Additionally, there is minimal burden or disruption to participants, although it may require labour-intensive analysis for the researchers. Observational methods may be most suitable to small populations within closed settings, where all interactions can be observed easily. Household, work- and school-based studies of interactions may benefit greatly from this type of approach. Additionally, this may be the only reliable method to record interactions in locations which are difficult to capture using other methods, for example mass transport environments or crowded public spaces, although, again, there are obvious issues in protecting the anonymity of passive participants.
CONTACT DIARIES
Sociology has a long tradition of measuring and analysing social networks, where typically the emphasis is on relationships between the subject and other individuals (termed the ego and alters in the sociological literature). One method often used is the self-reported contact diary, where study participants are asked to record particular social interactions made within a time period [Reference Fu44–Reference Bernard48]. Unfortunately for epidemiologists eager to parameterize models of disease transmission, few of the sociological studies conducted using such instruments are directly relevant. Definitions in these studies of ‘interaction’ can often include email or telephone communications, or are restricted to a limited subset of all possible encounters, such as those individuals whom participants can name or have a particular relationship with [Reference Marsden46, Reference Bernard48].
In attempts to quantify social contact, epidemiological studies which use the contact diary approach have employed tailored definitions of a contact and attempt to only capture infection-relevant encounters. This method has now been applied, from an epidemiological perspective, in a variety of convenience studies [Reference Read, Eames and Edmunds24, Reference Edmunds, O'Callaghan and Nokes49–Reference Mikolajczyk and Kretzschmar52], school-based populations [Reference Glass and Glass53–Reference Eames, Tilston and Edmunds57], heathcare settings [Reference Bernard58], and larger studies of the general public [Reference Wallinga, Teunis and Kretzschmar59–Reference Horby62]. The predominant methodology to emerge is for participants to record encounters made with other people that include a face-to-face conversation or physical touch (of skin on skin). Additional characteristics of contacts can also be sought, such as estimates of duration or typical frequency of contact, or the social setting of encounters. An important distinction should be made between ‘anonymous’ diaries, where subjects only record characteristics of their contacts, and diaries which ask subject to name their contacts – permitting repeat encounters with the same individual to be captured and the full network of participant encounters to be described [Reference Read, Eames and Edmunds24, Reference Smieszek63]. This methodology is clearly dependent on how well individuals can be identified from the information recorded. In addition, it is possible to capture some higher-scale network properties beyond the first degree by asking participants to report which of their contacts also had contact with each other (see Fig. 1b). Some studies have assessed different study designs. Mikolajczyk & Kretzschmar [Reference Mikolajczyk and Kretzschmar52] compared designs where participants completed diaries prospectively – adding contacts and information as they were made during study days – and retrospectively – reporting contacts the following day. They found, on average, more contacts were reported using the prospective design. In contrast, Beutels et al. [Reference Beutels50] found no significant difference between prospectively and retrospectively collected contact data in a similarly designed study. McCaw et al. [Reference McCaw64] compared participants' prospective estimation of the number of contacts with data collected retrospectively, finding participants tended to report fewer contacts when asked prospectively. This study also compared paper diaries with an electronic PDA device which prompted participants to complete contact information following a change in their location; participants reported more contacts when using the paper diary than the PDA device, and they preferred the paper diary, perhaps because it imposed less of a reporting burden.
Retrospective paper-based contact diaries were the recording instrument used by the largest study relevant to respiratory infections conducted so far. The POLYMOD study [Reference Mossong60] recorded single-day contact characteristics of 7290 individuals in eight European countries. This study found strong assortivity of contacts by age – contacts tended to be made between people of a similar age. While the study found some differences in average contact rates between countries, there are remarkable similarities between countries, particularly in the age-based contact rates and the distribution of contacts between social settings, duration and intimacy. Indeed, quantifying age-related mixing patterns using the contact diary method has, perhaps, been the most significant advance to date in this field, helping to explain observed serological and infection patterns [Reference Wallinga, Teunis and Kretzschmar59, Reference Rohani, Zhong and King65–Reference Kretzschmar, Teunis and Pebody68].
There are two primary limitations of the contact diary methodology. First, there are difficult-to-quantify potential biases in participant recall and reporting, particularly for participants who have experienced a complicated day with many different contacts in different environments. Studies that record identifiable contacts can assess these biases to some extent. Read et al. [Reference Read, Eames and Edmunds24] found only 30·2% [95% confidence interval (CI) 25·7–35·0] of any identifiable encounters between participants were recorded by both participants. This recording rate improved when restricted to contacts involving touch (90·2%, 95% CI 83·2–95·0) or non-work settings (84·9%, 95% CI 75·5–91·7). Smieszek et al. [Reference Smieszek63] found a higher level of agreement between pairs of participants (65·0%, 95% CI 61·1–68·8) and also found the agreement rate improved when restricted to physical contacts (78·6%, 95% CI 67·1–87·5), and increased with the duration of reported contact, suggesting that short-lived encounters are those most easily forgotten. Collecting longitudinal information on participants' contacts is also subject to study fatigue: several longitudinal studies have found a decrease in reported contacts with time [Reference Smieszek63, Reference McCaw64, Reference Hens69].
The third limitation is that defining contacts as those that include conversation or touch potentially limits the reported encounters to a subset of all the social encounters that could permit transmission. For example, there are many circumstances where individuals may be close enough to share airspace and pathogens, such as commuters on a crowded train, yet they may not converse or touch. Further, the conversation and touch definitions fail to capture interactions with shared objects that would permit fomite transmission, although appropriate questions could be included within diaries to attempt to capture such information.
Despite these shortcomings, the contact diary method has important advantages over other methods. The instrument is easy to administer and able to collect information retrospectively; it is able to capture social interactions in a wide range of environments and settings; it does not rely on peer-groups of participants. Additionally, it has been able to capture transmission-relevant mixing sufficiently well to explain age-based patterns of infection of varicella zoster virus and parvovirus B19 [Reference Melegaro70], mumps [Reference Wallinga, Teunis and Kretzschmar59] and pertussis [Reference Rohani, Zhong and King65]. The development of the contact diary as an epidemiological instrument is likely to continue.
PROXIMITY SENSORS
The proximity sensing method relies on the use of automated electronic sensors, also called motes or tags, which can measure proximity to or presence within a particular distance of other sensing devices, using radio communication [Reference Weatherall and Jones71, Reference Hui72]. A network of spatial proximity of subjects can be derived from participants carrying devices, and contact between subjects inferred. Devices may be designed to only transmit, in which case static receiving base-stations are required to identify the spatial location of subjects [Reference Isella73–Reference Cattuto76]. Alternatively, devices worn by participants may both transmit and receive signals and therefore may detect the presence of other devices, removing the need for static base-stations [Reference Salathé77]. Contact patterns of individuals may be inferred by either of these approaches.
There are two main types of communication signalling: radio-frequency identification (RFID) and Bluetooth. Both operate in a similar manner, transmitting signals that can be picked up by receiving devices. Radio-frequency tagging has been used in animal ecology but until recently has been little used for disease-relevant studies in humans. Advances in technology mean that very small, highly accurate devices with a long battery life are now available for social network studies. Bespoke devices have shown themselves to be ideal for such studies; being lightweight and compact, and able to record a large amount of data. Bluetooth has promise as an epidemiological instrument, because its use is now widespread in many developed societies, functioning in many portable devices such as mobile phones, wireless headsets, car satellite navigation systems or laptop computers, thus providing a unique opportunity for large-scale social observations [Reference Eagle and Pentland78].
A number of studies have now been conducted using proximity sensors worn by subjects in a different settings, including a conference [Reference Isella73], hospital wards [Reference Isella74], schools [Reference Stehlé75, Reference Salathé77], a public exhibition [Reference Isella73], and several other smaller convenience studies within the academic computer science community [Reference Hui72, Reference Eagle, Pentland and Lazer79–Reference McNett and Voelker82].
Although the objectivity of electronic sensors is appealing compared to contact diaries, a significant disadvantage of proximity sensors is that only interactions between participants can be recorded. This limits their applicability to closed social environments or peer-groups. Another disadvantage of proximity sensors for social encounter studies is that the sensors can potentially record contacts where none may be made in an epidemiological sense (see Fig. 1c). This is a particular problem of Bluetooth technology in commercially available devices such as mobile phones. Bluetooth on these devices has a typical range of 5–10 m and can penetrate glass or walls. The range of custom-made RFID devices can be tuned, or the strength of signal recorded, and careful calibration might overcome the problem seen in mass-produced hardware to some extent. It should also be noted that current sensing technologies are not perfect: reciprocity between electronic sensors, while better than contact diary methods, is not complete in field studies [Reference Salathé77]. Nonetheless, automated objective methods of proximity measurement are clearly preferable to self-reported diary studies for particular circumstances, especially in closed environments where participation rates are high and most encounters can be captured.
INFERRING CONTACT PATTERNS FROM SECONDARY DATA ANALYSIS
We leave many traces of our physical presence in the modern world, at individual and collective levels. Examples include: credit card and mobile phone usage; purchasing habits and patterns; healthcare registration and history; vehicle licensing; employment and education history; security camera recordings; patterns of transport and traffic flow; national censuses of households, schools and workplaces. Some, although by no means all, of these types of information have been used to parameterize models of infection by inferring how often and where people interact. The inference of contact patterns from such diverse and disparate information sources is a justified approach given the absence of better estimates of true social mixing patterns. This type of analysis is now conducted routinely on large datasets, in which the movement and interactions of millions of people and are included. The primary objective of these studies is to assess the efficacy of infection control strategies, such as border quarantine controls or travel restrictions.
Socio-demographic information (population demography, employment data, household and workplace size distributions, etc.) have been used in a number of modelling studies to generate detailed simulations of epidemics [Reference Longini83–Reference Riley and Ferguson86]. These studies generate a ‘synthetic’ population, where individuals are typically assigned membership of virtual households and workplaces or schools. The location and size of the households, schools and workplaces is simulated so as to agree in aggregate with available data. Crucially, these modelling studies are forced to make assumptions regarding the transmission probabilities in different social settings and contacts with other household and workplace members, due to the lack of available information from contact studies at the time.
An alternative approach generates contact networks from location and activity information, most notably the EpiSims model [Reference Eubank87]. Here, specific premises (schools, households, business or leisure centres) and their geographical position, as well as their human capacity, are explicitly depicted in the model. Once these locations are integrated with known travel and activity information of residents entire cities are simulated, person by person, hour by hour, journey by journey. The raw simulations are used to generate detailed contact networks [Reference Eubank87, Reference Del Valle88]. Similar methods have been developed and employed by researchers from the human geography field [Reference Yang and Atkinson89], and by combining with time-use survey information [Reference Zagheni90, Reference Iozzi91]. Two studies have compared contact patterns predicted by synthetic population modelling with observed patterns. The ‘Little Italy’ study [Reference Iozzi91] found a good comparison between the model's age-based mixing patterns and Italian contact patterns measured by the POLYMOD study [Reference Mossong60]. Yang et al. [Reference Yang, Atkinson and Ettema92] predicted a distribution of daily contacts and clustering metrics for a synthetic population, after calibrating the mean number of contacts to lie close to reported values.
The future of these very detailed simulation studies no doubt lies in the robust incorporation of information from contact studies as well as other data, such as mobile telephone location as a proxy for human location [Reference Gonzalez, Hidalgo and Barabasi93].
FUTURE CHALLENGES
The temporal dynamics of contact patterns
It is uncertain how much variation there may in the daily patterns of social contact of individuals as few of the studies described above have measured the social contact patterns of subjects for longer than a single day. Consequently, it is unknown how long a sampling period is required to capture a representative picture of an individual's contact patterns given day-to-day variation and variability in routine by type of day. This sort of information has only been gathered for small convenience samples [Reference Read, Eames and Edmunds24, Reference Fu45, Reference Eames, Read and Edmunds94] (Fig. 2). A related issue is the uncertainty in how contact patterns may change in response to infection or control. It is largely unknown how contact patterns may change due to personal illness, illness of dependants, or authority imposed school or workplace closures, although some recent studies have attempted to quantify some of these behaviours [Reference Eames56, Reference Eames, Tilston and Edmunds57] or inferred them by considering how contact patterns change during holiday periods [Reference Bernard58, Reference Hens69]. Understanding the character and magnitude of behavioural changes has important implications for the way that epidemics should be modelled, and also for estimating the societal impact of the disease itself and the efficacy of non-pharmaceutical interventions to prevent it.

Fig. 2. The daily variation in number of contacts reported by participants in the study by Read et al. [Reference Read, Eames and Edmunds24]. Participants are ranked by their average number of contacts (red crosses); the size of circles denotes the number of days where a participant encounters the same number of contacts. There is much day-to-day variation in participants' reported number of contacts.
Capturing fomite transmission
Fomite transmission, acquiring infection from shared objects such as door handles or telephones, is thought to be a significant route of infection for many respiratory infections yet it is largely ignored when modellers construct contact networks. There is much uncertainly for many respiratory pathogens as to what proportion of infection occurs via a fomite transmission route: it is not known even for a relatively well-researched pathogen like influenza [Reference Boone and Gerba15]. Significantly, for the methodologies outlined above, fomite transmission does not require immediate temporal proximity – an individual exposing themselves to a pathogen on a surface or object may do so later than the infecting individual deposited the organisms. Thus, one challenge is how best to deconstruct measured contacts into those where individuals are present at the same time at a location and those who visit the same location but at different times. Explicit temporal and location information of individuals could generate sufficiently detailed information, combined with sampling of objects, surfaces and the environment for viable pathogen and an exposure or infection outcome would elicit valuable information. There is likely to be strong directionality in the fomite contact network, and the significance of this for infection dynamics is unknown.
How big is the small-world of infection?
In the 1950s and 1960s, the concept that society was a ‘small world’ was developed and attempts were made to measure the degrees of separation or steps between individuals in terms of relationship or influence [Reference de Sola Pool and Kochen47, Reference Travers and Milgram95]. In the experiments, participants were asked to ensure a letter or package was delivered to a particular target individual, unknown to the starting participants, but they could only do this by passing it onto their friends. Although the experiments and the reporting of them were flawed or incomplete [Reference Kleinfeld96], the ‘result’ that the median chain length was six has entered popular consciousness as a measure of higher-scale social connectivity. While the experimental design is clearly not directly relevant to disease transmission, it serves as an elegant example of large-scale structure within populations. Despite higher-order network structure being thought an important characteristic within social theory and networks of influence [Reference Granovetter97, Reference Watts and Strogatz98], and a range of metrics being developed by researchers to quantify such structure [Reference Wasserman and Faust23, Reference Newman99], it has rarely been quantified in representative populations from the perspective of close-contact or respiratory infection transmission.
The topology of network links beyond the first and second degree greatly influences how fast a respiratory infection can spread across a community or nation, and the most appropriate control [Reference Salathé and Jones100]. There is a distinction to be made between social networks of encounters – most relevant to transmission – and social networks of influence and information diffusion, which the sociological literature has focused on. There is likely to be considerable overlap between these two types of network and in certain circumstances, such as a major outbreak with a high degree of social awareness, transmission may be a function of both networks [Reference Funk101]. Control efforts may be maximized by considering both networks [Reference Eames102], although this may be premature given neither network type is well quantified.
The closing of schools, workplaces or public gatherings is often suggested as a control measure for epidemics of respiratory infections. These non-pharmaceutical interventions attempt to force extra steps in the path of an infectious wave-front, and so reduce or halt the progression of transmission within a community. However, social control measures may prove futile if there are alternative paths of contacts of similar or even shorter steps between individuals [Reference Bansal103]. Epidemiology currently lacks a quantified understanding of how these types of social distancing controls operate, and there is little evidence that they work in the way simple simulation models might predict. Retrospective analysis of social distancing policies in past epidemics can help to determine the strength of effect [Reference Bootsma and Ferguson104, Reference Hatchett, Mecher and Lipsitch105], but sheds little light on the mechanism by which social interaction patterns actually changed. The challenge remains: how to measure relevant higher-order network properties of societies, and how they may change in response to infection threats or intervention.
Embedding contact networks into geographical space
As we move from individual or household scales up to the community or population scales, it seems reasonable to presume an interaction between higher-order network properties and geographical space. People are limited in their capacity to interact by a large extent through social convention and culture, and by restrictions on their movement and travel, whether through architecture, town and transport planning or large-scale geographical limitations. Very few studies have measured epidemiologically relevant social-contacts networks and geographical space. Bates et al. [Reference Bates106] found a strong negative correlation between the geographical distance between households and the number of social interactions made between them in rural Ecuador. A study of HIV within the USA [Reference Rothenberg107] measured a social interaction network of sexual encounters and drug use and related this to distance between participants' residences, demonstrating an intriguing relationship and tantalizing clues about how network structure may scale with geography. However, no study has yet provided a reliable estimate on how a social network and its properties important for infection may scale with geographical distance. It may prove possible to infer some higher-scale properties from outbreak data [Reference Caley, Philp and McCracken108]. Moreover, contact-tracing studies may be useful, particularly where genetic distance of infections can help identify transmission pathways.
Linking contact measures with infection risk
The major validation required for all of the methods described above is to directly relate measures of contact to measures of infection. We know of only two studies that attempted to simultaneously measure contact patterns and infection outcome for the same subjects. Group A streptococcus (GAS) infection in children was partly explained by the network structure of observed interactions at daycare [Reference Villaseñor-Sierra, Quinñonez-Alvarado and Caballero-Hoyos36]. The authors measured social connectivity between a group of 3- and 4-year-olds in a daycare centre by asking teachers to provide a categorical assessment of interaction between the children. Several genetically distinct strains of GAS bacteria were isolated from children. Those carrying identical GAS bacteria were more likely to have extensive contact and high levels of within-group social contact than the mean levels across all children. The study provides a rare simultaneous observation of multiple measures of social contacts and infection. However, analysis was limited due to small numbers of children in the study and even fewer who became colonized or infected during the study.
Social connectivity measures at the community level, derived from self-reported food-sharing social contacts, were identified as risk factors for diarrhoeal infection [Reference Bates106]. The mean number of reported social contacts and the mean number of food-sharing contacts at the community level were both associated with risk of acquisition of diarrhoeal infection.
There are numerous studies, based around outbreak investigations using contact tracing, which could be used to link contact measures with infection risk. For example, Rea et al. [Reference Rea4] retrospectively assigned contact intensities to contacts of SARS patients, and found significant differences in estimated attack rates for contact encountered by patients in different social settings and with different levels of contact. Such analysis is reliant on the investigations reporting total contacts (rather than just those who are positively diagnosed), recording some characteristics of the encounters between contacts and patients (such as duration and setting), and having a good understanding of prior immunity within the study population.
There is, however, strong circumstantial evidence that the contact diary approach, with a definition of contact which includes conversational or physical touch encounters, can capture aspects of social interaction important for the transmission of infection [Reference Wallinga, Teunis and Kretzschmar59, Reference Rohani, Zhong and King65, Reference Melegaro70]. These studies have investigated the utility of social contact data in explaining patterns of serological prevalence in a population. Wallinga and colleagues estimated age-specific transmission parameters in models with and without social contact data on the age-specific conversational or physical touch contacts to explain patterns of mumps seroprevalence in a cross-sectional survey collected in The Netherlands [Reference Wallinga, Teunis and Kretzschmar59, Reference Van Druten109]. Models that included social contact data performed better than models that assumed homogeneous or proportionate mixing between age groups. This result is encouraging for the utility of social contact information obtained by surveys. However, the model using this information was compared to relative simple models of mixing. Comparison to models using other age-specific information would help determine the relative utility of the information in this survey to other approaches. Melegaro et al. [Reference Melegaro70] compared multiple measures of social contact in its ability to predict seroprevalence of parvovirus and varicella in multiple European countries. They found evidence that more intimate reported contact (i.e. physical contact, longer duration contact, home contact and frequent contacts) were more useful in fitting the seroprevalence pattern of these two diseases. The consistency of this with biological mechanisms of transmission and the consistent pattern across countries provides clear support of the utility of social contact information obtained from surveys. Rohani et al. [Reference Rohani, Zhong and King65] also used the POLYMOD age-mixing data to model pertussis infection in Sweden during subsequent periods of different immunization policies. They found including the contact data provided a reasonable fit to observed changes in incidence without including assumptions of waning immunity, but did not conduct an extensive comparison to a range of alternative models featuring age-specific assumptions.
Many authors have assumed that infection risk is proportional to the number of contacts that occur [Reference Mossong60, Reference Rohani, Zhong and King65]. However, this is not necessarily the case and methodological challenges remain in linking infection and empirical measures of contact [Reference Smieszek25]. Multiple advances have been made in recent years in linking infection data to mechanistic models of disease [Reference Groendyke, Welch and Hunter110–Reference Ionides, Bretó and King112] and in inferring network structure from egocentric or incomplete network data [Reference Rhodes and Jones113, Reference Potter114]. These advances will help determine what types of contacts are most likely involved in transmission and will guide future empirical study design and the development of analytical methods.
There are a number of important questions for which a mechanistic understanding of the role of contact networks in disease spread would greatly enhance modelling studies and improve control – from contact tracing to the efficacy of school closure and social distancing. What are the appropriate contacts to inform risk? Does the risk of acquiring respiratory infection depend on an individual's number of contacts, or their centrality within the social network? Does infection risk vary within different parts of the network, or by the social settings or location in which contacts occur?
CONCLUSIONS
A fundamental challenge within infectious disease epidemiology is to understand how individuals ‘fit’ together, through their interactions in time and space, to form a contact network upon which respiratory infections spread. A plethora of recent studies have quantified social mixing behaviour for a variety of populations, with a range of different methods including observation, contact diaries and electronic proximity sensors. There is a clear need to continue to quantify social interactions, and to better understand the instruments that capture this information. An improved understanding of social mixing patterns and heterogeneities of behaviour may significantly improve targeted control interventions, and would lead to the development of non-pharmaceutical interventions that minimize transmission while also minimizing social and economic disruption.
Few large-scale studies that can be thought of as representative have been conducted, and little in the way of validation of method against infection risk has been explored. There is still considerable uncertainty as to the most appropriate tool for different research questions and within different social or medical settings. In addition, the diversity of approaches to studying human encounters makes interpreting results difficult. While proximity sensors may relieve the burden of participation that self-reporting diary methods impose, it is not clear how much of the vast amount of information they generate will be useful or how best to interpret such information. To date, no large-scale study has directly compared the social mixing behaviour captured by the range of methods. However, to some extent, a focus on the relative merits of one method of measuring contacts over another is premature. Perhaps the most important challenge is to relate any of the current methods directly to infection risk, for a variety of respiratory pathogens.
ACKNOWLEDGEMENTS
We thank Jon Crowcroft, Ken Eames, Chris Watkins and Eiko Yoneki for stimulating discussion. We also thank three anonymous reviewers for their helpful suggestions. J.M.R. and W.J.E. acknowledge support from the Economic and Social Research Council and the Medical Research council (grant RES-355-25-0019) for funding workshop meetings. J.M.R., S.R., D.A.T.C. and J.L. acknowledge support from the National Institutes of Health (grant 1 R01 TW008246-01). J.M.R. and D.A.T.C. also acknowledge support from the Centers for Disease Control and Prevention (grant number: 1U01CK000179-01).
DECLARATION OF INTEREST
None.


