


Meat is an important food item for human nutrition because it contains 20 to 40 % protein, and also minerals such as iron, zinc and selenium, and vitamins B6 and B12(1). The unsaturated and the conjugated fatty acids from meat may help prevent CVD(Reference McAfee, McSorley and Cuskelly2). However, excessive meat consumption leads to high intakes saturated fat, cholesterol, potentially carcinogenic substances such as heterocyclic amines and polycyclic aromatic hydrocarbons(3) formed during the cooking process, and sodium and nitrite that are added in processed meats. Therefore excessive meat consumption has been linked to chronic diseases(Reference Daniel, Cross and Koebnick4) such as CVD, diabetes(Reference Micha, Wallace and Mozaffarian5), colorectal cancer(3), weight gain and stroke(Reference Cosgrove, Flynn and Kiely6–Reference Vergnaud, Norat and Romaguera8).
Excessive meat consumption has been negatively associated with diet quality in some countries(Reference Cosgrove, Flynn and Kiely6, Reference Okubo, Sasaki and Murakami9). In the USA, meat consumption has been a public health concern since late 1950s, when the American Heart Association released recommendations to prevent CVD(Reference Daniel, Cross and Koebnick4). Today, the World Cancer Research Fund (WCRF) recommends limited consumption (500 g/week) of cooked red meats (beef and pork) and processed meats (cured, salted, smoked or containing chemical preservatives) for cancer prevention(3). The Brazilian Ministry of Health recommends one serving of meat daily (100 g/d) for a healthy diet(1), but there are few studies evaluating meat intake in Brazil.
Livestock production already takes up 30 % of the world's useable land area and causes major impacts on the environment due to: deforestation for livestock grazing; emission of greenhouse gases by animals; water pollution by discharge of organic matter, pathogens, drug residues and antibiotics into lakes, rivers and seas; and loss of biodiversity(Reference Steinfeld, Gerber and Wassenaar10). Cattle-ranching is an important economic activity in Brazil. The country is one of the world's largest beef exporters(Reference Steinfeld, Gerber and Wassenaar10). However, this sector of the economy is the second-largest emitter of greenhouse gases in Brazil, mainly due to enteric fermentation by ruminant herbivores (one of the greatest sources of methane emissions in the country) and also due to handling of animal wastes(11).
Considering the possible deleterious effects of excessive meat consumption on human health and the environment, monitoring the production and consumption of meat is important to promoting healthy eating policies. The aim of the present study was to evaluate red and processed meat intake and also to assess the impact of this consumption on diet quality and the environment.
Experimental methods
Study design and participants
The data come from a cross-sectional population-based survey entitled ‘Health Survey for São Paulo’, conducted in 2003 (ISA-Capital 2003)(12). A two-stage cluster sampling was used: census tracts and households. Census tracts were grouped into three strata based on the percentage of household heads with higher education. More details on sampling are available in Castro et al.(Reference Castro, Barros and Bueno13). In the present study, the final sample comprised 1677 individuals (both males and females): 847 adults and 830 elderly people.
Information about health, food intake and life conditions was collected in a representative sample of residents of the city of São Paulo, Brazil, by a structured questionnaire applied at participants’ homes. This questionnaire concerning demographic (age, gender), socio-economic (family income, education level of the household head) and lifestyle characteristics (smoking, alcohol consumption) was administered by trained interviewers at the participants’ homes.
A follow-up study was completed in 2007 with a second household dietary survey. The final sample comprised 486 individuals (both males and females): 195 adults and 291 elderly people. Loss in the sample was due absence in the house after three attempts, refusal and change of address.
The project was approved by the Ethics Committee of the School of Public Health, University of São Paulo.
Assessment of dietary intake
Dietary assessment consisted of two 24 h dietary recalls (24HR) adapted from Thompson and Byers(Reference Thompson and Byers14). Interviewers were trained on using standard forms for administering the 24HR and received a manual explaining how to fill it out, thus standardizing data collection. Data were collected in 2003 and in 2007 at participants’ households, every day of the month for the period of a year.
The household measures reported were converted into grams and millilitres, according to Pinheiro et al.(Reference Pinheiro, de Lacerda EM and Benzecry15) and Fisberg and Villar(Reference Fisberg and Villar16). Recipes were broken down into ingredients to estimate the amount of meat in each preparation.
Data from the 24HR were entered into the Nutrition Data System for Research program version 5·0 (2007) developed by the Nutrition Coordinating Center, University of Minnesota (Minneapolis, MN, USA) and were converted to energy and nutrients (total fat, saturated fat, dietary fibre and vitamin C).
Definition of red and processed meat intake
The variable ‘red and processed meat’ was calculated using the sum of red meat (beef and pork) and processed meat (cured, salted, smoked or containing chemical preservatives).
The Multiple Source Method (MSM), a statistical modelling technique, was used to estimate the usual dietary intake of red and processed meat. This technique uses two 24HR and a probability of consumption(Reference Haubrock, Nöthlings and Volatier17, Reference Harttig, Haubrock and Knüppel18). The MSM calculates dietary intake for individuals first and then constructs the population distribution based on the individual data. Age group and date of interview were included as covariates of the model. All participants were considered daily meat consumers in MSM, because meat, especially red and processed meat, is consumed by almost all of São Paulo's population according to previous data(Reference Fisberg, Morimoto and Slater19, Reference Previdelli, Lipi and Castro20).
The WCRF maximum recommended intake of red and processed meat of 500 g/week, corresponding to an average of 71·4 g/d, was the cut-off point to estimate excessive red and processed meat intake(3).
Diet quality
To investigate the relationship between meat consumption and diet quality, we used the Brazilian Healthy Eating Index Revised (BHEI-R)(Reference Previdelli, Andrade and Pires21). The BHEI-R evaluates a combination of different types of foods, nutrients and other components of the diet according to current dietary recommendations, especially the Brazilian Dietary Guidelines(1). The BHEI-R is similar to the Healthy Eating Index-2005(Reference Guenther, Reedy and Krebs-Smith22) and comprises twelve components: nine are food groups expressed in terms of energy density (per 4174 kJ/1000 kcal: ‘total fruits’, ‘whole fruits’, ‘total vegetables’, ‘dark green and orange vegetables and legumes’, ‘total grains’, ‘whole grains’, ‘milk and dairy’, ‘meat, eggs and legumes’, ‘oils’); two are nutrients (sodium and saturated fat); and the other is energy from solid fat, added sugars and alcohol (SoFAA). The maximum score for the first six components is 5, for the next five components is 10 and for the last component is 20. Intermediate scores are calculated proportionately. Thus, the final score of the BHEI-R ranges from zero to 100. The following components were analysed: SoFAA, total vegetables, whole fruits, whole grains, and milk and dairy.
Environmental impact
To evaluate the environmental impact caused by meat consumption, we estimated the amount of red and processed meat consumed by the population of São Paulo in 2003 (10 615 844 people)(23). Then, we estimated greenhouse gas emissions from total meat consumption, knowing that the production of 1 kg of Brazilian beef generates about 44 kg of CO2 equivalents(Reference Cedeberg, Persson and Neovius24). There is no available information on the carbon footprint of pig and processed meat production in Brazil, so we used red and processed meat intake from beef production as proxy.
Statistical analyses
Mean values, 95 % confidence intervals and proportions of participants who consumed red and processed meat were calculated considering the predicted usual intake distribution by MSM, adjusted by age group and year of interview, separated by sex.
Differences between means and proportions were analysed using the lincom test, which calculates point estimates using the t statistic and considers the weights from complex samples(Reference Rizzo, Moser and Waldron25).
The association between energy intake, nutrient intakes and selected BHEI-R scores according to categories of red and processed meat consumption (moderate intake; high intake) was investigated by ANOVA.
For all analyses, the STATA statistical software package version 10 (2007) was used and P < 0·05 was considered statistically significant.
Results
Daily per capita consumption of red and processed meat was 106 g; 138 g for men and 81 g for women. Daily consumption of pork was 8 g, of beef was 73 g and of processed meat was 25 g (data not shown).
The average daily red and processed meat intake according to socio-economic, demographic and lifestyle variables is shown in Table 1.
Table 1 Usual red and processed meat intake (g/d) according to sex and socio-economic variables: Brazilian adults (n 1677) aged ≥19 years, São Paulo, 2003
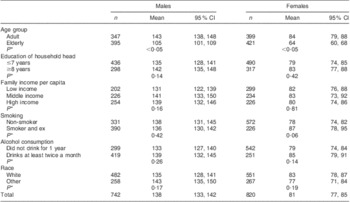
*P value for F statistic (lincom test).
The proportion of participants with high red and processed meat intake was 81 % of men and 58 % of women (Table 2). There were no significant differences according to the characteristics analysed, except that adult females had a higher proportion of high consumers than elderly women (P < 0·05; Table 2).
Table 2 Proportion (%) of individuals with high daily red and processed meat intake according to sex and socio-economic variables: Brazilian adults (n 1677) aged ≥19 years, São Paulo, 2003
*P value for F statistic (lincom test).
We also found that those who had high red and processed meat intake had higher intakes of energy, total and saturated fat, in both sexes (all P < 0·01). For men and women who consumed meat in excess, energy intake was respectively 1·4 times and 1·3 times higher; total fat intake was respectively 1·7 times and 1·5 times higher; and saturated fat intake was respectively 2·0 times and 1·6 times higher, compared with those who had moderate intake. Consumption of vitamin C and dietary fibre were not different among the groups (Table 3).
Table 3 Average daily energy and nutrient intakes and diet quality according to level of red and processed meat consumption and sex: Brazilian adults (n 1677) aged ≥19 years, São Paulo, 2003
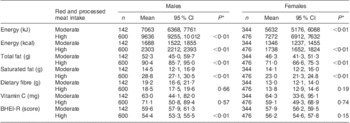
BHEI-R, Brazilian Healthy Eating Index Revised.
*P value for F statistic (lincom test).
When we evaluated the BHEI-R score, it was significantly lower (P < 0·01) among males who had high intake of red and processed meat; that is, diet quality was inversely associated with excessive meat consumption among men (Table 3).
Scoring for SoFAA was significantly lower in men (P < 0·01) and women (P < 0·05) with high red and processed meat intake, showing that these individuals consumed more solid fat, added sugars and alcohol than the other participants. High consumption of red and processed meat was also negatively related to milk and dairy and positively related to total vegetables in women (both P < 0·01). Total fruit and whole grains did not show statistical difference among groups (Table 4).
Table 4 BHEI-R components and overall BHEI-R score according to level of red and processed meat intake and sex: Brazilian adults (n 1677) aged ≥19 years, São Paulo, 2003

BHEI-R, Brazilian Healthy Eating Index Revised; SoFAA, energy from solid fat, added sugars and alcohol.
*P values for F statistic (lincom test).
The estimated amount of red and processed meat consumed by the population of São Paulo, in 2003, was about 410 727 tonnes. The production of this amount of meat released 18 071 988 tonnes of CO2 equivalents into the environment, which represents 4·1 % of the total CO2 emitted by agriculture in Brazil in 2003.
Discussion
The present study is one of the few representative surveys that estimate meat consumption in Brazil. The results show that meat is consumed almost universally in the city of São Paulo.
We observed that average meat intake exceeded the maximum intake limit recommended by the WCRF(3) by 1·9 and 1·1 times for men and women, respectively. Similar results were observed elsewhere. In the UK, daily average consumption of red and processed meat is 78 g and 47 g for men and women, respectively; in Ireland, 94 g for men and 58 g for women; in Spain, 127 g for men and 68 g for women(Reference McAfee, McSorley and Cuskelly2); and in the USA, 116 g for men and 71 g for women(Reference Daniel, Cross and Koebnick4). What draws attention in our study is that meat consumption in São Paulo was even greater than in the USA, the world's largest beef consumer(Reference Daniel, Cross and Koebnick4).
Excessive consumption of red and processed meat is not considered healthy. It is known that processed meat intake of only 50 g/d is associated with 42 % increased risk of CVD and 19 % increased risk of diabetes(Reference Micha, Wallace and Mozaffarian5), and there is convincing evidence that meat increases the risk of colorectal cancer(3).
In our study, excessive meat intake was related to poor diet quality in men, showing that meat consumption had a negative effect on the diet quality. It was also associated with higher energy intake from fats, added sugars and alcohol, and lower intake of milk and dairy in women. In Ireland, high processed meat consumption was also associated with lower intakes of wholegrain breads, fruits, vegetables and fish, and higher soft drinks consumption, when compared with no or little meat consumption(Reference Cosgrove, Flynn and Kiely6). In Japanese women, the ratio of fish to meat intake was positively associated with fruits, vegetables, milk and alcohol intakes, and negatively associated with soft drinks, fat and oil intakes, showing that those who consume less red meat have a healthier dietary pattern(Reference Okubo, Sasaki and Murakami9).
In the present study, excessive meat consumption was also associated with higher energy, total fat and saturated fat intakes; this might increase the risk of CVD and of being overweight, which are prevalent and high-costing diseases. In Brazil, the prevalence of overweight in adults is high, nearly 50 %(26). In São Paulo, the latest figures released show that 44 % of adults are overweight(27). In an European cohort study of more than 350 000 adults, a positive association between meat consumption and weight gain was noticed, even after adjustment for energy, dietary patterns, smoking and BMI(Reference Vergnaud, Norat and Romaguera8).
In addition to these health effects, meat production causes large impacts on the environment due to deforestation for livestock grazing, emission of greenhouse gases by animals, water pollution and biodiversity loss(Reference McMichael, Powles and Butler28). We estimated that production of the amount of meat consumed in São Paulo in 2003 accounted for about 4 % of the total greenhouse gases emitted by Brazilian agriculture that year(29).
If a car travelled between Brazil and Canada (9673 km), it would emit the same quantity of CO2 as was released to supply the meat intake of one person in one year in São Paulo(Reference Carlsson-Kanyama and González30). Greenhouse gas emissions would have been almost 50 % lower if meat consumption had not exceeded the maximum recommended by WCRF (71·4 g/d) in São Paulo.
Promoting dietary changes towards healthy eating is a challenging task, because the process of food choice is complex and driven by features beyond our knowledge, such as cultural, environmental and economic. Although meat is associated with increased risk of chronic diseases and is an expensive food item with complicated food market distribution logistics, it is highly consumed. On the other hand, intake of fruits and vegetables is very low despite their well-known beneficial effects of consumption(Reference Bigio, Verly Junior and Castro31). This might illustrate how a food item is valued by the population in spite of its nutritional composition(Reference Bazzano32). This can happen because meat, especially red meat, has cultural value. It is desired by people from different cultures and of varying degrees of economic development(Reference Swatland33), making it especially attractive for consumption.
For successfully promoting healthy eating, a multidisciplinary approach needs to be taken. Our results add evidence that public policies should focus on encouraging lower red and processed meat consumption in this population, so intake would be within the recommended range, therefore reducing the risk of chronic diseases and preventing environmental degradation.
Limitations
The ISA-Capital 2003 is a cross-sectional study in which we cannot determine causality of events, but by using a probability sample and being a population-based study, results can be extrapolated to the total population of São Paulo. The use of two 24HR allowed estimation of usual food intake but the period between assessment surveys (2003–2007) can be considered large, so one could argue that changes over time could lead to differential changes in eating patterns, as well as in within- and between-person variation. However, it is known that any adjustment gives less biased results than not adjusting distributions(Reference Daniel, Cross and Koebnick4, Reference Beaton, Milner and Corey34, Reference Jahns, Arab and Carriquiry35).
Conclusion
The excessive meat intake, associated with poorer diet quality observed, support initiatives and policies advising to reduce red and processed meat intake to within recommended amounts, as part of a healthy and environmentally sustainable diet.
Acknowledgements
Sources of funding: This research was supported by the Research Support Foundation of São Paulo, the National Council of Technological and Scientific Development and the Department of Health of São Paulo. Conflicts of interest: There are no conflicts of interest to declare. Authors’ contributions: A.M.C. carried out the study and data analyses and drafted the manuscript. C.L.G.C. conceived of the study and participated in its design and coordination. R.M.F. participated in the design of the study and data analyses. D.M.L.M. conceived of the study, participated in its design and coordination and helped to draft the manuscript. All authors read and approved the final manuscript. Acknowledgements: The authors are grateful to the funding bodies for the financial support that enabled development of this study.


