


INTRODUCTION
Campylobacteriosis is New Zealand's most commonly reported notifiable infectious disease [1], a situation that is repeated in many other countries [Reference Gormley2]. The many possible transmission routes from Campylobacter reservoirs to humans have made precise quantitative investigations into its complex epidemiology difficult [Reference French3–Reference Wilson8]. This situation may suggest that localized risk factors strongly influence Campylobacter transmission. In addition, the number of cases varies significantly throughout the year with much higher case rates during the summer. The reasons for this seasonality are not known [Reference Kovats9], although a number of potential drivers have been proposed including: increased shedding in animal reservoirs and higher levels of contamination in the food chain [Reference van Asselt10–Reference Jore13], changes in human behaviour [Reference Carrique-Mas14] and the abundance of invertebrate vectors [Reference Ekdahl, Normann and Andersson15, Reference Nichols16]. A greater understanding of the seasonal drivers for infection may help to shed more light on the epidemiological pathways. This leads us to study temporal as well as spatial patterns.
There are several risk factors that are known to be associated with Campylobacter notifications, and many of these are temporally and spatially structured. Social deprivation is a risk factor for many infectious diseases, however a UK study has indicated that campylobacteriosis notifications are higher among those with higher socioeconomic status [Reference Gillespie17], suggesting that social deprivation may be a protective factor. Alternatively social deprivation may affect willingness to access healthcare, and therefore the proportion of cases that reach notification. Gender is also considered as a risk factor for campylobacteriosis, with males in general having a higher notification rate than females [Reference Sneyd and Baker18, Reference Baker, Sneyd and Wilson19]. Based on data from 2001–2004, Baker et al. [Reference Baker, Sneyd and Wilson19] also showed that significantly higher rates of notification and hospitalization were seen in urban populations compared to rural populations. However, when children and adults were treated separately, children aged <15 years in rural areas were reported at significantly higher rates than their urban counterparts. A recent Scottish study also found higher notification rates in rural children [Reference Bessell20].
Campylobacteriosis case rates are highly seasonal, although there is large variation between years in the timing, duration and magnitude of peak incidence. Baker et al. [Reference Baker, Sneyd and Wilson19] examined notification and hospitalization rates from 2001 to 2003 and found that the highest rates occurred during the summer months. However, increased notifications during early winter have also been observed in New Zealand [Reference Williman, Cressey and Pirie21], in particular in winter 2006 where a national epidemic occurred [Reference McTavish22]. The majority of cases in New Zealand are considered to be sporadic [Reference Wilson23]; however, there are also brief localized outbreaks in which cases share a common exposure [Reference Spencer24]. Several studies have already attempted to analyse the way in which weather affects campylobacteriosis case rates in various locations, particularly with reference to the underlying causes of seasonality [Reference Kovats9, Reference Bi25, Reference Hearnden26]. It is already clear from the literature that spatial location affects the way in which weather relates to notifications. This is to be expected if different epidemiological pathways are more prominent in different locations, and each pathway will be affected by the weather differently. Ambient temperature in particular is often suggested to affect infection rates [Reference Kovats9, Reference Bi25, Reference White27].
As campylobacteriosis is a notifiable disease in New Zealand, a large amount of information is routinely collected from reported cases by the public health services, including the home address. This information is entered into a centralized database called EpiSurv which is managed by the Institute of Environmental Science and Research (ESR). Summary statistics from this large dataset are carefully monitored, with spatial analysis routinely published at the district health board (DHB) level. This study aims to investigate the spatial and temporal epidemiology of campylobacteriosis at a much greater spatial resolution. Three regions of New Zealand with diverse geography and climate are used to account for different levels of rurality. These regions are Auckland (urban), Canterbury (mixed) and Manawatu (rural). We aimed for the spatial and temporal resolution of the data to be as fine as possible in order to ensure that any highly localized associations could be uncovered.
In its 2005 Campylobacter strategy, the New Zealand Food Safety Authority (NZFSA) set up the Manawatu region as a ‘sentinel surveillance site’ for campylobacteriosis [Reference Mullner5, Reference Mullner6]. The purpose of this was to combine molecular epidemiology and intensive surveillance to uncover the reservoirs behind the majority of notified cases, and to measure the effectiveness of control measures in the poultry industry implemented between 2005 and 2008. As a consequence of this study there are extremely high completion rates for the epidemiological information in the Manawatu region. This has enhanced the analysis of additional covariate information about the cases, e.g. their gender and age group in this region.
The Methods, Results and Discussion sections of this paper share a common structure: first the spatial and temporal distributions are considered. In particular, we investigated the association between the spatial variation in risk and social deprivation. For rural areas we sought to uncover spatial associations between farm animal density and risk of notification. For the Manawatu region, we had some additional demographic information about the cases and therefore were able to examine differences in notification rates between age groups and genders. Finally we compared the large seasonal variations in notification rates with local weather data.
METHODS
This work examines notification data from three regions of New Zealand, each with slightly different geography and climate: Auckland, Canterbury and Manawatu. The spatial location of a notification is given at the meshblock level: the smallest regions defined for the New Zealand census, each containing between zero and about 200 individuals in their usually resident population. Meshblocks therefore vary in size with those in urban areas giving a more precise spatial location than those in rural areas. The urban/rural status of the meshblocks is classified according to the seven grades of rurality given by Statistics New Zealand [28]. For this study the four most rural grades (up to ‘Rural with high urban influence’) were classed as rural and the remaining three grades (from ‘Independent urban areas’) were classed as urban.
The Auckland, Canterbury and Manawatu regions are made up of 9709, 4313 and 1834 meshblocks, respectively, and have usually resident populations (obtained from the 2006 New Zealand census) of 1 310 529, 466 344 and 158 808, respectively, representing 48% of the country's population. The notification data came from the 6-year period 2001–2006 for Auckland and Canterbury and the 7-year period 2001–2007 for Manawatu. This period was studied because nationally there was a steady increase in notifications which peaked in 2006 [1]. Some cases had to be omitted from the study as the residential address in the database did not give rise to an accurate spatial location (see Table 1). For cases in the Manawatu region we obtained additional epidemiological data from the EpiSurv database, including gender, age group, occupation and information concerning exposure to some specific risk factors.
Table 1. Number of campylobacteriosis notifications, stratified by region and address matching accuracy from 2001 to 2006 (includes 2007 for Manawatu)

In New Zealand all primary-care consultations are partially funded by DHBs with most patients paying an additional co-payment, especially for ‘out-of-hours’ attendances. Microbiological investigations in primary care are fully funded. In 2005–2007, for each notified case of acute gastrointestinal illness in New Zealand there were an estimated 222 cases in the community, of which about 49 visited a general practitioner (GP) [Reference Lake29].
The covariate data for potential risk factors included the Social Deprivation Index (SDI), weather information, proximity to large poultry farms and livestock densities. The SDI was calculated at the meshblock level from the 2006 census, and proved to be a key risk factor in urban areas. In rural areas proximity to high livestock densities such as dairy cattle was also a risk factor. Data on farm locations and sizes was taken from the AgriBase™ database (a product of AsureQuality, New Zealand) from January 2006. Weather data from weather stations throughout each region were taken from the National Institute of Water and Atmospheric Research (NIWA), such as hours of sunshine, maximum and minimum temperature, rainfall and storm water run-off. There were 16 weather stations used for Manawatu, 46 for Auckland and 33 for Canterbury, although not all of these have readings available for all variables considered. All spatial and temporal data were interpolated or aggregated to the meshblock and week level to facilitate comparison with the notification data.
Spatial and temporal distributions
Campylobacteriosis notification data displays both large spatial variation, and complex temporal patterns. In summer there is an increase in notifications; however, the size, duration and timing of this peak vary from year to year. There can also be winter epidemics, like the one observed in 2006 [Reference McTavish22], and sharp localized spikes in notifications with a shared exposure. In the present study a Bayesian hierarchical model is used in an attempt to capture these spatial and temporal variations in infection risk and overcome some of the difficulties inherent in modelling such complex datasets [Reference Mullner5, Reference Diggle, Brookmeyer and Stroup30].
The number of notified cases of campylobacteriosis Y i,t in meshblock i and week t is assumed to have a Poisson distribution with mean N i λ i,t , where N i is the usually resident population of meshblock i and λ i,t represents the expected risk at this point in time and space. A Poisson distribution was used rather than a negative binomial due to the fine spatial scale – there were not enough observations with multiple cases to accurately estimate an overdispersion parameter. Next, we separated the risk into its spatial and temporal components through the relation log(λ i,t )=R t +U i , where R t and U i are the purely temporal and purely spatial components of the risk respectively, so that the expected number of cases in meshblock i and week t is given by N i exp(R t +U i ). For the spatial component a Gaussian Markov Random field prior is assumed [Reference Besag, York and Mollié31] (also called a Gaussian intrinsic autoregression) in which the risk in each meshblock is assumed to be similar to the mean risk of the neighbouring meshblocks. More formally, we assumed the following full conditional distribution

where n(i) is the set of indices of meshblocks neighbouring meshblock i.
For the temporal component we assumed a Gaussian second-order random walk prior [Reference Knorr-Held and Richardson32]. This assumes that the change in risk from week t to week t+1 will be similar to the change in risk from week t−1 to week t, i.e. given R 1, …, R t ,
We assumed flat priors for R 1 and R 2 so that the temporal component can absorb the baseline level of risk. For the hyperparameters κ R and κ U we assumed conjugate gamma-distributed priors. For more information about the prior specifications and the implementation of an MCMC algorithm to estimate the posterior distribution, see the Appendix.
Social deprivation
In order to assess any associations between social deprivation and campylobacteriosis notifications we first compared maps of the estimated spatial component with maps of social deprivation, given by the SDI. The SDI is an area-based measure of deprivation derived from variables in the five-yearly New Zealand Census of Population and Dwellings [Reference Salmond33]. It is calculated at the meshblock level and the scores are grouped into deciles taking integer values between 1 (least deprived) and 10 (most deprived).
The observed associations between SDI and notifications can then be quantified by modifying the model described in the ‘Spatial and temporal distributions’ section. Because the spatial component and the SDI are so highly correlated, models which include both appear not to be identifiable. We therefore removed the spatial component from the model and replaced it with a fixed effect for each of the 10 levels of deprivation. The linear predictor becomes log(λ i,t )=R t +V D(i), where D(i) is the social deprivation index decile score of meshblock i. For the fixed effects V 1, …, V 10, we assumed a Gaussian first-order random walk prior as we believed the risk for one level of SDI will be similar to the risk for adjacent values of SDI. More precisely given V 1, …, V j ,
with a gamma-distributed hyperprior κ V ~Gamma (1, 10−4). This model allows nonlinear trends in the association between SDI and notification risk to be visible in the posterior distribution.
Livestock density
In rural areas the epidemiology of campylobacteriosis is different to urban areas and one reason for this might be that environmental exposures, e.g. direct contact with animals and their faeces, are more prominent routes of transmission [Reference Baker, Sneyd and Wilson19]. We investigated the association between animal density, SDI and campylobacteriosis notifications in rural meshblocks for the following stock types: poultry, dairy cattle, beef cattle and sheep. From the AgriBase database we extracted the number of each stock type for each farm and a map of the land each farm occupies. By overlaying the meshblock boundaries on this map and assuming that the animals were evenly spaced throughout each farm, we estimated the number of animals in each meshblock. We then divided the number of animals in each meshblock by the meshblock area to produce an estimate of the density of each stock type, in animals per hectare. In addition, we crudely estimated the proximity of a meshblock to a large poultry farm (>1000 birds), by the connectedness of each meshblock to a meshblock containing a poultry farm. For example, meshblocks containing large poultry farms were given distance zero, and their neighbours distance 1, and so on. This measure of distance was preferred to Euclidean distance to the meshblock centroid because in rural areas some of the meshblocks are very large, and so part of the meshblock could be very close to a farm; however, the distance to the centroid would still be large. All of these variables are spatially varying and assumed to be approximately constant for the duration of the study.
We wished to uncover which of these variables influenced the spatial variations in notification risk. Therefore rather than fitting a spatial model like the one described in the ‘Spatial and temporal distributions’ section, a multiple Poisson regression model with log link function was fitted using the generalized linear model function (fitglm) in R version 2.5.1 (R Development Core Team, Austria). The number of cases in each rural meshblock was taken as the response variable, the population in the meshblock was used as an offset and the variables SDI, poultry farm distance and the animal density variables were used as predictors. A backward stepwise regression procedure was then followed to eliminate variables with a P value >0·15. Since only rural areas were used in this analysis, the number of meshblocks is reduced to 519 for Manawatu, 785 for Canterbury and 567 for Auckland.
Age and gender
For the Manawatu region we extracted some additional information about the notifications from the EpiSurv database, including the gender and age group of each case. Denominator information for these variables was obtained from the 2006 census [34]. The spatial distributions of each age group and gender were explored using the Bayesian hierarchical model described in the ‘Spatial and temporal distributions’ section. Some age groups experienced very few cases and the sparseness of the data caused problems with the convergence of the MCMC. In order to overcome this, some of the age categories were pooled; a more informative prior for the hyperparameter was used [κ U ~Gamma(1·5, 0·15)] and the Markov chains were run for longer.
Weather
To investigate the drivers of the seasonal variation in notifications, we took a less sophisticated and more direct approach than elsewhere in the literature by jointly plotting the time-series of reported cases and the weather data. This enabled us to visually compare any periodic patterns in both of the time-series. This method has the advantage that none of the information in a complex trend is lost through the use of summary statistics, e.g. the time of peak notifications.
The weather data consisted of daily maximum temperature, minimum temperature, rainfall, water run-off and hours of sunshine. These data were taken from as many weather stations as possible spread throughout (and just outside) each of the regions being investigated. The spatial dimension was removed by taking the mean over all of the weather stations that recorded observations for a day. These daily means were then averaged to provide a weekly mean. In order to make the weather datasets easier to compare to the weekly case-series, we first centred both series by subtracting the mean and normalized them by dividing by the standard deviation. Finally we applied some simple smoothing by replacing the observation at time t with the mean of any observations between t−3 and t+3.
RESULTS
Spatial and temporal distributions
Figure 1 shows the relative risks generated by the spatial component of the model for each of the three regions. In the Manawatu region most rural areas had a lower risk of notification with the exception of the town of Foxton (population 4446) and the area surrounding the town of Sanson (population 492). There was a large variation in risk in the largest settlement in the region, the city of Palmerston North (population 67 000). The Canterbury and Auckland regions also showed surprisingly sharp changes in risk over small distances in their main centres. The white circle enclosing a part of Christchurch central business district (Fig. 1), had an extremely high rate of notifications. Of the three regions, Canterbury showed the greatest spatial variation in risk with several high-risk areas outside Christchurch. South Auckland contained a very low-risk area containing a large number of meshblocks. In the Auckland region many of the high risk meshblocks were located on the coast.
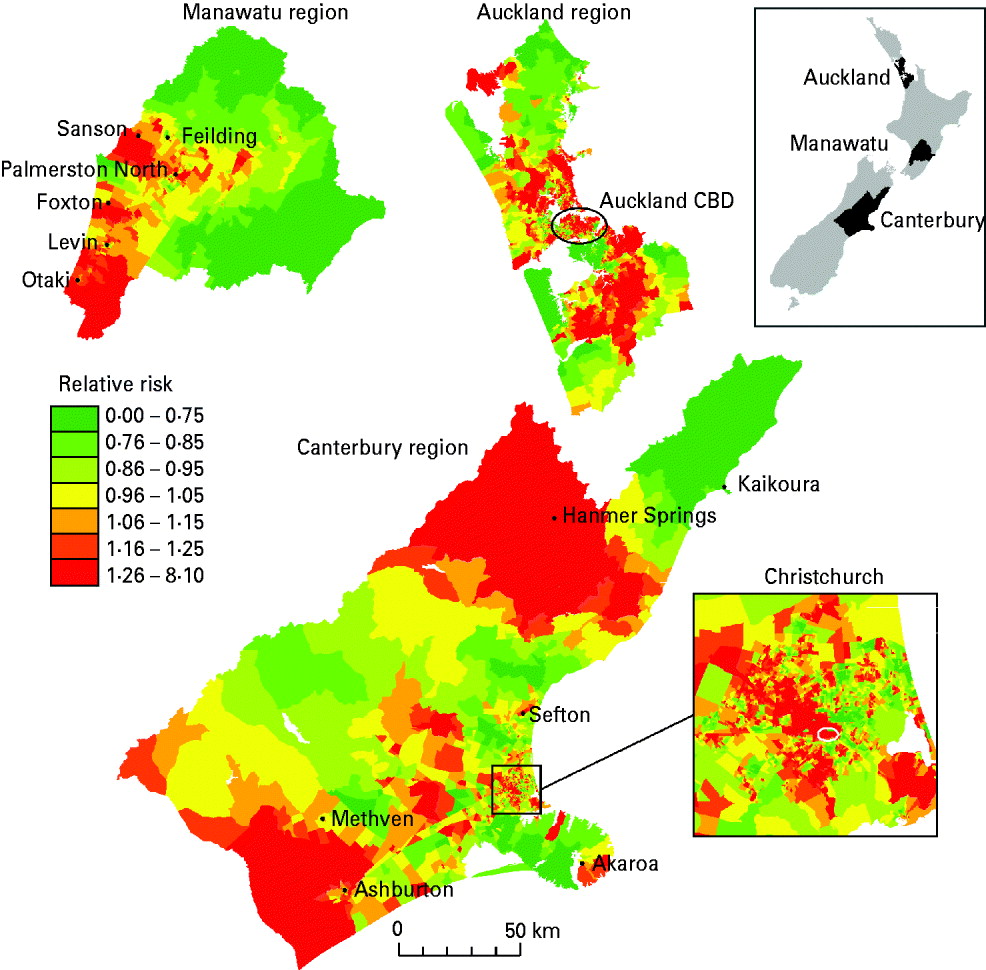
Fig. 1. The estimated relative risk surface for campylobacteriosis notification in the Manawatu, Canterbury and Auckland regions. The white circle in the inset of the Canterbury region indicates a region of extremely high risk of notification.
Figure 2 shows the expected number of campylobacteriosis notifications per 1000 people per week for each of the regions. There were large changes in the number of cases predicted at different times of the year; however, there was no consistent form to this seasonal pattern. Again, Canterbury region had the largest variations in risk and the Manawatu region clearly had a lower risk of notification per capita. The winter epidemic in 2006 can be identified, particularly in the Canterbury and Auckland regions.
Fig. 2. The expected number of campylobacteriosis notifications per week per 1000 people for the Manawatu, Canterbury and Auckland regions. The grey band highlights the winter epidemic in 2006.
Social deprivation
Previous evidence [Reference Baker, Sneyd and Wilson19] and preliminary analysis suggest that urban and rural areas have different epidemiology and transmission pathways for campylobacteriosis and therefore different notification patterns. For example in the Canterbury and Auckland regions, a χ2 test showed significantly higher notification rates for urban meshblocks compared to rural meshblocks (P=0·006 for Canterbury, P<0·0001 for Auckland).
Figure 1 suggests that in urban areas the risk of notification was strongly related to the SDI. In rural areas this pattern was not repeated – the associations with rural Campylobacter infections are explored in the next section. This, along with other evidence [Reference Mullner5, Reference Baker, Sneyd and Wilson19, Reference Bessell20], suggests that there are large differences in the epidemiology of urban and rural campylobacteriosis notifications. In order to quantify the relationship between SDI and campylobacteriosis notifications in urban areas, we replaced the spatial component in the model with a fixed effect for each of the ten decile values of the SDI.
Figure 3 shows the posterior mean relative risks for each decile value of SDI for all three regions, with the shaded bands indicating 95% credible intervals. There was decreased risk in deprived areas, particularly for indices 8, 9 and 10. The Auckland region showed the strongest trend, possibly because this region contains the most urban meshblocks that are completely free of any rural influences.

Fig. 3. Posterior relative campylobacteriosis notification risk for urban meshblocks against Social Deprivation Index (SDI). The shaded bands show 95% credible intervals.
Livestock density in rural areas
Table 2 shows the relative risks and P values for each variable that was not eliminated from the regression model in each of the three regions of New Zealand. The variables beef cattle density and poultry density were eliminated from all models. Only the SDI was informative for the Auckland rural meshblocks. This suggests that rural meshblocks in the Auckland region have a different epidemiology to those in the Manawatu and Canterbury regions.
Table 2. Relative risks for a unit increase in variable, with P values in parentheses, for each of the predictor variables from the final multiple Poisson regression model after the stepwise elimination of non-informative variables by study region
* Variables eliminated from all models: beef cattle density, poultry density. Animal densities are measured in number of animals per hectare. Social Deprivation Index ranges from 1 (least deprived) to 10 (most deprived). Poultry farm distance is given by the connectedness to a meshblock containing a large poultry farm (>1000 birds), so meshblocks containing poultry farms have distance 0, neighbouring meshblocks distance 1, etc.
Age and gender
In the Manawatu region we obtained additional data for each case, including gender and age group. Table 3 shows the annual case rates per 1000 people in the Manawatu region for each gender.
Table 3. Campylobacteriosis notification rates per 1000 people subdivided by age group and gender for the Manawatu region for 2001–2007
For both males and females, the rate for the 0–4 years age group is twice as high as almost all other age groups. Observing the estimated spatial distribution of cases for this age group (Fig. 4), it can be seen that these cases are much more likely to reside in rural areas. However, in the next age group (5–14 years), this trend is reversed with most of the cases occurring in urban Palmerston North. In all of the spatial distributions for older age groups (data not shown) the risk surfaces are much smoother (less varied) with greater risk of notification in urban areas.

Fig. 4. Relative risk of campylobacteriosis notification in the Manawatu region for (a) 0- to 4-year-olds and (b) 5- to 14-year-olds.
Significantly more notifications are reported for males than females (P<0·0001 for χ2 test). The spatial distributions are similar, but the male notification risk is slightly more rural with a cluster around the town of Foxton.
Weather
Figure 5 shows the centred, normalized and smoothed time-series of campylobacteriosis notifications, mean maximum temperature and mean hours of sunshine. The figures suggest that the peak in notifications occurs before the peak in temperature, with the peak in hours of sunshine usually located in between the notification peak and the temperature peak. In particular the six annual minimums and five annual maximums in the cases' curve appear on average 6·5, 4·1 and 11·6 weeks before their counterparts in the temperature curve, and 2·8, 1·8 and 8·5 weeks before their counterparts in the hours of sunshine curve; for the Manawatu, Canterbury and Auckland regions, respectively.
Fig. 5. Centred, normalized and smoothed time-series of campylobacteriosis notifications, mean maximum temperature and mean hours of sunshine for (a) Manawatu, (b) Canterbury and (c) Auckland.
DISCUSSION
Spatial and temporal distributions
The estimated spatial components for all three regions show large variations in notification rates. There are some interesting anomalies that may have epidemiological explanations, e.g. occupational exposures associated with a poultry processing plant may be responsible for at least some of the increase in risk in the southwest of the Manawatu region in Figure 1. Moreover, the reduced risk of notification in very rural areas may be caused by reduced access to healthcare facilities, rather than a reduced number of cases. Features like these confirm that the epidemiology of campylobacteriosis is highly localized and reinforce the need for a fine-scale spatial analysis. Boundary effects and other spatial variations in reporting practices are a known drawback of such analyses [Reference Bessell20], and there are several boundaries in the regions. The Auckland region is made up of three DHBs; however, there is one public health service for all three DHBs and notifications are managed centrally. This may explain why there are no noticeable changes in risk across the boundaries. Although the Manawatu region consists of a single DHB, the very south of the map is investigated by a different public health service, which may explain the difference in notification risk near the town of Otaki. Practices for referral of patients for laboratory testing and the methods used for testing faecal specimens differ between geographical areas in New Zealand [Reference Nicol35]. Referral and reporting practices are also likely to differ between other notifiers, e.g. GPs and hospital clinicians.
Rind & Pierce [Reference Rind and Pearce36] discuss the large-scale spatial and temporal trends in campylobacteriosis notifications in New Zealand over a similar period to the present study (see also [Reference Nelson37]). Although many of their findings support known hypotheses and the fine-scale spatial analysis presented here (e.g. lower risk associated with social deprivation) their attempts to discuss the changes in the spatial distribution of notifications over time ignore any changes in the size and distribution of the underlying population. Specifically, New Zealand's total population increased by 7·8% in the 5 years between the 2001 and 2006 censuses. Our study also assumes that the underlying population remains relatively constant during the study period, and for this reason we have avoided any discussion of the determinants of overall temporal and spatio-temporal trends in case notification rates.
The graph of the posterior mean of the temporal component in Figure 2 reveals some interesting patterns. The summer peaks can be seen to be irregular in height, duration and timing. Canterbury has the most seasonal variation with severe but short epidemics in the summer. Auckland is the most northerly region, and therefore has longer summer seasons and shorter winters, with notifications appearing to come in short bursts during the summer. The Manawatu region has a much lower notification rate than the other two regions. Figure 2 also shows an increase in the number of winter cases over time in all regions, culminating in the winter epidemic of 2006 [Reference McTavish22] and eclipsing the peak observed in 2003 [Reference Rind and Pearce36]. A winter peak was not observed in a UK study [Reference Gabriel38] where a spectral analysis revealed that the second most significant oscillation (after the annual cycle) had a 4-month period. The larger variation between summer and winter notification rates observed in Canterbury may be due to its climate, e.g. it experienced larger temperature variations than the other regions during the time period under investigation. This finding agrees with the study of Kovats et al. [Reference Kovats9], which found different seasonal patterns in New Zealand's North and South Islands.
Social deprivation
Only a small minority of Campylobacter infections present for medical attention and become notified. In the UK, for example, a large population-based study found there were 7·6 cases of laboratory-confirmed Campylobacter infection in the community for every case recorded by the disease surveillance system [Reference Wheeler39]. Consequently, cultural, behavioural and healthcare access factors can have great impact on the observed pattern of disease incidence and distribution. The much lower rate of notification in deprived urban areas is most likely to be caused by such surveillance factors. In New Zealand, in some circumstances, children aged <6 years will not be charged a fee for visiting a GP (the main route of notification) but in most other situations a fee is charged for adults and older children and this could deter people on lower incomes from visiting a GP. Bessel et al. [Reference Bessell20] found tenfold differences in reporting rates between health boards in Scotland, which suggests notification rates can be strongly influenced by reporting practices.
However, there may also be differences in food consumption patterns between high- and low-income groups, e.g. low-income groups may consume less fresh and more frozen poultry, which has been associated with lower risk of infection [Reference Eberhart-Phillips40]. In addition, those on higher incomes may consume prepared food from a larger variety of sources. Rind & Pearce [Reference Rind and Pearce36] found weak evidence that a high density of fresh food outlets was a risk factor for campylobacteriosis in New Zealand even after social deprivation had been accounted for.
There is one exception to this strong SDI relationship in central Christchurch. In the area indicated by a white circle in the inset of Figure 1, a very large number of cases occur in an apparently small population. Further investigation has revealed that this is associated with the accuracy of address matching – the way in which the residential address of the case is used to provide a spatial location. When there are very long streets that cross meshblock boundaries and the house number is not recorded correctly, it is possible that the case will appear in a nearby meshblock. However the ‘smoothing effect’ of the Markov random field prior for the spatial component should help to even out this artificial increase in risk. A summary of address-matching accuracy is given in Table 1.
Livestock density
The epidemiology of campylobacteriosis differs between urban and rural areas. While in urban areas the main transmission route is thought to be via consumption of contaminated food products [Reference Mullner5, Reference Mullner6, Reference McTavish22], in rural areas environmental exposure is thought to play a larger role in transmission [Reference Strachan41]. Such environmental exposures include direct contact with farm animals or their faeces [Reference Kabore42, Reference Gilpin43], swimming in lakes and rivers or drinking untreated water [Reference Carrique-Mas14, Reference White27, Reference Dale44, Reference Karagiannis45]. Young children may be at increased risk from such exposures due to poorer hygiene [Reference Bessell20], which might explain the much higher rates of infection in this age group.
The multiple regression model for rural notifications supports the hypothesis that environmental transmission routes contribute to the burden of disease in Canterbury, where both sheep density and dairy cattle density are significant predictors that increase the risk of notification. In the Manawatu region, dairy cow density was a significant risk factor. Beef cattle density was not significant in any of the regions, possibly due to differences in the way beef and dairy cattle are managed and the degree of direct human contact with faecal material from these animals [Reference Gilpin43]. In both the Manawatu and Canterbury regions the poultry farm distance variable was significant; however, the coefficient had a different sign in each region. This contradictory effect may arise because the number of meshblocks containing large poultry farms in each region is relatively small (36 for Manawatu, 53 for Christchurch) and there was a spatial association in case rates that is not explained by the predictors. Neighbouring meshblocks would have similar poultry farm distances and also similar risks, resulting in a spurious association.
Age and gender
It is thought that the cases occurring in young rural children are caused by direct contact with animals and the environments in which animals live [Reference Mullner5, Reference Grove-White12, Reference Strachan41, Reference Havelaar46]. Due to the wider variety of strains that they are exposed to, these children may then develop increased resistance to re-infection and symptomatic illness in future years compared to children raised in urban environments [Reference Havelaar46]. This hypothesis may explain why the spatial distribution of notifications in rural children aged <5 years shows a higher risk in rural areas, but this trend is reversed for 5- to 14-year-olds (see Fig. 4). In the older age groups there was a much smaller difference between the urban risk and the rural risk, but the risk was still higher overall in urban areas (data not shown). Possibly resistance to campylobacteriosis is maintained in rural populations through constant low-level exposure which is not present in urban areas, or any resistance in urban populations is overcome by the introduction of strain types not previously experienced or brief periods of high exposure [Reference Havelaar46].
It is also important to note that the majority of New Zealand cases occurring over the period of this study were likely to have been infected by a single dominant source, contaminated poultry meat [Reference Mullner5–Reference Wilson8, Reference Baker, Sneyd and Wilson19]. Consequently, even small demographic and geographical variations in exposure to this source could have an important impact on the observed patterns of disease distribution.
Weather
Figure 5 suggests that the peak in campylobacteriosis notifications occurs before the peak in temperature and hours of sunshine. Moreover, each phase of the cycle in the notifications appears to occur at the same time as, or prior to, the corresponding phase in the temperature and hours of sunshine. Such a relationship generates a high correlation between weather and notifications, but does not indicate a causal relationship. This finding may suggest that weather, and temperature in particular, is not the primary driver for seasonality in campylobacteriosis. Ultimately any seasonality in notifications is likely to be most strongly influenced by human behaviour, which could potentially be influenced purely by our expectations of the weather rather than the weather itself. Alternatively, it may be possible that the risk of exposure to infection is raised throughout the summer period but the risk of symptomatic illness reduces as the season progresses, due to an increase in immunity in the population. For example, the increased exposure may be attributable to seasonal changes in food preparation and cooking practices (such as barbequing) [Reference Ikram47–Reference Doorduyn51], and other outdoor activities that increase exposure to animal faeces [Reference Dale44, Reference Kapperud49].
There are many other possible explanations for the seasonality in campylobacteriosis. Despite the known importance of poultry as a reservoir for Campylobacter spp., the peak in the prevalence of Campylobacter in broiler flocks has not been established to generate the peak in human notifications [Reference Kovats9, Reference Rushton52]. Summer peaks have sometimes been observed in the prevalence of Campylobacter spp. in poultry [Reference Rushton52–Reference Wallace54] and spring or early summer peaks are observed in notifications from a range of countries [Reference Kovats9], with milder winters being associated with earlier peaks. It is likely that temperature does not directly cause either the peak in human notifications or poultry prevalence. Instead, each peak may be caused by a range of as yet unidentified factors which are related to climate. For example, some authors have suggested that the summer peak in poultry is caused by increases in fly populations and changes in management practices during the summer months [Reference Ellis-Iversen55, Reference Hansson56]. The increases in notifications observed in the winter and spring, particularly in rural areas, may be associated with increased contact with cattle during calving, which is highly seasonal in New Zealand and generally starts in late July (see [57, p. 44]).
It is challenging to attempt to infer short time-scale risk factors for infection from notification data. Typically notification occurs several days after the onset of symptoms, which are thought to begin between 2 and 5 days after exposure [Reference Heymann58]. The median time lapse between the onset of symptoms and reporting was found to be 8 days [Reference Lim and Pirie59]. Variations in these delay lengths then obscure any causal relationships between the exposure and the notification. Clearly it would be preferable to work with the date of onset rather than the date of notification; however, for the data used in this study onset dates were rarely recorded. In addition the weather in New Zealand is highly variable and so weather information averaged over a week and averaged between the weather stations in the region is likely to lose any detailed information about how specific weather patterns influence human behaviour. Consequently we have not included any detailed regression analysis using weather variables as predictors in this study.
Concluding remarks
Campylobacteriosis case rates are highly variable in both space and time, and the drivers for the observed seasonal trends in particular are poorly understood. Source attribution studies and other published evidence have implicated exposure to contaminated poultry as the dominant risk factor for infection in NZ over the study period [Reference Mullner5–Reference Wilson8, Reference Sears60]. Nonetheless, by examining notification data this study has provided additional evidence about other potential sources of infection. In particular, this spatial analysis has highlighted the widely differing notification rates over short distances and confirmed that notification patterns are different in urban and rural areas. Social deprivation is strongly negatively associated with notification risk; however, it is unclear if this indicates a difference in infection rates, or if infections are much less likely to become notifications in deprived areas.
Increasingly sophisticated tools are being developed to identify the relationship between genotype and animal host and to assign human infections to individual sources [Reference Mullner4, Reference Wilson8, Reference Sheppard61]. When considered alongside spatial and temporal epidemiological data these provide considerable insight into the pathways for human infection and inform the development and implementation of targeted control strategies.
ACKNOWLEDGEMENTS
The authors thank the New Zealand Food Safety Authority for funding this work and Tui Shadbolt for helpful comments and suggestions.
APPENDIX
Implementation
Samples from the posterior distribution were obtained using MCMC methods. The spatial component U i was updated using a mixture of Metropolis-Hastings proposals and single site conditional prior proposals [Reference Knorr-Held62]. The temporal component R t was updated using a mixture of Metropolis-Hastings proposals and conditional prior proposals in blocks of lengths 4, 5, 9 and 11. The hyperparameters κ U and κ R were updated with Gibbs' steps. Multiple chains were run from randomly generated starting values for 40 000 iterations with a thinning of 20 after a burn-in period of 2000 iterations.
DECLARATION OF INTEREST
None.


