


Twin studies provide important insights into the genetic basis of phenotypic variation of the human brain. Studies of adult twins show that genes play a significant role in the variability of global brain volumes, including total intracranial, total gray matter (GM), and white matter (WM) volumes (Peper et al., Reference Peper, Brouwer, Boomsma, Kahn and Hulshoff Pol2007; Posthuma et al., Reference Posthuma, de Geus, Neale, Hulshoff Pol, Baare, Kahn and Boomsma2000; Schmitt et al., Reference Schmitt, Eyler, Giedd, Kremen, Kendler and Neale2007), and local regional gray and white volumes (Hulshoff Pol et al., Reference Hulshoff Pol, Schnack, Posthuma, Mandl, Baare, van Oel, van Haren, Collins, Evans, Amunts, Burgel, Zilles, de Geus, Boomsma and Kahn2006; Thompson et al., Reference Thompson, Cannon, Narr, van Erp, Poutanen, Huttunen, Lonnqvist, Standertskjold-Nordenstam, Kaprio, Khaledy, Dail, Zoumalan and Toga2001). Other brain measures, such as cortical thickness and surface area, are also highly heritable in adults (Panizzon et al., Reference Panizzon, Fennema-Notestine, Eyler, Jernigan, Prom-Wormley, Neale, Jacobson, Lyons, Grant, Franz, Xian, Tsuang, Fischl, Seidman, Dale and Kremen2009; Schmitt et al., Reference Schmitt, Lenroot, Wallace, Ordaz, Taylor, Kabani, Greenstein, Lerch, Kendler, Neale and Giedd2008). Not only structure, but also the ‘default-mode’ network (Glahn et al., Reference Glahn, Winkler, Kochunov, Almasy, Duggirala, Carless, Curran, Olvera, Laird, Smith, Beckmann, Fox and Blangero2010) and cognitive function, such as working memory (Blokland et al., Reference Blokland, McMahon, Thompson, Martin, Zubicaray and Wright2011; Karlsgodt et al., Reference Karlsgodt, Kochunov, Winkler, Laird, Almasy, Duggirala, Olvera, Fox, Blangero and Glahn2010; Koten et al., Reference Koten, Wood, Hagoort, Goebel, Propping, Willmes and Boomsma2009), have been shown to relate to genetic factors using functional magnetic resonance imaging (fMRI). A few studies suggest that global and regional GM and WM structures (Peper et al., Reference Peper, Schnack, Brouwer, Van Baal, Pjetri, Szekely, van Leeuwen, van den Berg, Collins, Evans, Boomsma, Kahn and Hulshoff Pol2009) and cortical networks (Schmitt et al., Reference Schmitt, Lenroot, Wallace, Ordaz, Taylor, Kabani, Greenstein, Lerch, Kendler, Neale and Giedd2008) are also heritable in pediatric populations.
Little is known about genetic and environmental contributions to human brain development in the early years of life. The first years of life involve the most dynamic growth of brain structure and function during postnatal development (Gilmore et al., Reference Gilmore, Lin, Prastawa, Looney, Vetsa, Knickmeyer, Evans, Smith, Hamer, Lieberman and Gerig2007, Knickmeyer et al., Reference Knickmeyer, Gouttard, Kang, Evans, Wilber, Smith, Hamer, Lin, Gerig and Gilmore2008). The degree to which genes and environment generate individual differences in early brain development is of fundamental importance in understanding developmental trajectories during childhood, and may help the early identification and prevention of various neurodevelopmental disorders (Gilmore et al., Reference Gilmore, Schmitt, Knickmeyer, Smith, Lin, Styner, Gerig and Neale2010; Schmitt et al., Reference Schmitt, Eyler, Giedd, Kremen, Kendler and Neale2007). Our previous study in neonatal twins (Gilmore et al., Reference Gilmore, Schmitt, Knickmeyer, Smith, Lin, Styner, Gerig and Neale2010) revealed that the heritabilities of total intracranial volume (.73) and total WM volume (.85) were high, and similar to those reported in older children and adults, while GM volume heritability was lower (.56). However, it is not clear whether variation in WM microstructure, such as fiber organization and myelination, is under genetic or environmental control in early childhood.
WM maturation is a complex and lengthy process; the most significant period of myelination occurs between mid-gestation and the second postnatal year (Brody et al., Reference Brody, Kinney, Kloman and Gilles1987; Yakovlev and Lecours, Reference Yakovlev, Lecours and Minowski1967). DTI enables non-invasive estimation of WM microstructure and pathways by measuring water diffusion properties in brain tissues (Basser et al., Reference Basser, Mattiello and Le Bihan1994; Le Bihan et al., Reference Le Bihan, Mangin, Poupon, Clark, Pappata, Molko and Chabriat2001). DTI-extracted parameters, such as apparent diffusion coefficients, including radial diffusivity (RD), axial diffusivity (AD), and fractional anisotropy (FA), are possible indicators of axonal organization, density, and degree of myelination (Beaulieu, Reference Beaulieu2002; Neil et al., Reference Neil, Shiran, McKinstry, Schefft, Snyder, Almli, Akbudak, Aronovitz, Miller, Lee and Conturo1998; Song et al., Reference Song, Sun, Ramsbottom, Chang, Russell and Cross2002). RD and AD describe the diffusion degree perpendicular to and parallel to fiber tracts, respectively, and the normalized parameter FA estimates the anisotropy degree of the diffusion process. DTI studies in adult twins have reported high heritability in the microstructure of the splenium and genu corpus callosum (Pfefferbaum et al., Reference Pfefferbaum, Sullivan and Carmelli2001), and of FA in bilateral frontal, parietal and left occipital lobes (Chiang et al., Reference Chiang, Barysheva, Shattuck, Lee, Madsen, Avedissian, Klunder, Toga, McMahon, de Zubicaray, Wright, Srivastava, Balov and Thompson2009). It has been shown that the whole brain WM FA and RD show significant genetic variability, with heritability values of .52 and .37, respectively (Kochunov et al., Reference Kochunov, Glahn, Lancaster, Winkler, Smith, Thompson, Almasy, Duggirala, Fox and Blangero2010). Genetic variation in AD was nonsignificant in that study, and estimates of heritability vary among different major fiber regions. A recent WM developmental study of persons aged 12 to 29 years indicated genetic variation in WM integrity (represented by FA), and that the effects vary with age (higher in adolescence than adulthood), gender, socioeconomic status, and IQ (Chiang et al., Reference Chiang, McMahon, de Zubicaray, Martin, Hickie, Toga, Wright and Thompson2011). A study in nine-year-old children reported that RD and AD, rather than FA, were significantly influenced by genetic factors (Brouwer et al., Reference Brouwer, Mandl, Peper, van Baal, Kahn, Boomsma and Hulshoff Pol2010). Additional studies of larger samples are needed to clarify the pattern of results across ages, tracts, and DTI measures.
The aim of the present study was to assess the early genetic and environmental influences on the WM microstructure in neonates. We hypothesized that WM is highly heritable, that genetic influences vary in different brain regions, and that the non-uniformity in each individual might be related to the maturation pattern. Due to the inconsistent previous findings of genetic effects on different diffusion measures, the three commonly used parameters FA, RD, and AD, were analyzed in this study. Structural equation modeling was used to estimate global and regional genetic and environmental effects in a sample of neonatal twin pairs. It has been suggested that the diffusion measures are associated with WM development (Dubois et al., Reference Dubois, Hertz-Pannier, Dehaene-Lambertz, Cointepas and Le Bihan2006, Gao et al., Reference Gao, Lin, Chen, Gerig, Smith, Jewells and Gilmore2009). During the maturation process, decreases in RD may reflect axonal myelin synthesis and proliferation of glial cells. Increases in FA could reflect fiber organization, and may also be attributed to decreases in RD (Partridge et al., Reference Partridge, Mukherjee, Henry, Miller, Berman, Jin, Lu, Glenn, Ferriero, Barkovich and Vigneron2004). Therefore the correlation between heritability estimates and the level of RD were computed to explore whether regional genetic variation is modulated by the maturation degree in the first few months of life.
Methods
Subjects
The Institutional Review Board of the University of North Carolina (UNC) School of Medicine and Duke University Medical Center (DUMC) approved this study. Mothers with same-sex twin pregnancies were recruited from the outpatient OB-GYN clinics at UNC Hospitals and DUMC. Exclusion criteria included maternal HIV infection, major congenital abnormality on fetal ultrasound, and chromosomal abnormalities of fetuses. Informed consent was obtained from the parents of all subjects. For zygosity testing, polymerase chain reaction–short tandem repeat (PCR–STR) analysis of 14 loci was performed on DNA isolated from buccal swab cell collection (BRT Laboratories, Baltimore, MD). The study sample consisted of 173 individual participants comprising 63 complete same-sex twin pairs — 31 monozygotic (MZ) and 32 dizygotic (DZ) — and 47 unpaired twins. Two twin pairs from a single mother are included, though treated as independent pairs in the statistical analysis. Demographic and clinical variables are presented in Table I.
Image Acquisition and DTI Preprocessing
All neonatal MRI scans were acquired on a head-only 3T scanner (Allegra, Siemens Medical Solutions, Erlangen, Germany) around 40 postnatal days of age (see Table 1). All subjects were scanned without sedation. Before neonates were imaged, they were fed, swaddled, and fitted with ear protection. Once asleep they were fitted with earplugs or earphones and placed in the MRI scanner with head in a vacuum-fixation device. Scans were performed with a neonatal nurse present, and a pulse oximeter to monitor heart rate and oxygen saturation. A single-shot echo-planar spin echo DTI sequence was used with the following variables: TR 5,200 ms, TE = 73 ms, slice thickness = 2 mm, in-plane resolution = 2 × 2 mm2, and 45 slices. One image without diffusion gradients (b = 0) and diffusion-weighted images (DWIs) along 6 gradient directions, with a b value of 1,000 mm2/sec, were acquired. The acquisition was repeated five times to improve signal-to-noise ratio. DWIs were screened offline for motion artifacts and for missing and corrupted sections using an automatic DWI quality control tool, DTIPrep (http://www.nitrc.org/projects/dtiprep). Diffusion images with large motion artifacts were excluded from the entire set of DWIs. The DWIs with more than 70% successful rate were retained for later analysis. After the offline screening, the five repeated sequences were combined into a single DWI volume and the diffusion maps, such as RD, AD, and FA, were then estimated using standard weighted least square fitting (Liu et al., Reference Liu, Wang, Gerig, Gouttard, Tao, Fletcher and Styner2010).
TABLE 1 Demographic Characteristics for Participants
MZ = monozygotic, DZ = dizygotic, SD = standard deviation
DTI Registration and White Matter Parcellation
All tensor images (173 in total) were first rigidly aligned and the average computed and used as the initial template. The original DTI data was affine-aligned to it, and a new average tensor image was computed for the updated template, which is sharper than the initial one. Affine registration was repeated three times; little change was found between the average images from the third and second iteration, indicating that the initial template converged after the third iteration. The affine-aligned tensors were then mapped to an iteratively updated group average with an unbiased group-wise tensor-based deformable registration method (Zhang et al., Reference Zhang, Avants, Yushkevich, Woo, Wang, McCluskey, Elman, Melhem and Gee2007). At each iteration, all input images were warped to the average of the registered tensors in the previous iteration. This deformable registration was repeated six times, allowing the convergence of the group average, that is, the template. The tensor-based rigid, affine, and non-rigid registrations were performed using a publicly available toolkit, DTITK (http://dti-tk.sourceforge.net/pmwiki/pmwiki.php). The RD, AD, and FA maps (Figure 1) were then warped to the template space using their corresponding affine matrices and deformation fields estimated from the above registration process.
FIGURE 1 The FA (fractional anisotropy), RD (radial diffusivity) and AD (axial diffusivity) maps of a typical original diffusion tensor imaging (DTI) data.
We adapted the recently developed WM atlas JHU-DTI-SS (a.k.a. ‘Eve atlas’, http://lbam.med.jhmi.edu/) (Oishi et al., Reference Oishi, Faria, Jiang, Li, Akhter, Zhang, Hsu, Miller, van Zijl, Albert, Lyketsos, Woods, Toga, Pike, Rosa-Neto, Evans, Mazziotta and Mori2009), to obtain a comprehensive WM parcellation for calculation of regional average diffusion parameters. The FA map of the atlas was affine-aligned and then deformably registered to the average FA maps of our warped neonatal DTI data. The ‘Type II’ WM parcellation with 130 labels was mapped to the neonatal space following the affine and non-rigid transformations with nearest neighbor interpolation. This parcellation included 52 gyri regions (including 44 superficial WM regions), 56 deep WM regions, 10 subcortical regions, and 12 other regions. The boundary of the cortex and WM of our DTI atlas was defined by an FA threshold of .1. Since most WM regions are not myelinated at birth, the FA values are lower compared to those in adults (Dubois et al., Reference Dubois, Dehaene-Lambertz, Perrin, Mangin, Cointepas, Duchesnay, Le Bihan and Hertz-Pannier2008). The boundary was used to define the superficial WM regions included in the corresponding gyri from the Type II parcellation. In this study, we included 44 superficial WM ROIs, 52 deep WM ROIs (bilateral inferior cerebral peduncle and medial lemniscus were excluded due to the very small coverage of the ROIs with less than 10 voxels in the neonatal atlas), and bilateral cerebellum WM, 98 WM ROIs in total. The abbreviations of each ROI can be found in the Appendix. For every registered individual diffusion map, the FA, RD, and AD were averaged over each ROI. Therefore, the three sets of 98 diffusion parameters from each subject were obtained (see Figure 2(a)) and ready for the following statistical analyses.
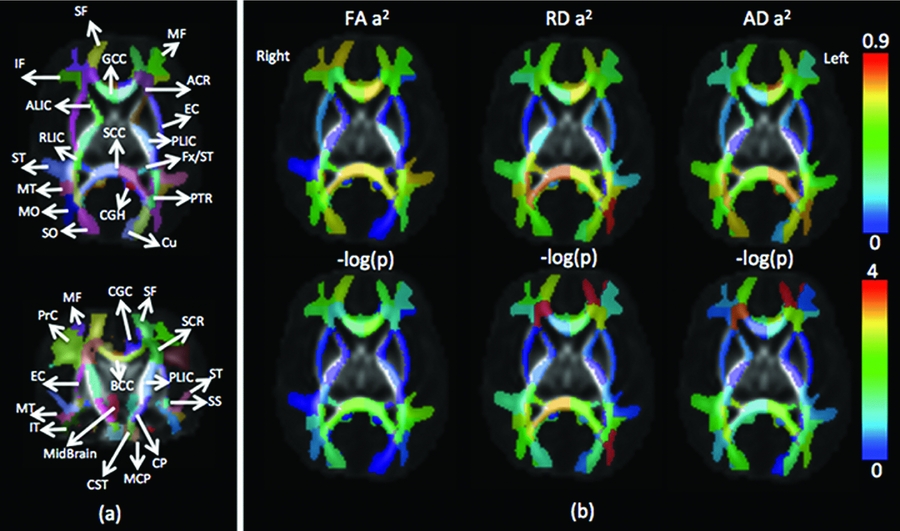
FIGURE 2 (a) Illustration of white matter regions of interest (ROIs) in the neonatal image space; (b) heritability values of FA, RD and AD over each ROI and their corresponding p values (normalized using -log(p), –log(0.05) = 1.3, and –log(0.0001) = 4). Note: see Appendix for ROI abbreviations; image left corresponds to brain left.
Estimation of Genetic and Environmental Effects
Genetic and environmental variation in the average whole brain (thresholded with FA > .1), left and right hemispheres, and ROI measures of WM integrity (FA, AD, and RD) were estimated using a classic univariate twin modeling approach (Neale & Cardon, Reference Neale and Cardon1992). This approach utilizes MZ and DZ twin pair variances and covariances to estimate the proportion of total phenotypic variance due to additive genetic, shared environmental, and unique environmental influences. Additive genetic effects (A) refer to the additive effects of alleles at every locus; shared environmental effects (C) are those effects shared by twin pairs; and unique environment effects (E) refer to effects not shared by twin pairs and include measurement error. Univariate analysis parameterizes the total phenotypic variance as σ2V = σ2A + σ2C + σ2E. Twin covariances are parameterized as σ2covMZ = σ2A + σ2C and σ2covDZ = .5σ2A + σ2C. The full ACE model and its submodels, (i.e. AE, CE, and E only) were fitted to test the significance of additive genetic and shared environmental effects on the three sets of imaging measures. Model fitting used maximum likelihood (Edwards, Reference Edwards1984) by calculating twice the negative log-likelihood of the raw data for each twin pair, and summing across all pairs. Because the variance component estimates are zero-bounded, the difference between an original model and its respective submodels follows a 50:50 mixture of zero, and a χ2 distribution with degrees of freedom equal to the difference in model parameters (df = 1 for AE and CE models, df = 2 for an E-only model).
There were significant (p < .05) associations between diffusion measures and gestational age at MRI in most ROIs. Similarly, significant differences in mean intensity (p < .05) were detected by gender in approximately 5% of all positions. All analyses included sex and the linear effects of gestational age at the MRI scan as fixed effects in the means models. Prior to ACE submodel comparisons, saturated models were fitted to test for group differences in mean and variances, and to estimate cross-twin correlations by zygosity. Maximum likelihood analyses of individual observations were used for all analyses as implemented in OpenMx 1.1, a package for use within the R language (Boker et al., Reference Boker, Neale, Maes, Wilde, Spiegel, Brick, Spies, Estarbrook, Kenny, Bates, Mehta and Fox2011).
Analysis of Relationship Between Heritability and Diffusion Measures
Mean FA, RD, and AD were calculated across the whole population over each ROI. Three linear regression analyses were performed on the mean FA and FA heritability, mean RD and RD heritability, and mean AD and AD heritability separately.
A single parameter may not be specific to maturation status. High FA might not indicate high maturation (e.g., splenium and genu of the corpus callosum have high FA values after birth, but are not myelinated until later years of age). In general, a high RD region where fibers follow similar directions might indicate a low myelination degree. However, regions with more complex fiber organization, such as crossing fibers, may also appear to have high RD, despite being highly myelinated. Since RD rather than AD has been shown to be better representative of changes in demyelination models (Song et al., Reference Song, Sun, Ju, Lin, Cross and Neufeld2003), we analyzed the data by considering both FA and RD. The ROIs were separated into four subgroups according to high/low FA (20 ROIs with the highest/lowest FA) and high/low RD (20 ROIs with the highest/lowest RD) values, and the genetic effects were summarized under the four conditions: HL, HH, LL and LH (see Table 3). HL (high FA and low RD) might be associated with high maturation; HH indicates regions that are well organized but have low maturation; LL may correspond to high maturation regions with complex fiber organization; and LH might represent a low degree of maturation.
TABLE 2 Genetic and Common Environmental Contribution Estimates for Whole Brain, Left, and Right Hemisphere White Matter, Diffusion Tensor Imaging Parameters
a2 = genetic contribution, c2 = common environmental contribution, CI = confidenc interval, WB = whole brain, L = left, R = right, MZ = monozygotic, DZ = dizygotic
TABLE 3 Regional Heritability of FA and RD Under Four Conditions: High FA and Low RD; High FA and High RD; Low FA and Low RD; and Low FA and High RD
See Appendix for abbreviations of regions of interest (ROIs), a2 = genetic contribution, L = left, R = right, HL = high-low, HH = high-high, LL = low-low, LH = low-high.
* = p < .05.
Results
Both qualitative and quantitative tests suggested that the population distribution of most ROIs approximated a normal distribution. Similarly, there were no statistically significant differences in means and variances between MZ and DZ twins for most structures. Population means and variances are reported in Table 4.
TABLE 4 (a) Genetic and Common Environmental Contribution Estimates of Averaged FA Over Superficial and Deep White Matter Regions of Interest
TABLE 4 (b) Genetic and Common Environmental Contribution Estimates of Average RD Over Superficial and Deep White Matter Regions of Interest
TABLE 4 (c) Genetic and Common Environmental Contribution Estimates of Average AD Over Superficial and Deep White Matter Regions of Interest
See Appendix for abbreviations of regions of interest (ROIs); FA = fractional anisotropy, RD = radial diffusivity, AD = axial diffusivity, a2 = genetic contribution, c2 = common environmental contribution, MZ = monozygotic, DZ = dizygotic, CI = confidence interval, S = superficial white matter, D = deep white matter. The unit of RD and AD traits is 10−3mm2s−1; other measures are unitless; genetic or environmental effects with p ≤ .0005 are highlighted.
* = .0005 < p ≤ .05, ** = .00001 < p ≤ .0005, *** p ≤ .00001.
Global Analysis
There was significant heritability across all three average diffusion parameters over whole brain WM (Table 2). FA had the highest heritability, .60, 95% CI [.22, .91], followed by AD, .57, 95% CI [.19, .90], and RD, .53, 95% CI [.19, .91]. There was significant heritability in both hemispheres of FA: left, .56, 95% CI [.16, .89], right, .60, 95% CI [.20, .90]; and RD: left, .45, 95% CI [.09, .88], right, .60, 95% CI [.27, .93]. AD heritability was significant in the right hemisphere only, .68, 95% CI [.30, .92].
Regional Analysis
The regional diffusion parameters of each ROI are listed in Table 4. The mean FA values range from .11 to .38; D varies within 0.79 ~ 1.65 × 10⁻³ mm2s−1, and AD varies between 1.09 ~ 2.17 × 10⁻³mm2s−1. Posterior limb of internal capsule (PLIC), retrolenticular part of internal capsule (RLIC), and the splenium and genu of the corpus callosum show larger FA values. PLIC, pontine crossing tracts, corticospinal tracts, midbrain, anterior limb of internal capsule (ALIC), and RLIC have smaller RD than other regions. These findings are consistent with our previous early WM developmental study focused on the major fiber bundles (Geng et al., 2011). Superficially located WM in cortical regions has lower FA values compared to deep WM.
Among the majority of ROIs, MZ twin pairs had increased correlations of FA, RD, and AD compared with DZ twin pairs, suggesting significant additive genetic effects. In general, heritability shows heterogeneity over WM tissue (Figure 2b). There are about half of the ROIs with high heritability (A > .50, p < .05) on RD (49 ROIs), AD (42 ROIs), and FA (42 ROIs) measures. Many fewer ROIs show high common environment effects (C > .50, p < .05) for RD (10 ROIs), AD (7 ROIs) and FA (3 ROIs) (Table 4).
For FA heritability, left posterior corona radiata shows the highest genetic variation (A = .82). There are seven regions with relatively high RD heritability estimates with A > .80: superficial WM regions in left middle and inferior occipital gyrus, right pre-cuneus, and right inferior temporal gyrus, and deep WM regions of right sagittal stratum, right splenium of corpus callosum, and left posterior corona radiata. The corresponding RD values in these regions are relatively high (between 1.19 and 1.30).
For AD heritability, right posterior corona radiata show the highest genetic variation with A = .92. For the estimates of environmental variation, WM in the left inferior temporal gyrus has the highest FA environmental variation with C = .69. Bilateral external capsule and left PLIC have relatively high RD environmental variation with C > .7, and right external capsule shows the highest value of C = .82. Left external capsule and WM in left angular gyrus show the highest environmental variation of AD with C = .71.
Relationships Between Heritability and Diffusion Measures
There is no correlation between FA heritability and mean FA throughout the 98 ROIs (Figure 3). There is a significant positive correlation between RD heritability and mean RD (r = .17, p < 10−5), and a significant positive correlation between AD heritability and mean AD (r = .05, p = .02).
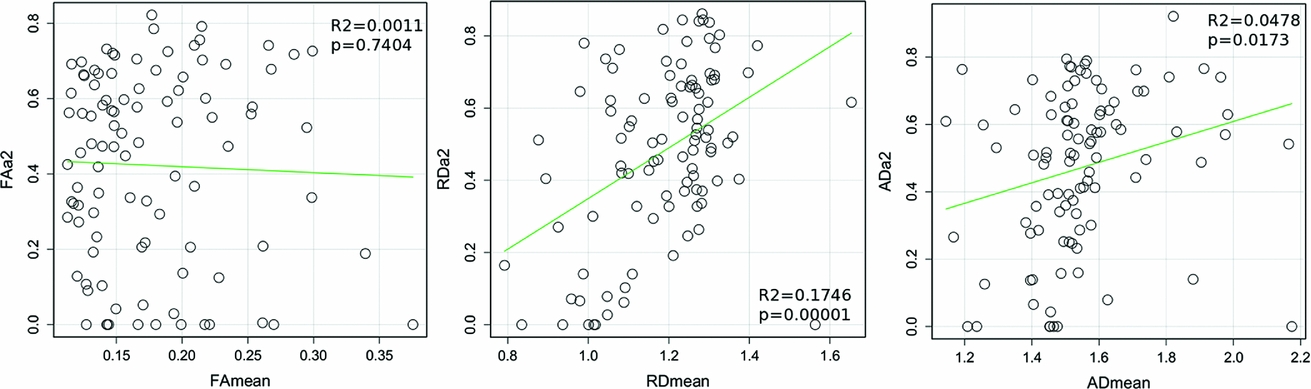
FIGURE 3 Correlation plots between mean diffusion parameters (RD, AD and FA) and their heritability values over 98 white matter ROIs.
Genetic variation in FA and RD under the four conditions, HL, HH, LL, and LH, is described in Table 3. We note that ROIs with high FA and low RD include major projection fibers with known earlier maturation after birth (Kinney et al., Reference Kinney, Brody, Kloman and Gilles1988). All these regions show low genetic effect on FA, and most of these regions show low genetic effect on RD (except for right RLIC and right superior cerebral peduncle). ROIs with high FA and high RD include bilateral body corpus callosum, right posterior thalamic radiation, and left tapetum. All these regions have high FA heritability, and all but left tapetum has high RD heritability. ROIs with low FA and low RD include bilateral cerebellum with high RD and FA heritability. ROIs with low FA and high RD include a few superficial WM regions in bilateral lingual gyrus, bilateral middle frontal orbital gyrus, and right lateral frontal orbital gyrus.
Discussion
Genetic Effects Related to Overall White Matter Microstructure
This is the first twin study to assess the genetic and environmental contributions to WM microstructure measured by DTI in neonates. The heritability estimates for DTI measures averaged over the whole brain WM (FA = .60, RD = .53, and AD = .57) were higher than those reported for an adult population (FA = .52, RD = .37). Further, no significant genetic effects were detected for AD in the adult study (Kochunov et al., Reference Kochunov, Glahn, Lancaster, Winkler, Smith, Thompson, Almasy, Duggirala, Fox and Blangero2010). WM development is a complex process that continues into adulthood. During the long maturation process, different environmental exposures likely play a role in neuronal plasticity and influence the WM integrity of individuals (Bengtsson et al., Reference Bengtsson, Nagy, Skare, Forsman, Forssberg and Ullen2005). Therefore, genetic variation might decrease with development and aging. The higher heritability estimates for diffusion measures, especially for RD and AD (for RD, ALeft = .45, ARight = .60; for AD, ALeft = .43, ARight = .68), may correspond to WM microstructure asymmetries in adults (Jahanshad et al., Reference Jahanshad, Lee, Barysheva, McMahon, de Zubicaray, Martin, Wright, Toga and Thompson2010), and to brain structural asymmetries that appear in neonates (Gilmore et al., Reference Gilmore, Lin, Prastawa, Looney, Vetsa, Knickmeyer, Evans, Smith, Hamer, Lieberman and Gerig2007).
Heterogeneous Heritability Across Regions of Interest
Results from regional ACE analysis indicate that the magnitude of genetic effects differs across WM regions. About half of the regions analyzed show high heritability in the diffusion measures. Among RD measures, the regions with the largest magnitude of heritability include left middle (.86) and left inferior occipital WM (.84), right inferior temporal (.84), and right pre-cuneus WM, part of the superior parietal lobule (.84). There was no significant genetic contribution for several major WM fiber bundles, such as bilateral uncinate fasciculus RD. Interestingly, the WM regions with the highest RD heritability have low FA heritability (A = .23–.48), whereas the uncinate fasciculus shows relatively high FA heritability (left/right: .62/.58).
The inconsistent genetic effects on RD and FA over several WM regions suggest that these two measures reflect distinct WM biological properties that are shaped differently by genetic and environmental effects. Future multivariate approaches focusing on the shared genetic and environmental effects between these measures could help elucidate this relationship.
Substantial Shared Environmental Effects in Specific Regions of Interest
Bilateral PLIC, ALIC, external capsule, uncinate fasciculus, and left middle cerebellar peduncle show high shared environmental effects in RD ranging from .57 to .82. The AD of bilateral external capsule, middle cerebellar peduncle, and inferior frontal occipital fasciculus also has a large proportion of shared environmental effects, ranging between .47 and .71. Shared environmental effects are substantial for the RD measure of bilateral external capsule (left/right: .73/.82). Located between the putamen and claustrum, and lateral to the internal capsule, the external capsule is believed to contain association fibers, such as the superior longitudinal fasciculus, inferior frontal occipital fasciculus, and commissural fibers, and is not devoid of projection fibers. Together with PLIC and ALIC, the external capsule may have started myelination earlier prenatally than other association fibers (Kinney et al., Reference Kinney, Brody, Kloman and Gilles1988). Prenatal neurohormonal and uterine environment could affect the maturation process, which might lead to pronounced shared environmental variation in the maturation process. The significant genetic contributions in these regions observed in adults (Kochunov et al., Reference Kochunov, Glahn, Lancaster, Winkler, Smith, Thompson, Almasy, Duggirala, Fox and Blangero2010) may indicate the canalization effect (Gilmore et al., Reference Gilmore, Schmitt, Knickmeyer, Smith, Lin, Styner, Gerig and Neale2010; Lenroot & Giedd, Reference Lenroot and Giedd2008). For example, cumulative genetic effects determine the endpoint of development, while early trajectories of development may be influenced more by environmental factors.
Relationships Between Genetic Variation and Maturation Status
The significant correlations between heritability and the mean diffusion levels of RD and AD suggest that genetic variation in WM microstructure may be modulated by maturation status in neonates. Membrane proliferation, one major WM maturation process, would lead to decreased RD and AD, and unchanged FA; fiber myelination, another major maturation process, would correspond to decreased RD, increased FA, and unchanged AD (Dubois et al., Reference Dubois, Dehaene-Lambertz, Perrin, Mangin, Cointepas, Duchesnay, Le Bihan and Hertz-Pannier2008). Studies in animal models that manipulate cerebral myelination levels showed that RD is highly sensitive to regional demyelination (Song et al., Reference Song, Sun, Ju, Lin, Cross and Neufeld2003). Infant WM development studies (Gao et al., Reference Gao, Lin, Chen, Gerig, Smith, Jewells and Gilmore2009, Geng et al., 2011) observed significant increases in FA and significant reductions in RD and AD during the development of the first years of life. The positive correlation (r = .17, p < .00001) between RD heritability estimates and mean levels of RD suggests that fibers with higher maturation in neonates are possibly influenced more by prenatal common or unique environmental factors.
There was no significant association between estimates of heritability for FA and the average FA value across all ROIs. Fibers with higher FA values may not necessarily correspond to higher maturation degree in terms of myelination compared to other fibers at the same time point. Dense well-organized fibers (e.g., corpus callosum) may present high FA values when unmyelinated. Measures taking into account complex fiber structures based on high angular resolution diffusion imaging techniques may better reflect fiber maturation. With the current data acquisition limitation, joint analysis of FA and RD may reflect the maturation status better than univariate analyses of each measure. After separating the WM into four groups, based on high and low mean values of FA and RD, we noticed that major projection fibers fall in the HL group, consistent with previous infant WM maturation studies (Dubois et al., Reference Dubois, Hertz-Pannier, Dehaene-Lambertz, Cointepas and Le Bihan2006; Yakovlev & Lecours, 1967). These projection fibers show low heritability estimates of RD and FA in general. Cerebellum is in the LL group with high genetic effect. The HH group includes the corpus callosum and thalamocortical fibers, which are less mature than the HL group and show high heritability estimates. The LH group contains several superficial WM regions with higher genetic control compared to the HL group. These analyses show a promising beginning to the study of genetic and environmental variation in neuronal maturation.
It is possible that differences in heritability across regions could be driven by changes in the reliability of the measures. The reliability of the measures is likely to be higher in regions with higher FA values. If differences in heritability were driven by the reliability of the measures, a positive correlation, rather than no correlation, would be detected between FA and FA heritability. It is also possible that the sample size of this study may be insufficient to detect significant additive genetic effects, which may explain the lack of significant heritability for some measures. Clarification of these issues is expected to be addressed as sample size increases over time and as longitudinal data become available in our ongoing longitudinal study.
We adapted a recently developed WM atlas for singletons with 130 ROIs to parcellate our neonatal DTI images automatically in twins. WM differences between non-twins and twins may be apparent, especially among neonates. Subsequently, we warped the twin atlas used in this study together with the ROIs to our population-specific atlas, which is expected to reduce any effect caused by using the non-twin atlas. Compared to tractography-based approaches, which may only focus on major or more visible fiber tracts, our approach has a wider coverage of the WM. Due to the relatively low signal-to-noise ratio of the neonatal data (smaller brain size and shorter scanning time constrained by the baby's sleeping time), the voxel-based DTI analysis used by several DTI heritability studies in pediatric and adult groups may prove difficult to apply to neonatal brain image data. The ROI-based average regional measure used here is one way to overcome this limitation, as it decreases spatial resolution to increase data reliability. Future efforts to optimize the neonatal DTI atlas are expected to decrease measurement variability.
While there were significant mean differences for ROIs by gender, specific models testing the contribution of sex to the etiology of WM development could not be tested due to the absence of opposite-sex DZ twin pairs. Consequently, these results cannot resolve questions of genetic and environmental heterogeneity by gender in the development of WM. Nevertheless, these results provide comprehensive insight into the genetic and environmental contributions to WM during early human development.
The statistical tests of the genetic and environmental components (shown in Table 4) were not corrected for multiple comparisons. In the present context we do not seek to establish the statistical significance of the most heritable region, which would be analogous to, for example, correcting the p-value of the most significant SNP association in a genome-wide association study. Instead we wish to report the parameter estimates across a large number of different regions. A Q-Q plot would show that there is ample evidence of departure from the expectation under the null hypothesis that none of the regions demonstrates statistically significant heritability.
Conclusion
We have conducted the first twin study of neonatal brain WM microstructure with DTI. In general, substantial heritability of the average DTI parameters was found over the whole-brain WM and is higher than that which has been reported for adults. Genetic and environmental effects are heterogeneous and display a wide range in magnitude over different WM regions. Significant positive correlation between heritability and diffusion measures suggests that regional genetic effects may be modulated by maturation status of the neonatal brain—the more mature the region, the less heritable its variation. Common environmental effects are present in fewer regions that tend to be characterized by low RD. Our joint diffusion parameter analysis suggests that multivariate modeling approaches that jointly analyze the diffusion parameters are promising approaches to estimating maturation status and its relationship with genetic and environmental effects.
Acknowledgments
This work was supported by the National Institutes of Health grants MH070890 (J. H. Gilmore), MH-65322 (M. C. Neale), and NIMH Training Grant MH-20030.
Appendix
List of Abbreviations of Regions of Interest (ROIs)
A, Angular gyrus
ACR, Anterior corona radiata
ALIC, Anterior limb of internal capsule
BCC, Body of corpus callosum
Cerebel, Cerebellum cortex
CGC, Cingulum (cingulate gyrus)
CGH, Cingulum (hippocampus)
Cing, Cingulate gyrus
CP, Cerebral peduncle
CST, Corticospinal tract
Cu, Cuneus
EC, External capsule
Fu, Fusiform gyrus
Fx/ST, Fornix (cres)/Stria terminalis (cannot be resolved with current resolution)
GCC, Genu of corpus callosum
IF, Inferior frontal gyrus
IFO, Inferior fronto-occipital fasciculus
IO, Inferior occipital gyrus
IT, Inferior temporal gyrus
L, Lingual gyrus
LFO, Lateral fronto-orbital gyrus
MCP, Middle cerebellar peduncle
MF, Middle frontal gyrus
MFO, Middle fronto-orbital gyrus
Midbrain
MO, Middle occipital gyrus
MT, Middle temporal gyrus
PCR, Posterior corona radiata
PCT, Pontine crossing tract (a part of MCP)
PLIC, Posterior limb of internal capsule
PoC, Post-central gyrus
PrC, Pre-central gyrus
PrCu, Pre-cuneus
PTR, Posterior thalamic radiation (includes optic radiation)
r peduncle
R, Rectus gyrus
RLIC, Retrolenticular part of internal capsule
SCC, Splenium of corpus callosum
SCP, Superior
SCR, Superior corona radiate
SF, Superior frontal gyrus
SFO, Superior fronto-occipital fasciculus (could be a part of ALIC)
SLF, Superior longitudinal fasciculus
SM, Supramarginal gyrus
SO, Superior occipital gyrus
SP, Superior parietal lobule
SS, Sagittal stratum (includes ILF and IFO)
ST, Superior temporal gyrus
Tap, Tapetum
UF, Uncinate fasciculus


