


The concept of ‘successful ageing’ gained currency in the mid-20th century and was progressively promoted( Reference Rowe and Kahn 1 ). One of its three components was defined as ‘active engagement with life’. ‘Healthy ageing’ was conceptualized with more concern for the quality of life vital for development, and achievable when ‘appropriate nutrition and healthy eating at an early age’ were ensured according to WHO( Reference Strawbridge, Wallhagen and Cohen 2 , 3 ). This underscored the importance of food habits in health-seeking behaviour for ageing people. Such habits are likely to influence both disability and mortality outcomes. Food habits may or may not extend to food preparation and whether they do may be relevant to health outcomes, making food preparation a health-promoting behaviour( Reference Zanjani, Schaie and Willis 4 ).
Cooking, in the broad sense, refers to food preparation which provides an opportunity for personal involvement in the food system. Cooking requires the selection, measurement and combining of ingredients in an ordered procedure to achieve the desired result. Therefore, it is an activity which requires physical and mental health. There is a relationship between food preparation and cooking skills and food choice within a family( Reference Chenhall 5 ). In the community and household, the kitchen is a key social location, a situation referred to as ‘commensality’( Reference Wahlqvist 6 ).
Life stage has a direct impact on cooking behaviours and attitudes( Reference Wahlqvist 7 ). Cooking behaviour varies with age. Younger people may look to cook more creatively while seniors balance convenience and comfort in their cooking. Ethnicity influences mainstream cooking culture( Reference Wahlqvist 8 ). In addition, cooking has a pronounced gender variation( Reference Park, Jang and Kim 9 ). Women are still probably the primary role models and teachers of cooking and food preparation skills across age and socio-economic groups, as illustrated by notable examples of such leadership, although men's contribution as cooking mentors, other than as doyen chefs, would appear to be on the increase( Reference Wang 10 ). Taste, nutritional value, cost and time for preparation are the primary and often conflicting factors which influence food choice and preparation decisions( Reference Chenhall 5 ).
Elders may be less able or willing to be participants in a number of food consumption trends. Increasingly food is eaten away from home for convenience and tends to be lower in nutritional quality than food prepared at home, although healthy alternatives may still be desired. More affluent consumers may seek a variety of foods and cuisines along with convenience, entertainment and enjoyable dining experiences( Reference Stewart, Blisard and Jolliffe 11 ). For more home-bound elders, there must be questions about the health consequences of the aggregate of limited shopping( Reference Chang, Chen and Wahlqvist 12 ), restraints on eating out and whether and how often it is possible to cook at home with or without help.
Cooking has been an important part of social life and household economics, especially for older generations. We have investigated whether cooking activity can contribute to survivorship, independent of physical and cognitive function, by linking study data to the National Death Registry for decedents’ time of death.
Methods
Study population
The present study used data from the Elderly Nutrition and Health Survey in Taiwan (NAHSIT Elderly), a nationally representative sample of the free-living elderly aged ≥65 years, conducted in 1999 and 2000( Reference Pan, Hung and Shaw 13 ). A total of 1937 participants completed the household interview and 1900 had a verifiable national identity number which would allow linkage to the National Death Registry. Seven, two and three participants had no cooking information, unreasonable response about their cooking status or an incorrect date of death, respectively. This left 1888 eligible participants for analysis. All participants signed informed consent. The ethics committees of the National Health Research Institutes and Academia Sinica in Taiwan approved the study protocol.
Measurements
Cooking frequency
Cooking frequency was measured by the following question: ‘Do you have to cook or prepare food for yourself or help with these? Do not include ready-to-eat food’. The response options were ‘never’, ‘1–2 times a week’, ‘3–5 times a week’ and ‘more than 5 times a week’. Whether help was provided by a food preparer was asked separately, and the two responses were integrated as required in the models developed. In particular, the following question was asked: ‘If you prepare three meals a day for yourself, who is usually responsible in buying the ingredients for cooking?’, with possible answers of ‘never prepare food for myself’, ‘self’, ‘children or relatives’, ‘friends or neighbours’, ‘housemaid’ and ‘others (please indicate)’.
Dietary intake
The dietary information was collected by a 24 h dietary recall at interview. The mean daily food intakes per 4184 kJ (1000 kcal), as well as mean daily energy intake and nutrient densities per 4184 kJ (1000 kcal) for selected nutrients, were calculated.
Covariates
Cognitive function was measured by the Short Portable Mental Status Questionnaire (SPMSQ), which has ten questions dealing with orientation in time and place, personal history, long-term and short-term memory and calculation ability; it has been validated in a Taiwanese population( Reference Pfeiffer 14 , Reference Hsiao, Chiu and Liu 15 ). With total score ranging from 0 to 10, correct answers were coded 1, whereas errors were coded 0. In the present study, participants were grouped into those who did not incur errors (SPMSQ = 10, intact cognition), those who incurred one or two errors (SPMSQ = 8–9, mild impairment) and those who incurred three or more errors (SPMSQ = 0–7, moderate to severe impairment).
Physical function was measured by the physical functioning subscale of the SF-36 Health Survey in a validated traditional Chinese version( Reference Lu, Tseng and Tsai 16 ) and was transformed into norm-based scores in which a higher score indicates better physical function( Reference Ware, Kosinski and Dewey 17 ).
Baseline demographic characteristics, socio-economic status, health and other eating behaviour variables included age, gender, education, marital status, ethnicity, perceived financial status (obtained from the question ‘Do you have enough money?’; options for the answer were ‘more than enough’, ‘just enough’ and ‘not enough’), smoking, alcohol drinking, physical function, chewing ability and nutrition knowledge awareness (‘Do you pay attention to nutritional information?’; options for the answer were ‘always’, ‘sometimes’ and ‘rarely’). The number of co-morbidities at baseline was the sum of twelve chronic diseases to reflect general health status. Food preparer and shopping frequency( Reference Chang, Chen and Wahlqvist 12 ) were taken into account for social connectedness.
Survival time was the interval between the date of interview and the date of death or 31 December 2008, when censored for survivors. We considered deaths both from baseline and 2 years after the interview.
Statistical analysis
Data were weighted to represent the elderly population in Taiwan during 1999–2000. The χ 2 test was used for categorical variables across cooking frequency groups. Cox proportional-hazards models were used to assess the association between predictors and survivorship. In multivariable analyses, physical function, cognitive function and nutrition knowledge awareness were included in the models sequentially to elucidate possible mechanisms. Gender-by-cooking frequency interaction terms were estimated to explore gender differences in the cooking–survival relationship. All analyses were performed using the SAS statistical software package version 9·1·3 (SAS Institute Inc., Cary, NC, USA) and SUDAAN version 10·0 (RTI International, Research Triangle Park, NC, USA) was used to adjust for the design effect of sampling.
Results
During the maximal 10-year follow-up, 695 participants died. Tables 1 and 2 present the distributions of demography and behavioural variables across four cooking frequencies. There was an inverse association between cooking frequency and later mortality. Nearly half (43 %) of the study population never cooked, followed by those who cooked 1–2 times/week (17 %), 3–5 times/week (9 %) and >5 times/week (31 %). The majority of the study population were aged <75 years, males, financially sufficient, non-drinkers of alcohol, non-smokers, engaged in self food preparation, shopped less than once weekly, went out in a private vehicle, were without chewing difficulty, did not eat outside and did not pay attention to nutrition knowledge. About one-quarter had the worst physical function status (physical functioning <45) and more than half had no detectable cognitive impairment (SPMSQ, 0 error). The highest cooking frequencies (>5 times/week) were associated with younger elders, female gender, less education, unmarried or not living together, non-drinking, non-smoking, greater access to public transportation, cycling or walking and shopping more than once weekly. With regard to BMI, the distributions were significantly different; there were no systematic associations with cooking frequency.
Table 1 Survivorship and demography by cooking frequency: free-living elderly participants aged ≥65 years (n 1888), Elderly Nutrition and Health Survey in Taiwan, 1999–2000Footnote †
| Weekly cooking frequency | ||||||
| Descriptor | n‡ | Never | 1–2 times | 3–5 times | >5 times | P§ |
| Number of participants | 1888 | 43·2 | 17·0 | 8·5 | 31·3 | |
| Survivorship (%) | 1193 | 54·2 | 63·1 | 68·4 | 74·2 | <0·001 |
| Mortality ID per 1000 person-years | 70·5 | 48·9 | 43·5 | 32·7 | ||
| Duration of observation (median, years) | 8·48 | 8·78 | 8·86 | 8·92 | ||
| Gender, men (%) | 953 | 72·2 | 63·6 | 42·7 | 25·0 | <0·001 |
| Age at baseline (%) | <0·001 | |||||
| 65–69 years | 621 | 26·2 | 26·1 | 36·1 | 34·9 | |
| 70–74 years | 654 | 28·5 | 40·3 | 35·6 | 32·0 | |
| 75–97 years | 613 | 45·4 | 33·6 | 28·3 | 33·1 | |
| Ethnicity, indigenous (%) | 193 | 1·1 | 3·6 | 4·4 | 1·6 | 0·002 |
| Education (%) | <0·001 | |||||
| Illiterate | 655 | 34·1 | 31·5 | 35·7 | 42·4 | |
| Elementary school and below | 839 | 42·8 | 34·3 | 36·1 | 39·8 | |
| High school, college and above | 387 | 22·6 | 32·8 | 28·1 | 17·3 | |
| Marital status (%) | 0·001 | |||||
| Never | 45 | 1·4 | 2·7 | 2·4 | 4·2 | |
| Married and live together | 1247 | 72·5 | 65·8 | 66·9 | 56·9 | |
| Separated, divorced or widowed | 594 | 25·9 | 31·6 | 30·1 | 39·0 | |
| Perceived financial status (%) | 0·070 | |||||
| Enough or just enough | 1275 | 73·5 | 81·0 | 72·4 | 69·9 | |
| Some difficulty | 451 | 18·9 | 14·3 | 20·9 | 21·1 | |
| Very difficult | 101 | 2·9 | 2·4 | 5·3 | 6·7 | |
ID, incidence density.
† Percentages are weighted to reflect their representation in the population.
‡ Total sample size is 1888; cases with missing values were not included for the relevant variable.
§ From χ 2 test (SUDAAN version 10·0; RTI International).
Table 2 Behavioural characteristics and health status by cooking frequency: free-living elderly participants aged ≥65 years (n 1888), Elderly Nutrition and Health Survey in Taiwan, 1999–2000Footnote †
| Weekly cooking frequency | ||||||
| Descriptor | n‡ | Never | 1–2 times | 3–5 times | >5 times | P§ |
| Alcohol drinker (%) | <0·001 | |||||
| Never | 1386 | 69·7 | 65·6 | 77·0 | 85·9 | |
| Former | 126 | 9·7 | 8·2 | 4·5 | 2·4 | |
| Current | 372 | 20·6 | 25·5 | 17·6 | 11·4 | |
| Smoker (%) | <0·001 | |||||
| Never | 1226 | 49·3 | 59·1 | 71·7 | 79·6 | |
| Former | 239 | 20·9 | 16·1 | 9·4 | 8·5 | |
| Current | 414 | 29·6 | 24·8 | 18·0 | 11·6 | |
| Physical functioning score (%) | <0·001 | |||||
| <45 | 480 | 32·1 | 19·5 | 17·6 | 21·2 | |
| 45–53·9 | 596 | 26·5 | 31·0 | 30·5 | 37·8 | |
| 54–57·9 | 507 | 22·7 | 28·6 | 33·9 | 26·7 | |
| ≥58 | 274 | 15·7 | 20·3 | 17·2 | 14·4 | |
| SPMSQ (%) | <0·001 | |||||
| 0 errors | 974 | 52·6 | 64·9 | 59·7 | 53·5 | |
| 1–2 errors | 538 | 25·4 | 21·6 | 25·9 | 30·3 | |
| ≥3 errors | 357 | 20·5 | 13·5 | 13·1 | 16·2 | |
| Transportation (%) | <0·001 | |||||
| Never go out | 149 | 16·1 | 4·8 | 2·9 | 4·3 | |
| Private vehicle (motorcycle or car) | 911 | 52·0 | 48·2 | 53·2 | 37·4 | |
| Public transportation | 429 | 12·6 | 24·0 | 19·3 | 26·2 | |
| Bicycle | 167 | 11·6 | 8·4 | 8·2 | 13·4 | |
| Walking | 231 | 7·8 | 14·6 | 16·4 | 18·7 | |
| Weekly shopping frequency (%) | <0·001 | |||||
| Less than once | 923 | 61·7 | 43·4 | 28·4 | 33·3 | |
| Once | 264 | 9·2 | 15·5 | 19·0 | 15·0 | |
| 2–4 times | 391 | 15·1 | 24·4 | 32·5 | 27·2 | |
| Every day | 278 | 11·7 | 15·0 | 15·3 | 23·8 | |
| BMI (%) | <0·001 | |||||
| <18·5 kg/m2 | 101 | 5·6 | 3·8 | 2·4 | 6·9 | |
| 18·5–23·9 kg/m2 | 646 | 38·0 | 35·5 | 39·8 | 34·6 | |
| 24·0–26·9 kg/m2 | 416 | 17·8 | 26·2 | 19·7 | 24·5 | |
| ≥27·0 kg/m2 | 255 | 10·8 | 11·3 | 19·6 | 13·6 | |
SPMSQ, Short Portable Mental Status Questionnaire.
† Percentages are weighted to reflect their representation in the population.
‡ Total sample size is 1888; cases with missing values were not included for the relevant variable.
§ From χ 2 test (SUDAAN version 10·0; RTI International).
It can be seen that those who reported to cook most frequently prepared food themselves, dined with a spouse but not with others, rarely paid attention to nutrition knowledge and had no chewing difficulty. In terms of food and nutrient intakes, frequent cooking was associated with higher consumption of fat and oil and vegetables, but lower meat intake. The nutrient densities (per 4184 kJ/1000 kcal) of those who cooked most frequently were high in dietary fibre, vitamin C and Ca, and lower in cholesterol (Table 3).
Table 3 Food and nutritional characteristics and health status by cooking frequency: free-living elderly participants aged ≥65 years (n 1888), Elderly Nutrition and Health Survey in Taiwan, 1999–2000Footnote †
| Weekly cooking frequency | ||||||
| Descriptor | n‡ | Never | 1–2 times | 3–5 times | >5 times | P§ |
| Food preparer (%) | <0·001 | |||||
| No self-cooked food | 115 | 15·1 | 5·2 | 1·6 | 0·2 | |
| Self | 752 | 8·6 | 24·1 | 52·1 | 84·6 | |
| Spouse | 475 | 33·8 | 34·3 | 21·4 | 8·1 | |
| Family, friends, neighbours or housemaid | 532 | 42·5 | 36·4 | 24·9 | 7·1 | |
| Dining companions (%) | <0·001 | |||||
| None | 330 | 11·5 | 7·57 | 11·8 | 30·2 | |
| Spouse | 717 | 34·6 | 35·0 | 38·8 | 36·9 | |
| Family, friend or neighbours | 837 | 53·7 | 57·4 | 49·4 | 32·5 | |
| Eating out (%) | 0·340 | |||||
| Yes | 89 | 5·3 | 8·3 | 6·3 | 4·8 | |
| No | 1799 | 94·7 | 91·7 | 93·7 | 95·2 | |
| Nutrition knowledge awareness (%) | <0·001 | |||||
| Yes | 687 | 31·1 | 43·2 | 53·7 | 35·1 | |
| No | 1201 | 68·9 | 56·8 | 46·3 | 64·9 | |
| Chewing difficulty (%) | 0·002 | |||||
| Yes | 705 | 39·5 | 33·7 | 32·9 | 32·6 | |
| No | 1144 | 55·8 | 65·7 | 65·8 | 66·7 | |
| Mean daily food intakes per 4184 kJ (1000 kcal)∥ | ||||||
| Rice and grains (g) | 147 | 152 | 136 | 149 | 0·103 | |
| Fat and oil (g) | 8·2 | 8·0 | 9·4 | 10·5 | <0·001 | |
| Meat (g) | 49·5 | 46·8 | 49·0 | 39·2 | 0·030 | |
| Fish and shellfish (g) | 46·0 | 39·4 | 33·5 | 40·0 | 0·062 | |
| Eggs (g) | 11·1 | 11·4 | 8·4 | 8·8 | 0·196 | |
| Dairy (g) | 34·7 | 28·1 | 26·1 | 29·3 | 0·441 | |
| Soyabean products (g) | 27·5 | 29·6 | 27·0 | 24·6 | 0·808 | |
| Vegetables (g) | 204 | 210 | 191 | 245 | 0·008 | |
| Fruit (g) | 94 | 102 | 111 | 117 | 0·132 | |
| Mean daily energy intake and nutrient densities per 4184 kJ (1000 kcal) | ||||||
| Energy (kJ) | 6866 | 7795 | 6887 | 6682 | 0·005 | |
| Energy (kcal) | 1641 | 1863 | 1646 | 1597 | 0·005 | |
| Protein (g) | 43·2 | 42·2 | 43·0 | 41·5 | 0·361 | |
| Fat (g) | 29·8 | 29·5 | 27·8 | 28·3 | 0·301 | |
| Cholesterol (mg) | 142 | 135 | 123 | 116 | 0·005 | |
| Carbohydrate (g) | 139 | 140 | 145 | 145 | 0·075 | |
| Dietary fibre (g) | 11·6 | 12·4 | 12·2 | 14·0 | 0·002 | |
| Vitamin A (IU) | 6354 | 5232 | 5949 | 7338 | 0·067 | |
| Vitamin E (α-TE, mg) | 4·68 | 5·13 | 5·38 | 5·24 | 0·060 | |
| Vitamin B1 (mg) | 0·67 | 0·68 | 0·82 | 0·69 | 0·465 | |
| Vitamin B2 (mg) | 0·83 | 0·88 | 0·99 | 0·91 | 0·266 | |
| Vitamin B6 (mg) | 0·72 | 0·70 | 0·74 | 0·72 | 0·857 | |
| Vitamin C (mg) | 89 | 100 | 87 | 118 | <0·001 | |
| Ca (mg) | 379 | 414 | 443 | 442 | 0·001 | |
| Fe (mg) | 7·34 | 7·56 | 7·36 | 7·80 | 0·618 | |
| Na (mg) | 3106 | 2894 | 2981 | 3183 | 0·129 | |
| Mg (mg) | 144 | 149 | 147 | 152 | 0·255 | |
| K (mg) | 1463 | 1530 | 1429 | 1556 | 0·257 | |
α -TE, α-tocopherol equivalents.
† Percentages are weighted to reflect their representation in the population.
‡ Total sample size is 1888; cases with missing values were not included for the relevant variable.
§ From χ 2 test (SUDAAN version 10·0; RTI International).
∥ From a 24 h dietary recall.
Table 4 shows the Cox models predicting survival. The crude model shows that cooking 1–2 times/week (hazard ratio (HR) = 0·71; 95 % CI, 0·55, 0·92), 3–5 times/week (HR = 0·59; 95 % CI, 0·43, 0·80) and >5 times/week (HR = 0·47; 95 % CI, 0·36, 0·61) was associated with a significantly lower mortality risk compared with no cooking activity. Likewise, Model 1 adjusted for covariates (gender, age, education, ethnicity, alcohol drinking, smoking, region, financial status, number of co-morbidities, marital status, dinner companions, shopping and chewing ability) showed that people who cooked more than never were at a lower risk of mortality than those who did not. The lowest risk of mortality was for cooking >5 times/week (HR = 0·56; 95 % CI, 0·39, 0·81).
Table 4 Hazard ratios (HR) and 95 % confidence intervals for cooking frequency and risk of deathFootnote †: free-living elderly participants aged ≥65 years (n 1888), Elderly Nutrition and Health Survey in Taiwan, 1999–2000
| Weekly cooking frequency | |||||||
| 1–2 times | 3–5 times | >5 times | |||||
| HR | 95 % CI | HR | 95 % CI | HR | 95 % CI | P for trend | |
| Crude | 0·71* | 0·55, 0·92 | 0·59** | 0·43, 0·80 | 0·47*** | 0·36, 0·61 | <0·001 |
| Model 1‡ | 0·95 | 0·74, 1·22 | 0·74 | 0·52, 1·05 | 0·56** | 0·39, 0·81 | 0·004 |
| Model 2§ | 1·01 | 0·79, 1·30 | 0·78 | 0·54, 1·12 | 0·59** | 0·41, 0·86 | 0·009 |
| Model 3∥ | 1·01 | 0·79, 1·29 | 0·80 | 0·56, 1·13 | 0·59** | 0·41, 0·86 | 0·009 |
| Model 4¶ | 1·07 | 0·79, 1·45 | 0·90 | 0·65, 1·24 | 0·65* | 0·44, 0·95 | 0·030 |
| Model 5†† | 1·06 | 0·81, 1·37 | 0·83 | 0·59, 1·17 | 0·61** | 0·43, 0·86 | 0·008 |
| Model 6‡‡ | 0·95 | 0·32, 2·83 | 0·81 | 0·26, 2·51 | 0·60 | 0·27, 1·34 | 0·230 |
HR was significant: *P < 0·05, **P < 0·01, ***P < 0·001.
† HR estimated by Cox proportional-hazards models, with ‘Never cook’ as the reference group.
‡ Model 1: adjusted for gender, age (continuous), education, ethnicity, drinking alcohol, smoking, region, financial status, number of co-morbidities, marital status, dining companions, shopping and chewing ability.
§ Model 2: adjusted for Model 1 covariates plus physical function and cognitive function.
∥ Model 3: adjusted for Model 2 covariates plus nutrition knowledge.
¶ Model 4: Model 3 for a sub-sample in which those who died during the first 2 years were excluded (n 1775).
† †Model 5: Model 3 for a sub-sample in which those who were unable to cook due to difficulty with physical function were excluded (n 1809).
‡ ‡Model 6: Model 3 for a sub-sample which only included those who were single household elders (n 330).
Further control for physical function and cognitive function (Model 2) and nutrition knowledge (Model 3) did not alter the estimates substantially. In Model 4, although the relationship was attenuated with the exclusion of those who died in the first 2 years, those cooking most frequently still had significantly lowest risk of death (HR = 0·65; 95 % CI, 0·44, 0·95). In a sub-data analysis which included only the participants capable of cooking activity without health difficulty (Model 5), those cooking >5 times/week retained the lowest risk of death (HR = 0·61; P for trend = 0·008). For single household elders (Model 6), although not significant, most frequent cooking still had the lowest risk of mortality (HR = 0·60; P for trend = 0·230).
A gender-by-cooking frequency joint effect on survival was evident in a model with a significant interaction (P = 0·01) based on Model 3 (Fig. 1). The differences in risk of death were 24 % for men and 51 % for women when comparison was made between those who cooked >5 times/week and those who never cooked.
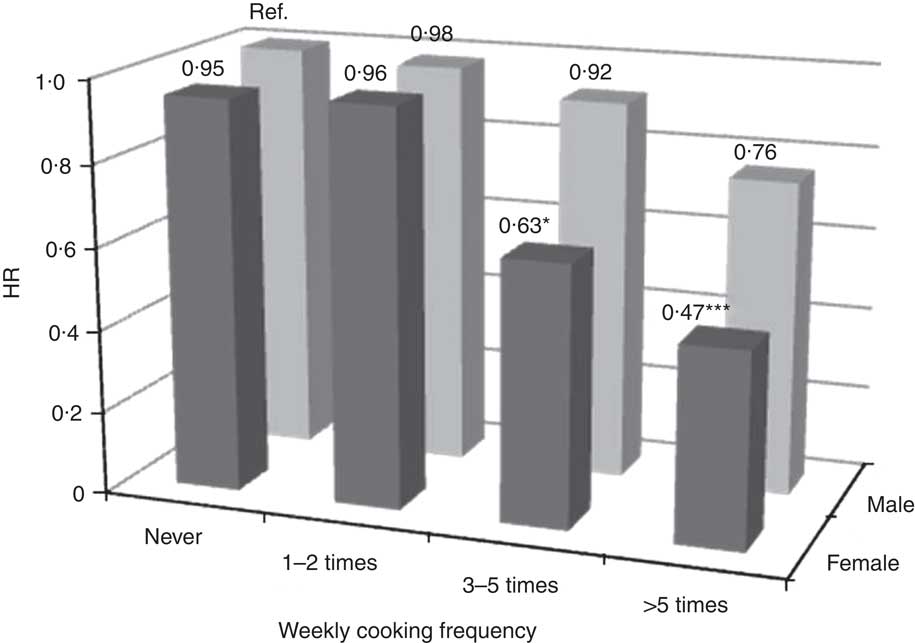
Fig. 1 Hazard ratios (HR) for eight gender–cooking categories from the model adjusted by gender, age, education, ethnicity, alcohol drinking, smoking, region, financial status, number of co-morbidities, marital status, dining companions, shopping and chewing ability, physical function, cognitive function and nutrition knowledge: free-living elderly participants aged ≥65 years (n 1888), Elderly Nutrition and Health Survey in Taiwan, 1999–2000. HR was significant: *P < 0·05, ***P <0·001. Interaction of cooking frequency and gender was significant, P = 0.01 (Ref., reference category)
Discussion
Cooking and survivorship
We explored whether food preparation could predict long-term survival in an elderly population and whether the effect would remain when functional limitations were considered. Modelling with different sets of covariates and with subset data demonstrated the robustness of the finding that highly frequent cooking activity predicts survival among elderly Taiwanese. However, this desirable effect of cooking activity is likely to benefit from physical and/or cognitive functions and from nutrition knowledge, in addition to other factors, which were evaluated in the present study.
We know that dietary diversity is associated with greater survival in this cohort( Reference Lee, Huang and Su 18 ). Along these lines, we have now found that those who cook more frequently have a better diet and more favourable nutrient densities. It is therefore possible that cooking relates to survivorship through food choice and quality; the reverse may also apply. To some extent, this relationship may also be due to a link between shopping( Reference Chang, Chen and Wahlqvist 12 ) and cooking frequencies.
The characteristics of those who cook more often are that they are women who live and eat alone, have less tertiary education (post secondary technical or university), have less substance use (alcohol or tobacco), have better physical function and walk more, and engage in frequent shopping. The gender difference might result from cultural stereotypes with regard to domestic roles like cooking, but, all the same, is an important risk factor for mortality among the principally Han Chinese in the present study. This difference has implications for men who do not cook so often, at least in Taiwan. The risk to men is underscored by a Swiss study which showed that men were, with doubtful justification, more positive about the nutritional value and taste of convenience foods compared with women( Reference Van Der Horst, Brunner and Siegrist 19 ). Nevertheless, women who cook have better food choices and nutrient densities than do men (data not shown). Since indigenous Taiwanese are also included in the present nationally representative survey, we remain cautious about any peculiar attribution of risk with regard to ethnicity.
The findings for level of education may relate to socio-economic differences where alternatives to domestic food preparation and cooking are more available for the tertiary educated. Notwithstanding this difference in cooking-related mortality by education, when adjustment is made for it, cooking frequency still matters. On the question of substance use (alcohol and tobacco), it would seem that these behaviours are associated with less cooking. It is therefore a possibility that they may exert their known adverse effects on survival, in part, by way of food preparation and cooking, or vice versa. It is interesting to consider whether active interest in food may decrease substance use. However, these several variables were all obtained at the same baseline and therefore questions of cause and effect can only be conjectural.
It is not surprising that the older aged cook less often than their younger counterparts, which may simply relate to increasing frailty and less independence. If such factors associated with age were mitigated, then cooking frequency might be maintained and longevity improved in a multifactorial fashion. In that case cooking frequency might prolong life by social pathways. Nevertheless, health outcomes are more favourable where there is a sense of control, independence and autonomy as emphasised in the WHO report on the social determinants of disease( Reference Marmot, Friel and Bell 20 ) and cooking may contribute to this kind of health advantage.
We also found a relationship between a sense of nutrition knowledge and cooking frequency. Again, cooking behaviour which takes account of health may, in part, represent the psychosocial determinants of health( Reference Mead, Gittelsohn and Roache 21 ).
Linking cooking as an activity with health impairment and survival
As indicated, there may be several pathways which link cooking to survival, if it is presumed that there may be a pathogenetic connection. These might include knowledge and skill, health and nutrition literacy, and health-seeking behaviour( Reference Mead, Gittelsohn and Roache 21 ). Health status is also likely to be important.
There will be incentives and disincentives to cooking which change with age. Some will relate to taste and smell which decline with age( Reference Epstein and Schiffman 22 ). The quest for salt may reflect these declines in taste perception( Reference Kaneda, Maeshima and Goto 23 ). Chewing, which represents a number of functional changes with age, is also an important predictor of food intake and survival and we adjusted for it with retention of the cooking–survival linkage( Reference Lee, Huang and Wahlqvist 24 ). In short, there are biological changes in food preference which are likely to influence the inclination to cook. For these reasons we have considered the link between cooking and survival not only from the beginning of the observation period in 1999–2000, but also with a 2-year delay. The findings were similar.
Limitations of the present study
Data were measured only once at baseline. However we have appraised the analysis excluding people with physical difficulty to cook (those with severe cognitive impairment were already excluded; see below) and the results remained similar. In addition, we retained in our analysis those who had help with cooking so that the apparent benefit may be achieved where there is disability by acknowledging the need to cook and securing assistance. Although our study has not provided intermediate health outcomes between cooking behaviour and mortality, we consider that the companion health behaviours and status at baseline are likely to have been persistent and contributory or otherwise to the ultimate mortality outcome.
Our sample was drawn from the community of free-living elderly and information was obtained at the household level. It does not, therefore, include institutionalized elders. In the case of those with severe cognitive impairment who remained at home, they were also not included, and this has been acknowledged in our exclusion criteria. Because of limited cooking ability and safety, they might have influenced our findings. From our modelling, we find that those with functional limitations affecting the ability to cook contributed disproportionately to low frequency-of-cooking-related mortality. Nevertheless, with comprehensive adjustments, the remainder of the population remained at risk of reduced survival on account of low frequency of cooking. Whether a household is single member or comprises several individuals, cooking frequency is of benefit to survival.
Cooking as a surrogate for other phenomena, for health status or socio-economic circumstance, is possible. Our modelling has been extensive and endeavoured to cover these possible explanatory variables, although there may yet be residual confounding present. Even so, cooking is an integrated activity by its nature, embracing a range of psychosocial (such as mood and demography) and biomedical phenomena (such as sensory inputs and disability) which stands in its own right, so minimizing the problem of residual confounding.
Conclusions
Elders who cook with moderate frequency have a lower risk of mortality. This is probably related to both better food choices and health. The present findings encourage public health policy which emphasizes the development and maintenance of cooking skills, interest and performance as a way to extend healthy lives.
Acknowledgements
The study was sponsored by the Department of Health (DOH; grant number DOH098TD-F-113-098029) and the National Health Research Institutes (NHRI), Taiwan. No author has any conflict of interest with regard to this paper. R.C.-Y.C. and M.L.W. conceived of and executed the project. R.C.-Y.C. performed the statistical analyses with supervision by M.-S.L. The paper was drafted by R.C.-Y.C. in consultation with M.L.W. M.-S.L., M.L.W. and Y.-H.C. interpreted and revised the paper. The data set was developed by Dr Wen-Harn Pan and Su-Hao Tu at Academia Sinica. The data management units at Academia Sinica, NHRI and DOH are thanked for their contribution to data protection and confidentiality protocols.


