


Global food prices rose dramatically in recent years(1), which is detrimental to poor and developing countries(Reference Cohen, Tirado and Aberman2). This pattern is explained through increased use of food crops as bio-fuels(Reference Cohen, Tirado and Aberman2, Reference Meade, Rosen and Shapouri3), high oil prices (which push up the cost of fertilizers and fuel) and the stagnation of agricultural output (low productivity per hectare)(Reference Meade, Rosen and Shapouri3). The prices of cereals and vegetable oils increased at an annual rate of about 50 % between the end of 2006 and May 2008(4). Additionally, overall global food prices increased by 83 % over the 36 months leading up to February 2008(1). In India, the global food crisis had an enormous impact on low-income populations. While the food crisis has abated elsewhere, in India wide-scale protests occurred as recently as April 2010. Thousands of people took part in a rally against rising food prices in Delhi(5).
Undernutrition is strongly related to access to food. In resource-poor settings an important determinant of undernutrition is the high price of food. Undernutrition is a major public health concern in South Asia(Reference Rosegrant and Cline6). Almost 42 % of those Asians identified as ‘hungry’ (an estimated 396 million in 2006) live in India(Reference Meade, Rosen and Shapouri3). India is home to more than 61 million stunted children (an estimated prevalence of 51 %), which accounts for 34 % of the global total(Reference Black, Allen and Bhutta7).
Access to food is an important component of household food security, which is an important measure of well-being(Reference Hoddinott and Yohannes8). Food security is a complex concept, defined as ‘when all people at all times have physical, social and economic access to sufficient, safe and nutritious food that meets their dietary needs and food preferences for an active and healthy life’. Household food security is the application of this concept to the family level, with individuals within households as the focus of concern(9). Besides access to food, the concept of food security also encompasses food availability, quality and safety, stability of food supply and food usage. On the other hand, food insecurity can be described as a household-level economic and social condition of limited or uncertain access to adequate food(Reference Nord and Coleman-Jensen10).
Food security is inextricably linked to HIV/AIDS. HIV/AIDS deprives families of their most productive household members, reducing economic growth in countries where the disease is widespread, which in turn increases the problem of food insecurity(Reference Rosegrant and Cline6). Additionally, HIV/AIDS infection increases nutritional needs(Reference Mwadime, Bijlsma and Castleman11, 12). In 2007 India had the third largest number of absolute cases of HIV/AIDS worldwide, after South Africa and Nigeria(13). Maharashtra, the province where the present study was carried out, together with Tamil Nadu and Manipur accounted for 75 % of all reported HIV infections in India(Reference Bharat, Aggleton and Tyrer14).
Lemke(Reference Lemke15) developed a model in which the underlying causes of nutrition security are conceptualized. The household triangle represents the basis for all actions at the household level. These activities, which relate to household food security, are influenced by attitudes, livelihood, household assets, available resources and capabilities. The model shows micro-, meso- and macro-level environmental determinants, including HIV/AIDS, food availability, education and information, employment and infrastructure.
Figure 1 illustrates a modified version of this model which focuses mainly on meso-level determinants addressing activities, assets and capabilities. A specific example of a household element related to food security is the activity home gardening (or own garden). Additional elements related to food security were included in the model to describe capabilities (the use of soya as a low-cost food) and assets (ownership of a pressure cooker).

Fig. 1 Underlying determinants of food security (adapted from Lemke, 2005(Reference Lemke15))
Prior to the study, three main areas of interest were identified based on discussions between co-authors and collaborating stakeholders. The first two were described as home gardening and the use of soya as a low-cost food. More than 50 % of total workers in Maharashtra are engaged in the agricultural sector. Other modes of employment can be found in manufacturing (mainly communication, transport and administration)(Reference Mishra and Panda16). Aurangabad, situated along major trucking routes, is of particular interest because of the importance of farming to the area and the potential impact on local and regional food production of spread of HIV/AIDS. In and around Aurangabad, farming land is available where several crops such as soya are grown. Maharashtra is, after Pradesh, the largest producer of soya in India(Reference Agrawal, Matlani and Agrawal17). A third area of interest was related to high fuel costs. At the time of the study in 2008, the international fuel crisis was underway(Reference Martine, Guzman and Schensul18). Energy used for cooking accounts for 92 % of the gross energy consumption in poor, urban households in Maharastra, and the demand for cooking energy is increasing annually(Reference Pohekar, Kumar and Ramachandran19). Pohekar et al. (Reference Pohekar, Kumar and Ramachandran19) identified the need for interventions in order to ensure sustainable household energy supply for cooking and describes India as an ideal location for disseminating renewable energy technologies. Exploration of pressure cooker use in the study population was therefore identified as an area of interest. Exploration of underlying determinants of household food security is essential for better targeting interventions that can improve household food security(Reference Lemke15). Thus the goal of the present study was to assess food security and household determinants of food security (in particular home gardening, use of soya in cooking and ownership of a pressure cooker) in low-income families affected by HIV/AIDS in Aurangabad, Maharashtra, India.
Methods
This research was designed as a cross-sectional pilot study among households affected by HIV/AIDS in the area of Aurangabad, Maharashtra, India. All families with a child (aged 2–16 years) who were related to the Network of People living with HIV/AIDS in Aurangabad (NAP+) were included in the study (n 163). Families who had to travel to Aurangabad for more than 3·5 h one way were excluded from the study. In 2008, eligible individuals were invited to participate in the study.
Caregivers were invited to visit an institute within easy reach and centrally located in Aurangabad, where interviews were conducted in local languages (English, Marathi or Hindi). The questionnaire included questions on food security, determinants of food security, and socio-economic and demographic descriptive information, including expenditures and ration cards. Ration cards are issued under the authority of the State Government for the purchase of essential commodities from fair price shops. Food security was assessed based on the validated eighteen-item food security core-module questionnaire (FCSM) of the US Department of Agriculture (USDA)(Reference Bickel, Nord and Price20). The adapted version of the FCSM with a 30 d recall time was used. The degree of food security status was measured by the number of answers indicating food insecurity. The FCSM was chosen for the present study because of the inclusion of specific questions distinguishing answers for adults (hunger, skipped meals) v. children, such as affording balanced meals for the child (v. self), cutting size of the child's meal, skipping the child's meal, child not eating enough, the child being hungry and the child not eating for a whole day. It was decided that the USDA FCSM would be applicable to the study as it provided important information related to food security focusing on children. The outcome measure of the questionnaire using the four categories as developed in 2005 by USDA are: ‘high food security’, ‘marginal food security’, ‘low food security’ and ‘very low food security’. The first two categories are defined as ‘food secure’, whereas the last two categories are defined as ‘food insecure’(Reference Nord, Andrews and Carlson21).
Additionally to the household food security survey, a semi-structured questionnaire with closed- as well as open-ended questions was used regarding determinants of household food security based on the framework designed by Lemke(Reference Lemke15). Prior to the study, co-authors C.M.D. and S.J. met with local stakeholders (NAP+) to provide a description of the population's behaviours, assets and capabilities that could improve food security to clarify the aims of the study. The discussion focused on utilization of low-cost foods, access to garden space and means of addressing household fuel costs. Soya was identified as a locally grown, low-cost, readily available food that may be underutilized, as it is not part of the local food culture. Furthermore, the population was identified as primarily agricultural and it was hypothesized that even low-income households may have access to land for gardening. Finally, pressure cookers were identified as a possible means of reducing fuel costs. Based on the outcome of this stakeholder meeting, the main focus of the study was to collect data to determine associations between food security and possibilities for home gardening, use of soya and pressure cooker ownership.
The child's caregiver was asked about total household income. However, given the fact that caregivers may not know the family income, this question was asked based on broad classifications. In addition, a number of simple questions relevant to household socio-economic status (SES) were asked. SES was measured based on the method used by Hargreaves et al. (Reference Hargreaves, Morison and Rutenburg22), which combines educational status, household utilities (water and electricity) and occupation. Educational attainment has been considered a proxy measure for SES. Additionally, educational attainment and later life choices will affect earning capacity(Reference Hargreaves, Morison and Rutenburg22). Household utilities were based on answers to questions regarding running water and/or a toilet in the house and ownership of electrical appliances (blender, television or refrigerator). We have not included the third aspect, occupation, as part of the SES index because most of the population would fit into the same occupation classification, which was household work.
SES level was scored by combining educational level (score ranging from 0 to 2) and household utilities (score ranging from 0 to 2). Those with no or some primary school education were given an education score of 0, those who completed primary or secondary school were given a score of 1, and those with higher education or above were given a score of 2. The score for the household utilities component was based on a combination of answers related to indoor plumbing and electrical appliances, with a score of 0 indicating no indoor plumbing and none of the three electrical appliances queried (blender, television or refrigerator). Households with either indoor plumbing or one of the three electrical appliances (blender, television or refrigerator) were given a score of 1, and those with both indoor plumbing and any one of the appliances were given 2 points. The final result, adding the two scores, was a five-level scale ranging from 0 to 4. The median score in this population was 2; a score of 0 or 1 was used to identify low-SES households.
The SPSS statistical software package version 17·0 (SPSS Inc., Chicago, IL, USA) was used for data cleaning and analysis. Associations between food security and home gardening, use of soya and pressure cooker ownership were identified using χ 2 tests and logistic analysis. Significance was measured at P < 0·05. Logistic analysis tested for confounding by SES, as measured by the SES score.
Results
Socio-economic and demographic variables
Out of the 163 households invited, there were twenty-five non-respondents (15·3 %). Five additional households were excluded due to lack of consent or incomplete interviews. The mean age of the caregivers was 34 years, and the highest proportion of caregivers (59·2 %) were mothers accompanying their child to the centre (Table 1). The majority of the children (61·4 %) were boys. Mean age of the children was 8·3 years and 75·4 % of all children were going to school. Most households (39·7 %) consisted of both people with a vegetarian diet and people with a non-vegetarian diet within the same household (mixed). Wood was used by most households as cooking fuel (47·7 %).
Table 1 Population characteristics: low-income households affected by HIV/AIDS, Aurangabad, Maharashtra, India, 2008
FS, food security.
The average number of people in the household was 5·9, with 4·2 people eating together on average (Table 2). Most households (78·4 %) earned less than INR 3000/month ($US 76·92/month according to 2008 exchange rates(23)), of which INR 549·3/month ($US 14·08/month) was spent on food per person eating together. Expenditures on health care per person in the household were INR 123·0/month ($US 3·15/month). It is important to note that reported expenditures on food and health care exceeded the reported income category. Education level of the caregivers was low, 48·2 % had only a primary school education or less. A large proportion of the caregivers (30·7 %) did household work or were farmers (27·6 %). Many households were using a ration card (44·2 %).
Table 2 Household socio-economic and demographic characteristics: low-income households affected by HIV/AIDS, Aurangabad, Maharashtra, India, 2008
SES, socio-economic status; FS, food security.
*Refers to mean and currency = INR.
†Refers to mean.
Food security
Out of the 133 households included in the study, only one household (0·8 %) was marginally food secure and was therefore excluded. The basic characteristics of this household do not deviate from those of the households included in the study. Of the remaining 132 households, 40·2 % were found to have very low food security. Table 3 provides an overview of the USDA food security items as asked. Over 30 % of the adults as well as children in the study population had to skip their meal at least once in the past 30 d. Two households had to skip their meal every other day in the past 30 d. A large proportion (23·5 %) did not eat for a whole day (from sunset to sundown), and in one household this happened up to 15 d in the past 30 d. More than half of the caregivers could not afford enough food and as a result the child did not eat enough.
Table 3 Food security items askedFootnote * (‘In the past 30 d did you…?’) to low-income households affected by HIV/AIDS, Aurangabad, Maharashtra, India, 2008
* From the eighteen-item food security core-module questionnaire of the US Department of Agriculture.
† n 131.
Determinants of food security
Only 13·7 % of the households grew foods for own use. Caregivers reported that home gardens were used to grow vegetables (spinach, aubergine, okra, tomato and cabbage) and fruits (guava, banana, lemon and sweet lime). Some caregivers reported not having a home garden because they did not need more food or could afford to buy all foods needed (23·4 %). Others mentioned a lack of resources to explain not growing foods for own use, such as no available land (68·1 %) or having no money for seeds or supplies (7·8 %). However, lack of knowledge was also included as a reason. On average, 38·2 % of the households used soya and a majority owned a pressure cooker (64·4 %).
Figure 2 shows the prevalences of households by low and very low food security, according to the three main exposures of interest. It can be seen that fewer households with very low food security reported home gardening, use of soya or owning a pressure cooker compared with households with low food security. Odds ratios were also used to show the strength of the association, controlling for confounding by SES. In this population all households were food insecure, thus the comparisons are between very low food security v. low food security. Growing foods for own use was not significantly associated with very low food security in these households (OR = 0·59; 95 % CI 0·19, 1·79) also after controlling for SES (OR = 0·44; 95 % CI 0·13, 1·51). Households using soya were less likely to have very low food security (OR = 0·45; 95 % CI 0·21, 0·97). However, after controlling for SES the association was attenuated and no longer statistically significant (OR = 0·72; 95 % CI 0·31, 1·69). Pressure cooker ownership was strongly protective against having very low food security (as compared with low food security; OR = 0·15; 95 % CI 0·07, 0·34). The association remained strong and statistically significant even after controlling for SES (OR = 0·27; 95 % CI 0·11, 0·64).
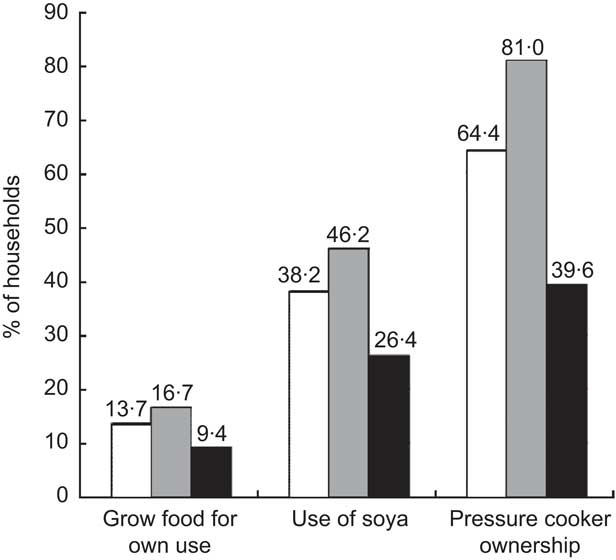
Fig. 2 Household-level factors by food security level (□, total sample; ![]() , low food security; ▪, very low food security) among low-income households affected by HIV/AIDS, Aurangabad, Maharashtra, India, 2008
, low food security; ▪, very low food security) among low-income households affected by HIV/AIDS, Aurangabad, Maharashtra, India, 2008
Additional analysis was carried out to further explore the associations between food security and reported shortage of cooking fuel (Fig. 3). In households with very low food security, more than half (52·8 %) of the households had to cut their meal size due to cooking fuel shortages. In contrast, 26·4 % of the very low food secure households had no shortages of cooking fuel and 20·8 % had cooking fuel shortages but did not have to reduce the meal size. Compared with households with no cooking fuel shortages, those having to cut meal size due to cooking fuel shortages were 4·38 times (95 % CI 1·68, 11·44) more likely to have very low food security. After controlling for SES, the association was even stronger (OR = 4·67) and remained statistically significant (95 % CI 1·62, 13·44).
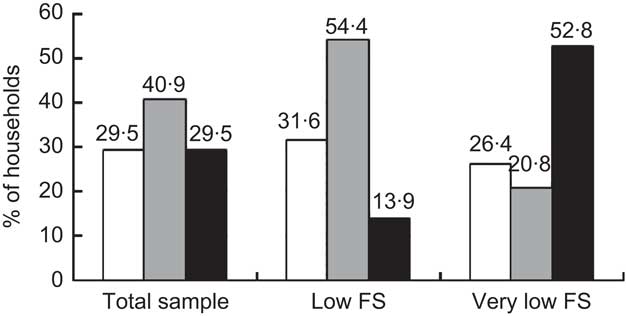
Fig. 3 Households reporting cooking fuel shortage (□, no; ![]() , yes, not cut size of meal; ▪, yes, cut size of meal) by food security (FS) level among low-income households affected by HIV/AIDS, Aurangabad, Maharashtra, India, 2008
, yes, not cut size of meal; ▪, yes, cut size of meal) by food security (FS) level among low-income households affected by HIV/AIDS, Aurangabad, Maharashtra, India, 2008
However, there was a second type of households with cooking fuel shortages, i.e. households that did not have to cut meal size. Compared with those households without any cooking fuel shortage, these households were less likely to have very low food security (OR = 0·25). However, these results were not statistically significant (95 % CI 0·16, 1·10) also after controlling for SES (OR = 0·53; 95 % CI 0·19, 1·47).
Discussion
In the present study, nearly all of the households (99·2 %) were categorized as food insecure (low or very low food security). When controlled for SES, both home gardening and soya intake were associated with better food security. While these results were not statistically significant, it is logical that gardening would increase household food security. Additionally, soya is cheaper than traditional dahls and pulses and consuming low-cost foods such as soya may stretch the household food budget and improve food security. More research is needed to explain these results. However, pressure cooker ownership showed a strong and significant protective association with lower food security, even after controlling for SES (OR = 0·15; 95 % CI 0·07, 0·34).
SES is a likely confounder related to food security level and its possible determinants. However, the measurement of SES is challenging. Although a SES scale appropriate to the Indian population was developed by Tiwari et al. (Reference Tiwari, Kumar and Kumar24), the detailed information required (related to housing, land, assets, education, occupation, monthly income, social participation, knowledge of social issues and involvement in social activities) was beyond the scope of the present study. Many scales, such as the one developed by Chakraborty et al. (Reference Chakraborty, Bose and Bisai25), use family income as an indicator for SES. In our study, however, reported income was not consistent with other results. Namely, reported expenditures on health care and food costs exceeded the reported income category. Therefore, the classification of SES used multiple measures, including assets, education and type of housing. The scale used in our study followed the method of Hargreaves et al. (Reference Hargreaves, Morison and Rutenburg22) as an indicator of SES in the study population.
Out of all households invited (n 163), the level of non-response was 15·3 %. A limitation of the study could have been the setting where time to travel to the location of the interview would be too extensive for the caregiver to participate. Comparisons with other studies in resource-poor settings confirm that our study population has lower food security. In an Indonesian population, Rosalina et al. (Reference Rosalina, Wibowo and Kielmann26) identified 88·9 % of the severely poor to be food insecure. Pasricha et al. (Reference Pasricha, Black and Muthayya27) found 52·7 % of a rural Indian population to be food insecure. However, these studies used different measures of food security and therefore results are not directly comparable. Baig-Ansari et al.(Reference Baig-Ansari, Rahbar and Bhutta28) carried out a study in a squatter camp in Karachi, Pakistan using the same household food-security module as used in our study(Reference Bickel, Nord and Price20). While 99·2 % of the households in our study were categorized as food insecure, only 41·9 % in the Karachi study were categorized as food insecure. Although no food assistance was promised, results of our study could be biased as some study participants may have perceived that expressing a need for food might result in assistance from co-operating non-governmental organizations. However, given that these households are all affected by HIV/AIDS, with additional costs related to medical care and missed days of work due to illness, the high prevalence of food insecurity is not surprising. Independent of the food security questions, a number of indicators confirm this population as being extremely disadvantaged. Only 50·8 % of the households in our study had a tap in the house, compared with the study in Karachi, where 65·9 % of the population had a tap. Households living on less than $US 1/person per d are considered below the poverty level. Given the exchange rate in 2008 of INR 39 to $US 1(23), the poverty level was INR 1170/person per month. Thus, the poverty level for the average household size of 5·9 would be INR 6903/month. In this population, 93·8 % of the households earned less than INR 5000/month.
While both household income and food expenditures are likely to be under-reported, the results were consistent with the high prevalence of households with a ration card (44·2 %). Furthermore, evidence from reported income as well as food expenditures indicated a population living in poverty. The mean household per capita expenditure on food was INR 549/month, translating to $US 14/month(23) or 50 cents spent on food daily per person. This food expenditure, together with household income and food security results, indicated a population with insufficient resources to meet basic food needs. Keeping the recent increases in food prices in mind(1), our findings seem to be representative for the Indian urban population. The estimated per capita consumer expenditure on food in 2005–2006 was between INR 422 and INR 527 monthly(29) or about $US 9–12/month according to 2005 exchange rates(30).
Our results indicate differences between adults and children in reported experience of hunger in these food-insecure households. Although answers for adults and children were similar for most other questions, 31·1 % of caregivers reported that they were hungry but did not eat while only 13·7 % reported that the child was ever hungry. Coates et al. (Reference Coates, Frongillo and Rogers31) identified questions related to hunger as the domain of food security reported least often and indicating the most severe level of food insecurity. In a study of aspects of food security reported in multiple countries, the authors described a pattern in the response frequencies showing questions related to ‘worry’ as most prevalent, followed by eating lower-quality food, eating less food and feelings of hunger. Looking only at the answers given for adults in the present study, worry was also most prevalent (92·4 %) followed by not being able to afford a balanced meal (80·3 %), eating less (46·2 %) or being hungry but not able to eat (31·1 %). Although respondents reported themselves and the child as eating less, fewer reported being hungry and fewer still reported the child was ever hungry. The pattern of answers for adults v. children could indicate either that caregivers were giving socially desirable answers (that the child does not go hungry) or that this represents a coping strategy by which caregivers ate less to protect children from hunger.
Even though only one household was found to be marginally food secure, a large percentage of the caregivers (23·4 %) reported not growing foods for own use because they did not need more food or could afford to buy all foods needed. This discrepancy could possibly be explained by a difference in the types of food that are grown in home gardens and the type of food households are short of and cause cutting of meal size or skipping of meals. Furthermore, a majority of those who did not do home gardening did not have land available. Given these responses, introducing home gardening would not be a viable intervention. In contrast, a considerable amount of socio-economic gain can be achieved with better dissemination of various cooking energy alternatives(Reference Pohekar, Kumar and Ramachandran19).
While a number of interventions have focused on home gardening to improve household food security(Reference Berti, Krasevec and FitzGerald32, Reference Marsh33), no studies have explored the potential of pressure cookers. Our results indicate that pressure cookers may be a potential promising new avenue of intervention. The use of pressure cookers has shown to reduce cooking time(Reference Das, Subramanian and Chakkaravarthi34) which will contribute to a healthier household environment. Several respiratory and chronic diseases in developing countries have been attributed to higher levels of indoor pollution. It is very well accepted that traditional cooking stoves release a variety of pollutants in the indoor environment(Reference Pohekar, Kumar and Ramachandran19). Promoting a healthy environment, especially in an HIV-affected population, will decrease the number of missed days of work due to illness and indirectly improve food security status.
The protective association between pressure cooker ownership and better food security, independent of SES, was consistent with the finding that cooking fuel shortage was associated with lower household food security. Although these results are based on cross-sectional associations, pressure cookers are known to reduce water evaporation loss by 87 % compared with open cooking, save household cooking fuel costs and lead to savings in energy of 44 %(Reference Das, Subramanian and Chakkaravarthi34). This is a major contribution to decreasing total household energy requirements in a country where more than half of the energy consumed in households is used for cooking(Reference Pokharel35). These savings could directly improve food security by increasing the money available for food. Extrapolating from 2005–2006 data on fuel expenditures(29), a reduction of 44 % in fuel costs(Reference Das, Subramanian and Chakkaravarthi34) translates to over 10 % of the budget spent on food amended by savings in fuel. This is most probably an underestimation of the actual amount saved due to the fuel crisis(Reference Cohen, Tirado and Aberman2) and increases in food prices in 2008(1).
Savings in energy expenditures could indirectly improve food security through fewer missed days of work related to spending money on health care. In a population vulnerable to fluctuations in cooking fuel prices, a pressure cooker is an ideal means of reducing household fuel costs. These savings could make money available for food and medicine. Intervention studies, using a randomized controlled trial design, could help clarify the causal relationships between pressure cookers and improved food security.
Acknowledgements
Sources of funding: This project was made possible through funding of the Neys van Hoogstraten Foundation of The Netherlands. Conflict of interest declaration: None of the collaborators had any conflict of interest. Author contributions: S.L.v.E. contributed to the conceptualization of the project, was involved in revising the questionnaire, carried out the anthropometric analysis, did the statistical analysis and drafted the initial paper. M.v.d.H. contributed to the conceptualization of the project, was involved in revising the questionnaire, carried out the anthropometric analysis and contributed to the interpretation of results. S.J. was involved in developing the initial idea, identified the key stakeholders who contributed to the idea, helped to develop the initial questionnaire, oversaw training of data collection and contributed to the understanding of results. C.M.D. was involved in developing the initial idea, helped to develop the initial questionnaires, helped to oversee the analysis and write-up of the article and assisted in the write-up and revision of all parts of the article. M.C.P. was involved in overseeing the analysis and write-up, contributed to the understanding and presentation of results and extensively re-wrote and revised all parts of the article. Acknowledgments: The authors thank Mr Leo Varghese for the logistical support and assistance without which this study would not have been possible. Furthermore, the authors thank the Neys van Hoogstraten Foundation of The Netherlands for the funding that made this project possible. Thanks also go to Shomasree Dey, Alefiya Badruddin Khambaty, Chhaya Kushwaha, Phrasant Shinde, the Wockhardt–Harvard Medical International HIV/AIDS Education and Research Foundation (WHARF) and the Network of Aurangabad People Living with HIV/AIDS (NAP+). Furthermore, the authors would like to acknowledge the Government Medical College of Aurangabad and the students who helped with data collection, and especially thank the study participants.


