


The complex role of the human intestinal microbiota is emerging and its functions are now more and more established when considering energy metabolism, nutrient digestion, vitamin synthesis, epithelial defences and immune responses(Reference Bik1). The composition and function of the human-associated microbiota are considered as a partner of the host in order to fight infection and to improve inflammatory processes and conditions. There is an increasing body of evidence linking the physiopathology of metabolic diseases such as obesity or inflammatory bowel disease and the gut microbiota(Reference DiBaise, Zhang and Crowell2).
Through resistance to digestion in the upper gastrointestinal tract, non-digestible carbohydrates reach the colon intact to undergo a complete or partial fermentation in the large intestine. If they selectively stimulate the growth and/or the activity of the beneficial, health-promoting members of the gut microbiota, they meet the criteria of prebiotics(Reference Gibson and Roberfroid3–Reference Roberfroid, Bornet and Bouley6). β(2 → 1)-Fructans, which include inulin and fructo-oligosaccharides (FOS), are considered to be prebiotics, while xylo-oligosaccharides (XOS) are considered as candidate prebiotics(Reference Lomax and Calder7).
Mice fed a high-fat diet exhibited a significant increase in plasma lipopolysaccharides (LPS) defined as metabolic endotoxaemia(Reference Hotamisligil8, Reference Creely, McTernan and Kusminski9) and a modified gut microbiota profile(Reference Cani, Neyrinck and Fava10). Bifidobacterium levels were significantly reduced in high-fat-fed mice v. animals that received the standard high-carbohydrate diet(Reference Cani, Bibiloni and Knauf11). In healthy men, a high-fat meal increases the baseline of LPS concentration, and low-grade endotoxaemia may contribute to the postprandial inflammatory state(Reference Erridge, Attina and Spickett12). Obesity and insulin resistance are associated with low-grade chronic systemic inflammation(Reference Hotamisligil and Erbay13, Reference Shoelson and Goldfine14). Animal studies suggest that the development of obesity and associated low-grade inflammation could trigger the expression of inflammatory cytokines (e.g. TNF-α) via a CD14/Toll-like receptor 4-dependent mechanism(Reference Chow, Young and Golenbock15, Reference Wright, Ramos and Tobias16). In mice fed a high-fat diet, fructans supplementation induces a decrease in circulating LPS and pro-inflammatory cytokines(Reference Lomax and Calder7, Reference Cani, Neyrinck and Fava10). Thus the gut microbiota could be implicated in obesity and insulin resistance through several mechanisms, including LPS-induced micro-inflammation.
Modulation of the immune function by prebiotics has not been fully investigated and most data originate from animal models. To our knowledge, there have been no studies published on the effect of prebiotics either on circulating LPS or simultaneously on cytokine expression in healthy human subjects consuming a stable fat-and-carbohydrate diet.
The aims of this study were (1) to establish the prebiotic effect of a new XOS compound and of a mixture of inulin and XOS (INU–XOS); and (2) to determine their role on endotoxaemia and immune parameters in healthy subjects consuming a normal and stable fat diet.
Subjects and methods
A total of sixty healthy volunteers (thirty-four women who declared not to be pregnant and twenty-six men) aged 18–24 years (20·1 (sem 1·6) years) participated in the study. They were students at the Institut Polytechnique LaSalle Beauvais. They were enrolled in October 2008 with the intervention phase through November to December 2008.
Volunteers were eligible for enrolment if they met all the inclusion criteria: stable weight; BMI 18·5–27 kg/m2; fibre intake 13–18 g/d. Exclusion criteria were ongoing severe disease; gastrointestinal, bladder and pancreatic diseases; abdominal or gut surgery within the last 12 months; diarrhoea, constipation or recurrent abdominal pains; recent ( < 3 months) gastrointestinal food-borne illness; antibiotherapy or use of laxative drug within the last 6 months; diabetes mellitus; use of pre- or probiotic supplements; specific functional probiotic- or prebiotic-rich foods; alcohol consumption (>3 drinks/d); orange juice intolerance.
The study was performed on-site at the Institut Polytechnique LaSalle Beauvais for the meals and at the Beauvais Hospital for samples collection. This study was conducted according to the guidelines laid down in the Declaration of Helsinki and all procedures involving human subjects were approved by the Regional Ethics Committee for North-West France based at the Lille University Hospital. Written informed consent was obtained from all participants at the time of recruitment and the study protocol (2007-A00273-50) was approved by the Regional Ethics Committee for North-West France based at the Lille University Hospital.
Study design
The study followed a randomised, parallel, placebo-controlled, double-blind design.
A semi-quantitative dietary survey was performed at enrolment in order to assess the usual dietary fibre intake in order to select the target population consuming 13–18 g/d. The volunteers were instructed to follow dietary guidelines to maintain their fibre intake during a 2-week stabilisation phase and then throughout the intervention. As all volunteers were living on-site and taking all meals at the Institute cafeteria, the content of each meal could be closely controlled during the week. A 3 d dietary survey was performed at the end of the stabilisation period and repeated at the end of the intervention in order to assess the stability of the diet.
The sixty volunteers were randomly assigned to one of three groups. The first group (placebo) received a daily dose of 6·64 g of wheat maltodextrins (Glucidex 12 DE; Roquette Frères); the second group (XOS) received 6·64 g of a XOS-enriched compound derived from wheat arabinoxylans (Opti'flor®; DF3 SAS); and the third group (INU–XOS) received 6·64 g of a mixture containing inulin-type fructans (Fibruline® Instant; Cosucra-Groupe Warcoing), XOS (Opti'flor®; DF3 SAS) and maltodextrins. Fibruline® Instant is a chicory inulin with a degree of polymerisation (DP) ranging from 2 to 60 and an average DP of about 10. Fibruline® Instant is a powder with a DM of 96 % and contains (on DM) 90 % of inulin. Opti'flor® is characterised by a DM of 95 %, a XOS content of 80 % on DM, an average DP above 10 and by an arabinose:xylose ratio above 0·5. These products were taken in two daily doses (130 ml) before the breakfast and evening meal. The total daily dose of the active ingredient was 5 g XOS (XOS group) or 3 g inulin+1 g XOS (INU–XOS group).
Products were prepared daily by addition to a commercially available orange juice (100 % pure juice, no pulp) and stored at 8°C before distribution. Products were ingested in front of an independent study monitor. For the weekend, products were prepared in quantity sufficient for 2 d and stored in a coolbox. Subjects collected the coolbox before leaving campus and signed a compliance form after consuming each dose. The taste of the three products (fibre or maltodextrins+juice) was assessed through organoleptic methods and was found not to be different.
Data collection
The measurements were done at inclusion (V0), and then on the first day of treatment (V1), after 2 weeks (V2) and after 4 weeks (V3) of treatment.
Clinical data
Weight, blood pressure and heart rate (two measurements after a 3 min rest) were assessed at inclusion, and then at V1, V2 and V3. Gastrointestinal well-being was assessed at V1, V2 and V3 with a visual-analogue rating scale for nine items including flatulence, bloating, rumbling, abdominal cramps, nausea, a global digestive tolerance score calculated from these five previous items, stool consistency, stool frequency, and general well-being through disturbances in usual and professional activities as well as disturbances in personal and social activities. The questionnaire was based on criteria measured by Paineau et al. (Reference Paineau, Payen and Panserieu17). Items were scored on a linear scale measuring 10 cm.
Biological data
Faecal samples
Faecal samples were collected at each visit (V1 to V3) in an aseptic container. They were kept below 8°C and aliquoted within 6 h for the various tests before being stored at − 20 or − 80°C until further analysis. DM, pH and bacterial content were measured at each visit, SCFA were measured at V1 and V3, while p-cresol and phenol, α-glucosidase and β-glucuronidase activities, and secretory IgA (s-IgA) were only measured at V3.
Blood samples
Blood samples were collected in heparin-lined vacuum collection tubes (7 ml) during visits V1 and V3. Whole blood was used to measure expression of cytokines after a LPS challenge. LPS is known to stimulate the expression of interferon-γ, TNF-α, IL-1β, IL-8 and IL-12 while inhibiting IL-4, IL-10 and IL-13. TNF-α and IL-10 were measured both at V1 and V3, while the other cytokines were measured at V3 only. The remaining blood was then centrifuged (3500 rpm, 5 min) and plasma collected to measure circulating LPS at V3.
Measurements
Faecal measurements
DM and pH
Both DM and pH were measured on fresh samples. A 2 g sample was placed in a pre-weighted aluminium cup. The sample was heat-dried at 110°C for 1 h, and then at 80°C for 48 h and placed in a desiccator to cool down, after which the DM was weighed. A 0·5 g sample was homogenised in 5 ml double distilled water (deionised water) before measuring the pH.
Total microbiota and composition
Total bacterial count and specific bacterial profile were analysed by quantitative PCR, as described by Pouillart et al. (Reference Pouillart, Dépeint and Abdelnour18). DNA was extracted from 200 mg of faecal sample using the QiaAmp DNA stool mini kit (Qiagen) according to the manufacturer's instructions. Then, 100 ng of DNA from each sample were amplified using selected primers and probe sets detailed in Table 1 or previously published(Reference Pouillart, Dépeint and Abdelnour18).
Table 1 Details of primers and probes used in quantitative PCR to amplify 16 s rRNA
* Primer and probe choice was established using the following website: www.ncbi.nlm.nih.gov/BLAST/
† Primers and probes were validated in silico against the sequence of all known bacterial strains (ncbi/BLAST, 2004–5) and in vitro for cross-reactivity against the full panel of reference strains.
Cycle quantification data were quantified against standard curves using selected bacterial strains. Data were expressed as log10 (copy number)/g DM.
SCFA (C2 (acetic acid), C3 (propionic acid), C4 (butyric acid))
Volatile fatty acids were extracted and measured according to Scheppach et al. (Reference Scheppach, Fabian and Kasper19) with some variants. A 2 g sample was homogenised in 5 ml double distilled water and then centrifuged at 4500 g for 5 min. The supernatant was acidified to pH 2 using 25 μl of H2SO4 (2 m) and injected into a BP21 gas chromatography column (length: 30 m, inner diameter: 530 μm, film: 1 μm) along with an internal standard (4-hydroxy-4-methyl-2-pentanone). H2 was supplied as the carrier gas at a flow rate of 1·5 ml/min. The initial oven temperature was 135°C and was kept there for 6 min, and then raised to 180°C by 25°C/min and held there for 1 min, and then further increased to 230°C by 25°C/min, and finally held at 230°C for 1 min. Glass wool (Supelco) was inserted in the glass liner of the split injection port. The temperatures of the flame ionisation detector and the injection port were 240 and 280°C, respectively. The flow rates of H2 and air as make-up gas were 40 and 400 ml/min, respectively. The injected sample volume for GC (AutoSystem XL; PerkinElmer) analysis was 1 μl, and the running time for each analysis was about 10 min. The different SCFA were identified according to the retention time of the various elution peaks. Quantification was obtained by comparison to a standard curve.
p-Cresol and phenol
The p-cresol and phenol were determined following the techniques established previously(Reference Birkett, Jones and Muir20).
α-Glucosidase and β-glucuronidase activities
The enzyme activities were measured as described by Djouzi et al. (Reference Djouzi, Andrieux and Degivry21) with some modifications. A 1 g sample was homogenised in 10 ml of 0·1 m-potassium phosphate buffer, pH 7·2 and sonicated for 30 s before centrifugation at 10 000 g for 20 min at 4°C. The supernatant was collected and incubated for 15 min at 30°C with an equal volume of 4 mm substrate. The reaction was stopped on ice with potassium carbonate (1 m) in double distilled water. Absorbance at 400 nm was plotted against a standard curve of p-nitrophenyl to measure the production rate of the reaction, and thus the enzymatic activity. Specific substrates were p-nitrophenyl-α-d-glucopyranoside for α-glucosidase and p-nitrophenyl-β-d-glucuronide for β-glucuronidase.
Secretory IgA
A 100 mg sample was homogenised and processed using the s-IgA ELISA kit (Immunodiagnostik) according to the instruction manual.
Other biological measurements
Cytokines
Whole blood samples were incubated with 1 ng/ml LPS at 37°C for 6 h (TNF-α) and 24 h (all other cytokines) in a rolling incubator. One reference sample was incubated without LPS(Reference Abdel Nour, Dépeint and Barbour22). Incubation was stopped by adding 500 μl of QIAzol (Qiagen). Total RNA was isolated using the RNeasy lipid mini kit (Qiagen) according to the user manual. Recombinant complementary DNA was obtained from 100 ng of RNA using the Quantitect reverse transcriptase kit (Qiagen) according to the user manual. Finally, 100 ng complementary DNA was amplified against designed primer sets (Applied Biosystems). Relative expression for the cytokines was calculated against the untreated reference sample. Both β-actin and peptidylprolyl isomerise A were used as reference genes. For all genes, efficiency of the quantitative PCR was between 96 and 106 %.
Lipopolysaccharides
Circulating LPS was measured in plasma samples using the limulus amebocyle lysate chromogenic endpoint assay (Hycult) according to the manufacturer's instructions.
Dietary intakes
The 3 d food diary was completed twice (before randomisation (V1) and before the end of the study (V3)) by the volunteers and assessed by the study dietitian. The food and nutrient table was produced through the Nutrilog® software (Nutrilog SAS) based on the French food composition database available in CIQUAL(23).
Determination of sample size and statistical analysis
Sample size determination
The number of subjects per group was calculated for the primary end-point which was a significative variation of the Bifidobacterium population expressed in log (copies/g DM).
Previous studies using FOS or inulin have shown that the variability of the main objective is one log unit (colony-forming units/g); so standard deviation is set to 1. Bouhnik et al. (Reference Bouhnik, Raskine and Simoneau24) have stated that a clinical significant effect on Bifidobacterium requires a difference of 1 log (colony-forming units/g) between subjects taking placebo and subjects taking 10 g of inulin. We expected, based on our previous unpublished results (Y. Dugenet, personal communication), that the test products at the selected dose would be as effective as 10 g of inulin. So, for a type I error rate α of 5 % and for a type II error rate β of 20 %, the minimum number of subjects required for two-sided testing is sixteen. Because of the possible dropout of subjects and in order to increase the statistical power, the final number chosen was twenty subjects per group.
Data handling
Whenever possible, relative changes between baseline and the end of the 4-week intervention were calculated as percentage of baseline values. This was the case for clinical, dietetic and some biological parameters as listed in Table 2 (baseline characteristics). For digestive tolerance symptoms, the nature of the text (self-assessment on a 10 cm scale) led to some baseline values of ‘zero’, preventing any calculation for relative changes from baseline. Instead, the absolute changes were calculated and used. For all other parameters where only the end-point was measured, those absolute data were used.
Table 2 Baseline characteristics of the target population* (Mean values with their standard errors)
XOS, xylo-oligosaccharide; INU–XOS, inulin-and-XOS mixture; M, male; F, female; bpm, beats/min.
* All groups are homogeneous at baseline (P>0·05).
Data analysis
Data analysis was performed using the statistical package SPSS® version 17.0 for Windows (SPSS, Inc.). Descriptive analyses were done for all parameters and are given as means and standard errors. All statistical tests were two-sided with a significance level of 0·05. Normality of data distribution for each parameter was assessed by Shapiro–Wilk test before performing either parametric (t tests) or non-parametric (Mann–Whitney test or Wilcoxon signed-rank test) tests to compare groups or visits.
Results
A total of sixty subjects were included in the study, but one subject dropped out at V1 and was not replaced. No further subject dropout occurred during the study. Groups are homogeneous for all measured parameters at baseline, except for the sex ratio (Table 2). It was considered that none of the tested markers would be influenced by sex; this factor was therefore not included as a randomisation criteria.
Dietary fibre intake (excluding test product) decreased in the XOS group from 13·91 (sem 0·87) g/d at V1 to 12·08 (sem 0·59) g/d at V3 (P = 0·029). However, we can observe from Table 3 that there was no significant difference in the study outcome between groups on any of the clinical or dietary parameters.
Table 3 Clinical and dietetic parameters at V 3 (measurement done after 4 weeks of treatment); changes from baseline (percentage change) (Mean values with their standard errors)
XOS, xylo-oligosaccharide; INU–XOS, inulin-and-XOS mixture; bpm, beats/min.
The global digestive tolerance symptoms score based on the sum of five symptoms was increased at V2 in INU–XOS compared to the placebo and XOS groups (P = 0·005 and 0·046, respectively), but was only transient as the scores decreased at V3 for the INU–XOS group (P = 0·007 between V2 and V3). INU–XOS increased flatulence and bloating sensations at V2 (P = 0·001 and 0·013, respectively) and V3 (P = 0·004 and 0·029, respectively) compared to placebo. However, when comparing groups for relative changes in tolerance symptoms (Table 4), only flatulence was significantly increased between the placebo and INU–XOS groups over the intervention period (P = 0·032).
Table 4 Parameters linked to digestive tolerance at V 3 (measurement done after 4 weeks of treatment); for the different symptoms, absolute changes (cm change) are presented and used for comparison† (Mean values with their standard errors)
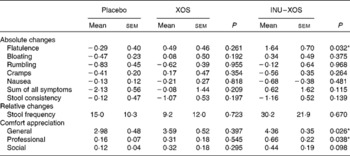
XOS, xylo-oligosaccharide; INU–XOS, inulin-and-XOS mixture.
* Mean values were significantly different compared to the placebo group (P < 0·05).
† For frequency of stool production, relative changes (percentage change) could be calculated and are presented. For those comfort questions only measured at V 3, the absolute values are presented.
Similarly, stool consistency was perceived as more liquid in the INU–XOS group than in the placebo group (P = 0·001) at V2 with a decrease in stool consistency between V1 and V2 (P = 0·002) and a return to baseline at V3 (P = 0·011). No differences were observed for self-reported daily stool frequency except for an increase between V1 and V2 in the INU–XOS group from 1·09 (sem 0·12) to 1·55 (sem 0·25) stool/d (P = 0·026). No group difference was observed for relative or absolute changes in either of those parameters.
We observed a small impairment in general well-being (P = 0·026) and professional activities (P = 0·038) for the INU–XOS group in comparison to the placebo group at V3. Prebiotic activity is characterised by both changes in the microbial profile and bacterial metabolic activity.
Bifidobacterium population was higher at V2 and V3 (P = 0·003 and < 0·001, respectively) in the XOS group, and at V2 and V3 (P = 0·015 and 0·001, respectively) in the INU–XOS group compared to placebo. The differences were clinically pertinent of about 1 log. There was a moderate increase of the Lactobacillus population between V1 and V2 (about 0·5 log) in the INU–XOS group (P = 0·048). The Peptostreptococcus population had increased (1 log) at V2 in the XOS (P = 0·027) and INU–XOS groups (P = 0·047) as compared to the placebo, but both groups returned to baseline at V3. Analysis of the changes from baseline to end of the study only showed a significant effect of both groups against placebo for Bifidobacterium (Table 5). There was no difference between the three groups for Clostridium population at all time points. However, there was a significant overall decrease between V1 and V3 in the three groups (P < 0·001), possibly due to increased orange juice consumption. For Firmicutes, Bacteroidetes, Faecalibacterium prausnitzii and Rosebusia spp. populations, there was no difference between the three groups at V3.
Table 5 Microbiota profile parameters at V 3 (measurement done after 4 weeks of treatment); changes from baseline (percentage change) for those bacterial species measured at V 1 (measurement done on first day of treatment)† (Mean values with their standard errors)
XOS, xylo-oligosaccharide; INU–XOS, inulin-and-XOS mixture.
** Values were significantly different compared to the placebo group (P < 0·01).
† For other bacteria, the absolute values at V 3 (log10 (copies)/g of faecal DM) are compared.
Bacterial metabolism can be measured by its products (carbohydrate or protein metabolites), its activity (enzymatic) or the impact on the gut environment (pH). Faecal pH was lower in the XOS than in the placebo group at V3 (6·47 (sem 0·17) v. 6·97 (sem 0·15); P = 0·033), but changes from baseline showed no significant difference between the two groups (Table 6). As expected, carbohydrate metabolism was affected.
Table 6 Parameters linked to the prebiotic effect at V 3 (measurement done after 4 weeks of treatment)† (Mean values with their standard errors)
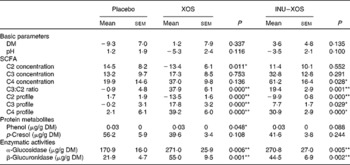
XOS, xylo-oligosaccharide; INU–XOS, inulin-and-XOS mixture.
* Values were significantly different compared to the placebo group (P < 0·05).
** Values were significantly different compared to the placebo group (P < 0·01).
† For carbohydrate metabolites (SCFA), changes from baseline (percentage change) are presented. For other parameters, when no data are available at V 1 (measurement done on first day of treatment), absolute measures at V 3 are presented and used for comparison. These include protein metabolites (phenols) and enzymatic activities.
Total SCFA production was significantly increased at V3 in the INU–XOS group (P = 0·028) as compared to placebo. No variation in the total production was observed in the XOS group. SCFA profile, however, was modified in both groups. At V3, both the propionic and butyric acid contributions were higher in the XOS and INU–XOS groups (P < 0·001 each), and acetic acid was lower in the two treatment groups (P < 0·001) as compared to placebo. This was supported by highly significant changes from baseline in both groups for C2, C3 and C4 profiles (Table 6). The contribution as raw SCFA production was different as shown in Table 6, with XOS effect due to decreased C2 production and INU–XOS due to increased C4 production. In both groups, the C3:C2 ratio was more increased compared to placebo (Table 6). Protein metabolism was only affected for p-cresol in the XOS group at V3 (39·64 (sem 3·43) μg/g DM; P = 0·020) as compared to placebo (56·21 (sem 5·90) μg/g DM). Finally, bacterial enzymatic activity was increased in both groups compared to placebo at V3 (Table 6).
Immunomodulatory activity of the test products was measured both by direct and indirect markers. There was a 70 % higher faecal expression of s-IgA at V3 in the INU–XOS group compared to the placebo group, which was non-significant. Circulating LPS, however, was significantly decreased at V3 compared to placebo (Table 7).
Table 7 Parameters linked to the immune modulatory effect at V 3 (measurement done after 4 weeks of treatment)† (Mean values with their standard errors)
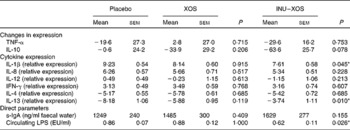
IFN-γ, interferon-γ; s-IgA, secretory IgA; LPS, lipopolysaccharides; EU, endotoxin units.
* Values were significantly different compared to the placebo group (P < 0·05).
† For the two reference cytokines (TNF-α and IL-10), changes from baseline (percentage change) are presented. For other parameters, when no data are available at V 1 (measurement done on first day of treatment), absolute measures at V 3 are presented and used for comparison. These include cytokine expression, as also direct markers such as secretory IgA or circulating LPS.
Indirect measures of immune modulation were done by stimulating whole blood with a proinflammatory factor (LPS) and comparing the expression of RNA for cytokine production. The gene expression for selected cytokines, representative of both pro- and anti-inflammatory pathways, was measured by comparison with a non-stimulated sample.
The overall effect was a pro-inflammatory response to LPS incubation, which was significantly inhibited in the INU–XOS group for IL-1β compared to placebo (Table 7). LPS response for the other pro-inflammatory cytokines was not modulated.
Anti-inflammatory cytokine expression was partially restored for IL-13 in the INU–XOS group compared to placebo. LPS response was not modulated for IL-4. XOS did not affect the LPS-induced ex vivo inflammation profile.
Globally, a decrease of the ‘pro-inflammatory’ Th1 pathway (IL-β) and a stimulation of the ‘anti-inflammatory’ Th2/Treg pathways (IL-13) were observed for INU–XOS only. Linear regression analysis was performed to investigate whether circulating LPS concentrations could be a confounding factor in the cytokine response. Results showed that this was not the case either for IL-1β or for IL-13.
Discussion
There was no difference between the three groups for clinical, anthropometric and nutritional data. No weight change was observed in these normal-weight subjects. Throughout the study, the diet remained unchanged with a 35 % fat and stable fibre intake (about 13 g/d); it may be considered as a typical (standard) Western high-fat, low-fibre diet. The small drop in fibre intake in the XOS group at V3 can only reinforce the knowledge that any effect observed was due to the test compound rather than the fibres of dietary origin.
The primary objective of the present study was to investigate the prebiotic properties of the two test products. Inulin is a fructan molecule composed of β(2 → 1)-linked fructose monomers, ending or not by a glucose unit. This specific conformation gives the property of non-digestibility by human salivary, gastric and enteric enzymes(Reference Bach Knudsen and Hessov25). The bifidogenic effect of inulin is well established(Reference Kolida, Meyer and Gibson26–Reference Meyer and Stasse-Wolthuis29) and inulin is defined as a prebiotic(Reference Gibson and Roberfroid3–Reference Roberfroid, Gibson and Hoyles5). Arabinoxylans are the main polysaccharides in hemicellulose. Their molecular weight varies from 600 to 1300 Da (with a DP between 5 and 10) up to 500 000 Da (DP 3500–4000). Wheat arabinoxylans include a linear backbone of β(1 → 4)-linked d-xylopyranosyl units, which are either non-substituted, mono- or bi-substituted with l-arabinofuranosyl units. Some of the arabinose residues are esterified by phenolic acids, essentially ferulic acid. The bifidogenic effect of XOS was demonstrated in some studies(Reference Chung, Hsu and Ko30, Reference Grootaert, Delcour and Courtin31) and confirmed in the present one. Since XOS are not digestible in the upper intestinal tract, induce an increase of a limited number of potentially beneficial micro-organisms in the colon and produce beneficial effects for the host by the modification of the colonic microflora composition(Reference Yamada, Itoh and Morishita32), XOS have high prebiotic potential.
Results with XOS are consistent with recent publications(Reference Chung, Hsu and Ko30, Reference Grootaert, Delcour and Courtin31, Reference Cloetens33) showing a bifidogenic effect of the oligosaccharide. It is interesting to note that under very similar experimental conditions (similar food matrix and target population), we find a much better bifidogenic effect with 5 g/d compared to 10 g/d consumed by subjects in the study described by Cloetens et al. (Reference Cloetens33–Reference Cloetens, De Preter and Swennen35). The association of inulin and XOS (3 and 1 g/d, respectively) appears to be more efficient than inulin used at higher doses in the literature(Reference Kolida, Meyer and Gibson26, Reference Meyer and Stasse-Wolthuis29) or other non-digestible carbohydrates(Reference Pasman, Wills and Saniez36). In the present study, no effect on the lactobacillus population was observed for XOS. Despite the fact that in vitro study on SHIME has shown an increase of Lactobacillus (Y. Dugenet, personal communication). This is consistent with the literature(Reference Cloetens, Broekaert and Delaedt34). Only a moderate and transient Lactobacillus increase was observed at V2 for the INU–XOS group as compared to the same subjects at V1. Other bacterial species known for their acidophilic and butyrogenic properties in the fermentation of non-digestible fibres were tested, but neither F. prausnitzii nor Roseburia spp. was significantly modulated. Peptostreptococcus were moderately but significantly increased at V2 for both test products compared to placebo before returning to control levels by the end of the intervention.
Clostridium population was finally measured as a marker of pathogenic bacteria and was found to significantly decrease with time for both test products. However, this effect was also observed for the placebo, suggesting a role of the orange juice matrix. The lack of effect of either fibre on Clostridium is consistent with the literature on XOS(Reference Chung, Hsu and Ko30) showing no effect and inulin(Reference Kolida, Meyer and Gibson26) showing a slight stimulation. It is well known that Bifidobacterium do not produce gas during carbohydrate fermentation, whereas Clostridiae are prolific gas producers(Reference Louis and Flint37). It may explain the good tolerance in our study, as discussed next, and it may suggest a decrease of Clostridium population by XOS.
The principal fermentation products of non-digestible carbohydrate-like fructans and arabinoxylans are SCFA, mainly acetate (C2), propionate (C3) and butyrate (C4). A study comparing an arabinoxylan fibre (pentosan) and inulin (at 15 g/d) has shown that arabinoxylan increases more total SCFA and butyrate than inulin(Reference Grasten, Liukkonen and Chrevatidis38). The present study shows an increase in total SCFA in the INU–XOS rather than the XOS group, suggesting a role of inulin in this increased production, in opposition to previous reports(Reference Grasten, Liukkonen and Chrevatidis38). While both groups showed very similar profiles of SCFA contribution at V3, with an overall decrease of acetate contribution to the benefit of propionate and butyrate, faecal concentration of the individual fatty acids were not identical. Indeed, we observed a switch from acetate to butyrate production for the XOS group, while the acetate production was not affected for the INU–XOS group whereas both propionate and butyrate increased. This suggests the selection of different bacterial strains by XOS and inulin, inducing different fermentation patterns. The physiological consequences of an increase in C3 and C4 fatty acids may be the reduction of the risks for a number of disorders. For example, butyrate is correlated with lower risks for colorectal cancer(Reference Pouillart39, Reference Pool-Zobel40). It may be due in part to a reduction in faecal pH, as observed in the XOS group and in another study using XOS(Reference Chung, Hsu and Ko30). Lower pH inhibits the activity of procarcinogenic enzymes(Reference Wollowski, Rechkemmer and Pool-Zobel41) as well as the growth of pathogenic putrefaction bacteria(Reference Gibson and Wang42). The increased propionate:acetate ratio can also play a role in cholesterol metabolism, thus reducing the risks of cardiovascular disorders(Reference Wong, de Souza and Kendall43). More recent theories suggest a role of butyrate in energy metabolism, modulating the expression of the glucagon-like peptide-2(Reference Delzenne and Cani44). This may reduce the risks of developing obesity and its metabolic complications(Reference Cani and Delzenne45).
Other markers of the colonic microbiota are bacterial enzyme activities and non-fatty bacterial metabolites such as phenol and p-cresol. We found an increase in both α-glucosidase and β-glucuronidase activities in the two test groups. Another study(Reference Grasten, Liukkonen and Chrevatidis38) has shown no effect on the activity of faecal β-glucuronidase with inulin or with XOS, but a slight increase in β-glucosidase activity. Previous studies have shown that FOS and inulin decrease(Reference Van Dokkum, Wezendonk and Srikumar46, Reference Buddington, Williams and Chen47) or have no effect(Reference Kleessen, Sykura and Zunft48, Reference Bouhnik, Flourié and Riottot49) on glucuronidase activity. These results indicate that microflora changes can regulate the synthesis of enzymes involved in the initial hydrolysis of the carbohydrate substrate. The impact of these changes in enzyme activity in relation to gut health is not elucidated, but it has been suggested that these enzymes are involved in the conversion of procarcinogen compounds(Reference Roberfroid, Bornet and Bouley6). It is important to note as well that bacteria expressing glucosidase and glucuronidase activity are often butyrogenic(Reference Dabek, McCrae and Stevens50). Thus, we consider this increase in enzymatic activity as a positive marker of specific bacterial strains rather than a marker of the enzymatic potential.
Only faecal p-cresol decreased in the XOS group in our study, whereas in another study a higher concentration of phenols in faeces was found for XOS compared to inulin(Reference Grasten, Liukkonen and Chrevatidis38). However, a decrease in urinary p-cresol without affecting phenol excretion was observed in another study using XOS(Reference Cloetens33). An in vitro model of the proximal colon has shown that inulin lowered p-cresol especially in the presence of the pathogenic Clostridium difficile (Reference Van Nuenen, Meyer and Venema51). These carcinogenic compounds are the end-products of amino acid fermentation(Reference Gibson and Macfarlane52) and may be influenced by protein intake.
The present results demonstrate without any doubt that both XOS and INU–XOS have a strong prebiotic effect after 2 and 4 weeks of intake.
Both products and especially XOS are well tolerated. Apart from higher flatulence and bloating in the INU–XOS group, no difference occurs at V3 between the prebiotics group and placebo for the individual digestive symptoms, global digestive tolerance, stool consistency and frequency, and for well-being. The small increase in symptoms observed in the INU–XOS group at week 2 completely disappeared by the end of the study. Other studies with short-chain FOS(Reference Paineau, Payen and Panserieu17) or with other non-digestible carbohydrates(Reference Bouhnik, Raskine and Simoneau24) have shown the same evolution with a transient impairment of digestive comfort. A study using the same inulin-type fructan (Fibruline®) has shown a dose–effect response for digestive tolerance from 5 g up to 20 g(Reference Gibson and Macfarlane52). A study on the lowest bifidogenic dose of inulin (5 g/d)(Reference Kolida, Meyer and Gibson26) found an increase in stool frequency, intestinal bloating and flatulence. On the other hand, a study in elderly subjects has shown no adverse influence of 4 g XOS on gastrointestinal symptoms and no difference with placebo(Reference Chung, Hsu and Ko30), which is consistent with our findings in the XOS group. We therefore expect that the digestive discomfort observed for INU–XOS is probably due to inulin contribution to the mix.
A secondary objective of the study was to better understand the impact of fibres on the immune system and inflammatory response. Prebiotics, and particularly β(2 → 1)-fructans (e.g. inulin), may have beneficial effects upon immune function and inflammatory process. For instance, several studies(Reference Lomax and Calder7) in animals report an increase of intestinal or faecal s-IgA levels upon supplementation with various β(2 → 1)-fructans preparation. There are, however, very few studies in human subjects. In one study in newborn infants fed a formula supplemented with a mixture of galacto-oligosaccharides and long-chain inulin, the authors observed an increase in faecal s-IgA(Reference Bakker-Zierikzee, Tol and Kroes54). In our study, we found a higher but non-significant level of faecal s-IgA in the INU–XOS group. We have shown that LPS were significantly lower in the INU–XOS group at the end of the 4-week study compared to the placebo group. LPS or bacterial endotoxin is a potently inflammatory antigen present in large quantities in the human gut. It is now well known that LPS is a strong stimulator of the release of several cytokines that are key inducers for inflammation, insulin resistance, atherosclerosis and obesity. Toll-like receptor 4 is the specific receptor for LPS(Reference Chow, Young and Golenbock15, Reference Wright, Ramos and Tobias16). Bacterial endotoxin circulates in the plasma of human subjects at low concentrations. The process named metabolic endotoxaemia is the day-to-day impact of LPS on inflammation. In mice, Cani et al. (Reference Cani, Neyrinck and Fava10, Reference Cani, Bibiloni and Knauf11) suggest a critical role of bacterial LPS from the Gram-negative bacteria in the intestinal tract in the development of obesity. The metabolic concentrations of LPS are modulated by food content(Reference Turnbaugh, Ley and Mahowald55, Reference Cani, Amar and Iglesias56). Indeed, mice fed a high-energy diet showed a higher increase in plasma LPS if the energy source is fat rather than carbohydrate(Reference Roller, Pietro Femia and Caderni57). Similarly, a high-fat meal induces low-grade endotoxaemia(Reference Erridge, Attina and Spickett12), which may partially explain postprandial inflammation. Moreover, positive correlations were observed between fat and energy intakes(Reference Amar, Burcelin and Ruidavets58), and Ghanim et al. (Reference Ghanim, Abuaysheh and Sia59) observed a significant increase in plasma concentrations of endotoxin and Toll-like receptor 4 expression in peripheral blood mononuclear cells after the intake of high-fat, high-carbohydrate meals. In a mouse model, fructans supplementation to a high-fat diet induced a decrease of plasma LPS and pro-inflammatory cytokines together with the selective increase of bifidobacteria(Reference Cani, Neyrinck and Fava10). This is, to our knowledge, the first human study investigating the effect of prebiotic fibres on circulating LPS in a population consuming a balanced diet.
A young and healthy population does not show sufficient baseline expression of cytokines to detect significant modulation by the dietary intervention alone. We thus decided to use an ex vivo model using LPS-challenged whole blood collected from subjects included in our study in order to understand the priming of immune response(Reference Abdel Nour, Dépeint and Barbour22). We have shown simultaneously a lower IL-1β and TNF-α expression together with a higher IL-13 and IL-10 expression, suggesting a capacity to reduce the intensity of an acute pro-inflammatory reaction. This modulatory effect was only significant in the INU–XOS group. Further statistical analyses have shown that this effect was not due to lower circulating LPS levels in the plasma but was solely linked to a group effect. Indeed, lower LPS levels could have induced a lower inflammatory status of the subjects and made an impact on the apparent immune modulation to the ex vivo challenge. Because we are dealing with a young and healthy population, circulating levels are probably too low to induce any kind of inflammatory response, be it low-grade. We therefore could not link the indirect immune modulation effect to a specific factor. Other fibres such as α-glucans from Agaricus bisporus (mushrooms) have recently been shown to lower LPS-induced TNF-α production in slightly hypercholesterolaemic subjects using the same ex vivo challenge(Reference Volman, Mensink and van Griensven60). In FOS-supplemented female mice, T cell cytokine production was enhanced with an increase in IL-10 and interferon-γ production from stimulated Peyer’s patches CD4+ T cells(Reference Hosono, Ozawa and Kato61). Simultaneously, IL-10 production from Peyer’s patches and mesenteric lymph nodes was also increased in rats with oligofructose-enriched inulin supplementation(Reference Roller, Pietro Femia and Caderni57, Reference Roller, Rechkemmer and Watzl62). Another clinical study shows similar trends towards reduced production of the pro-inflammatory signalling cytokines in an elderly population by a β-galacto-oligosaccharide(Reference Vulevic, Drakoularakou and Yaqoob63). Regarding cytokine expression in elderly adults resident in long-term care facilities, IL-6 production by stimulated blood mononuclear cells was decreased and a trend for a reduced IL-10 production was observed upon FOS supplementation(Reference Langkamp-Henken, Wood and Herlinger-Garcia64). No data were available from clinical trials using XOS or a mixture of inulin and XOS to back up our findings.
Recently, an experimental study showed that orange juice neutralises the pro-inflammatory effect of a high-fat, high-carbohydrate meal and prevents endotoxin increase and Toll-like receptor expression(Reference Ghanim, Sia and Upadhyay65). These data were not publicly available at the time of designing of our experimental conditions. Even though some effects may have been masked by the matrix, it only strengthens the immune stimulation observed with INU–XOS as expressed by a difference for cytokines expression and LPS translocation.
This study has demonstrated a clear prebiotic effect of XOS alone and of XOS mixed with inulin. This was proven both through changes in the composition of the colonic microflora and its metabolic activities. In addition, we have shown that prebiotic fibres may reduce the pro-inflammatory response and decrease LPS translocation while improving s-IgA secretion into the lumen. This, to our knowledge, is the first clinical study showing an anti-inflammatory potential in healthy volunteers consuming a balanced diet enriched with a mixture of prebiotic fibres.
The next step would be to investigate whether greater changes may occur in subjects presenting a low-grade systemic inflammation such as in obesity, and the metabolic syndrome(Reference Alvarez, Higgins and Oster66), since it is suggested that inflammation linked to a high-fat diet is induced by LPS(Reference Cani, Amar and Iglesias56). Moreover, it would be interesting to look at the impact on weight loss and improvement of metabolic disturbances using supplementation of INU–XOS fibres together with a moderate low-energy and low-fat diet. We could then tackle important mechanisms for the management or prevention of obesity, the metabolic syndrome, diabetes, CVD or even sarcopenia. Further studies are needed to understand the beneficial effects to specific target populations.
Acknowledgements
We thank Yann Dugenet, chairman of Witaxos DF3 SAS, for funding this research programme. We also thank Bruno Cadiou and Pascale Dartois for their helpful coordination and the nursing students at the Beauvais Hospital for their involvement in blood sampling. We would like to acknowledge as well the medical support from Dr Aurélie Dornier-Fehre and Sophie Bontemps, who closely followed-up on the volunteers throughout the clinical trial. We are grateful for the help provided by Hélène Mauprivez in the preparation phase of the study. Finally, we thank the dietitian Sylvie Bal from the Institut Pasteur de Lille for her work in the preparation and analysis of the dietary data. Y. D. was the sponsor and Cosucra Company (represented by H. J.) participated in this trial. J.-M. L. was the investigator of the study. J.-M. L. and F. D. participated equally in the writing of the manuscript. G. L. was the co-investigator. P. R. P. was the scientific coordination manager while A. C., E. C., F. D. and G. A. were study managers. A. M. A. performed molecular diagnostic experiments. L. R. was in charge of analytical chemistry experiments and C. N. N. performed the statistical analyses. H. Y. was in charge of the monitoring and A. J. helped to review the manuscript. Witaxos DF3 SAS funded the present study, which could represent a conflict of interest. Except for that, the authors have no conflicts of interest to declare.


