


INTRODUCTION
Salmonellosis is a significant public health concern, being a leading cause of human enteric illness worldwide, with higher rates in immunocompromised populations [Reference Majowicz1]. Large-scale ecological changes, particularly climate and land-use modifications, may have a considerable effect on salmonellosis distribution by influencing pathogen biology, environmental reservoirs, transmission pathways, and host–pathogen interactions [Reference Patz2]. Hot, humid conditions and lagged temperature have been positively associated with gastroenteritis [Reference Hall3] and salmonellosis incidence in Australia [Reference Zhang, Bi and Hiller4]. In New Zealand, a 1°C increase in monthly average temperature is estimated to result in a 15% increase in reported salmonellosis [Reference Britton5]. Increasing evidence of zoonotic transmission from farmed animals [Reference Clark6] and wildlife [Reference Alley7], and subsequent contamination of waterways [Reference Donnison and Ross8] and drinking water supplies [Reference Simmons9] suggest that land use is an important determinant of salmonellosis in New Zealand.
Describing the relative contribution of specific serotypes can assist in prioritization of populations vulnerable to environmental change. The distribution of Salmonella serotypes in the environment can vary temporally [Reference Haley, Cole and Lipp10] and with different socioeconomic and demographic groups [Reference Voetsch11]. As serotypes can have distinct epidemiologies, it has been suggested that identifying pathogenic serotypes of Salmonella could help determine their differential public health impact and specific environmental risk factors [Reference Pires12].
New Zealand has relatively high rates of salmonellosis compared to other industrialized countries [Reference Britton5]. This disease accounts for 7·35% of total disability adjusted life years attributed to major foodborne diseases (ranking fourth in impact after campylobacteriosis, norovirus and perinatal listeriosis) [Reference Lake13]. Despite its importance, there have been few comprehensive reports on salmonellosis epidemiology in New Zealand [Reference Arshad14]. In this study we used multiple surveillance sources, particularly notifications, hospitalizations and serotype prevalence data, to describe epidemiological patterns in salmonellosis in New Zealand over a 12-year period 1997–2008.
METHODS
Data sources
All notified cases of salmonellosis during 1997–2008 in New Zealand were obtained from the National Notifiable Disease Surveillance system (EpiSurv) which is operated by the Institute of Environmental Science and Research (ESR) for the NZ Ministry of Health. Hospital and mortality data for the same period were obtained from the National Minimum Dataset managed by the Ministry of Health. Population denominator data, including age, sex, ethnicity and Census Area Unit (CAU code), were based on the 2001 National Census of Population and were obtained from Statistics New Zealand. A CAU is a non-administrative, geographical unit defined by Statistics New Zealand, each of which comprises a population of 3000–5000 people. Tabulated data on Salmonella isolates were obtained from ESR.
For notifications, cases were defined as a clinical illness with appropriate laboratory confirmation. For hospitalizations, we used all discharged cases with a principal diagnosis of salmonella infection (ICD-9-CM code 003 and ICD-10-AM code A02). The analysis was restricted to overnight or longer admissions and New Zealand residents. In order to include only incident cases, if the same individual was re-admitted with the identical diagnosis within 30 days, only the first record was included. For mortality records we used those where the underlying cause of death was coded as Salmonella infection.
Exposure variables
Based on date of notification and hospitalization, cases were assigned to Southern Hemisphere seasons as follows: summer (December–February), autumn (March–May), winter (June–August) and spring (September–November).
Cases were assigned to one of the seven categories of rurality based on population number and employment status as defined by Statistics New Zealand [15]. These categories are: main urban areas, satellite urban areas, independent urban areas, rural areas with high urban influence, rural areas with moderate urban influence, rural areas with low urban influence, and highly rural/remote areas. Average monthly rates for urban and rural areas were calculated by classifying the first three categories as urban and the latter four as rural.
The deprivation index, an area based index, derived from variables important to social and material deprivation [Reference Salmond and Crampton16] was used as a socioeconomic level indicator. It is constructed on a decile scale with deprivation level 1 representing socioeconomically affluent CAUs and level 10 representing the most deprived CAUs. In this study, deprivation levels were grouped into five quintiles. Ethnicity was based on level 1 prioritized ethnicity which divides the population into Māori, Pacific, Asian, European and Other.
Analysis
Rates were calculated using the 2001 Population Census and converted to average rates per 100 000 population per year (hereafter referred to as average annual rates or rates per 100 000 population). Ninety-five percent confidence intervals (CIs) were reported based on average annual rates for the duration of the study period. Rates for ethnic groups were directly age-standardized to the age distribution of the national population in 2001; 95% CIs were calculated based on the age-standardized rates. ArcGIS v. 10 was used for mapping.
RESULTS
Incidence time trends and seasonality
The incidence of salmonellosis notifications, hospitalizations and fatalities was used to assess the public health impact of this disease in New Zealand. The average annual rate of salmonellosis notifications was 42·8 cases/100 000 population, hospitalizations were 3·6 cases/100 000 population, and mortality was 0·02 cases/100 000 population (based on an average of 1603 notifications, 135 hospitalizations and 3·3 deaths per year over that period).
Salmonellosis notification and hospitalization rates showed a similar temporal pattern to each other over the 12-year period 1997 to 2008 (Fig. 1). Incidence rose to a peak in 2001 with 2417 notified cases and 178 hospitalizations then declined to a level broadly similar to that at the start of the observation period.
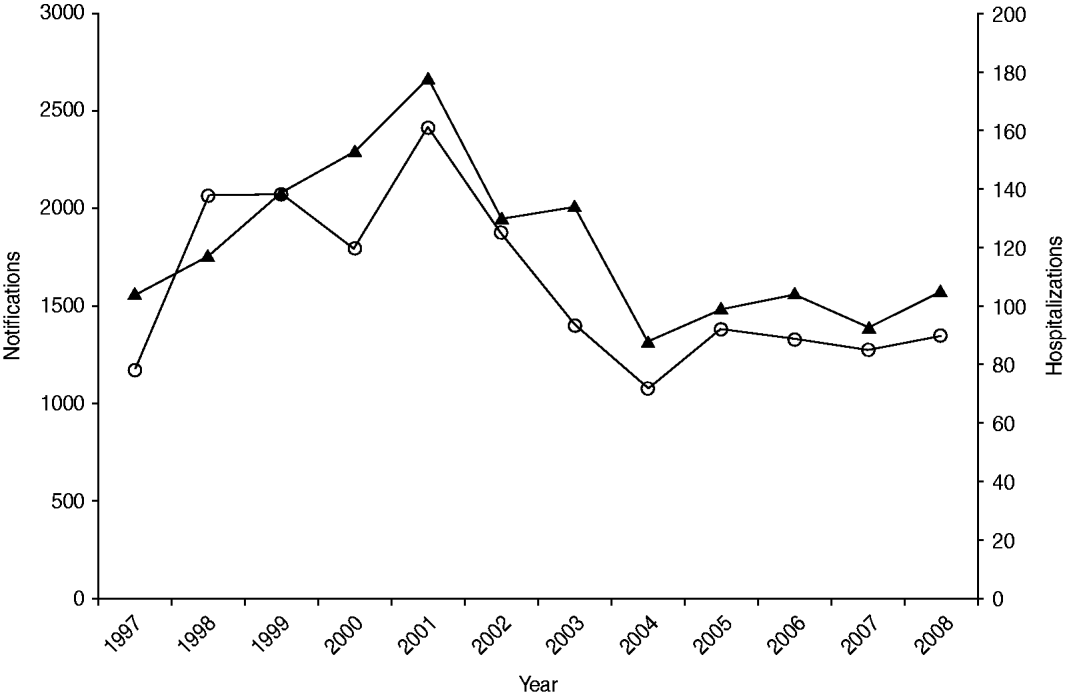
Fig. 1. Number of salmonellosis notifications (![]() ) and hospitalizations (
) and hospitalizations (![]() ) in New Zealand, 1997–2008.
) in New Zealand, 1997–2008.
Both notification and hospitalization rates peaked in summer with average annual incidences of 14·4/100 000 and 1·3/100 000 population, respectively, with rates dropping to about half that level over winter (Table 1). Seasonality showed a different pattern in rural areas with a marked spring peak (6·4/100 000 population) that was absent in urban populations which only experienced a single peak in summer (4·9/100 000 population) (Fig. 2).
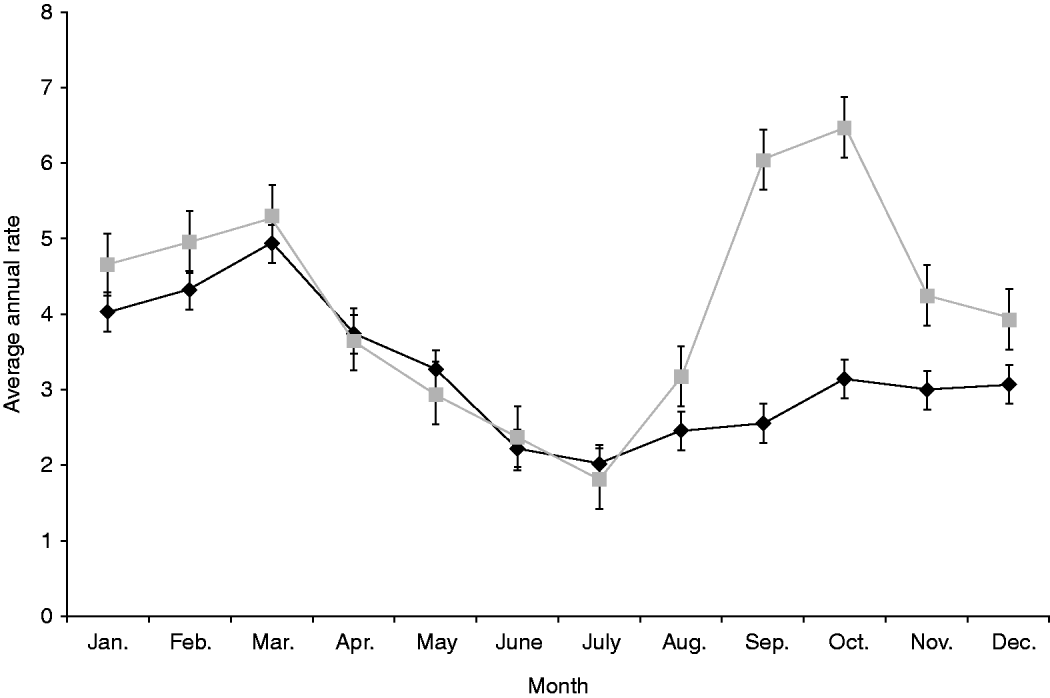
Fig. 2. Average annual, monthly rate of salmonellosis notifications by urban (![]() ) and rural (
) and rural (![]() ) status, 1997–2008. Standard error bars are shown.
) status, 1997–2008. Standard error bars are shown.
Table 1. Numbers and rates (average per 100 000 population per year) of salmonellosis notifications and hospitalization by season, rural–urban domicile, age group, sex, ethnicity, and deprivation level, New Zealand, 1997–2008

RR, Rate ratio; CI, confidence interval; n.a., not applicable.
* Rate is the average annual rate per 100 000 population.
† RR is calculated in reference to the value in bold; 95% CI is calculated based on the whole period.
‡ Rates for ethnic groups were directly age-standardized to the age distribution of the New Zealand population at the 2001 Census. 95% CI were calculated based on methods for age standardization.
Geographical distribution and urban–rural differences
Average annual salmonellosis incidence rates by Territorial Authority (TA) (geographical aggregations of CAUs) for both notifications and hospitalizations are shown in Figure 3. Notification and hospitalization rates were consistently above the national average in the South Island TAs particularly towards the lower end of the South Island (Ashburton, Southland, Clutha, Gore). North Island TAs with large rural regions also had high rates (Wairarapa, Carterton). Average annual notification rates were highest in Clutha (109·6/100 000), followed by Southland (105·6/100 000) (Fig. 3). Average annual hospitalization rates were highest in Ashburton (10·4/100 000) followed by Gore (10·0/100 000).

Fig. 3. Salmonellosis notification and hospitalization rates (average per 100 000 population per year) by Territorial Authority, New Zealand, 1997–2008.
Salmonellosis rates were generally higher in rural areas compared to urban areas (Table 1). Overall, average annual notification rates in urban areas were 41·2/100 000 population compared to 51·0/100 000 population in rural areas [rate ratio (RR) 1·23, 95% CI 1·22–1·24]. There was a similar gradient for hospitalization rates, with average rates in urban areas of 3·3/100 000 population compared to 4·0/100 000 popu-lation in rural areas (RR 1·20, 95% CI 1·19–1·22). For both notification and hospitalization rates, there appeared to be a tendency for increasing incidence rates with increasing grade of rurality (Table 1) with rates in remote areas exceeding those in any other category for hospitalizations (5·4/100 000 population). Rates in rural areas with high urban influence had the highest rates for notifications (59·9/100 000 population).
Age, sex, ethnicity and deprivation
Average annual salmonellosis notification and hospitalization rates varied by age (Table 1). For notified cases, the highest incidence was detected in children aged 0–4 years (154·2/100 000 population), followed by adults in the 20–29 years age group (47·5/100 000 population), while the lowest incidence was in the ⩾80 years age group (18·0/100 000 population) (Table 1). Males (45·3/100 000 population) had a slightly higher average incidence rates than females (39·3/100 000 population). Hospitalization rates were also highest in children aged 0–4 years (11·3/100 000 population), but unlike notification rates had a second peak in older adults aged 70–79 years (4·8/100 000 population). Unlike notification rates, hospitalization rates showed no differences between sexes.
Average annual incidence rates varied by ethnicity but patterns were very different for notifications and hospitalizations (Table 2). For notifications, Europeans had the highest age-standardized rates (42·1/100 000 population), with lower rates for Māori (23·4/100 000 population), Pacific Island (21·8/100 000 population) populations, Asian (15·5/100 000 population), and ‘Other’ ethnic groups (25·3/100 000 population). However, this pattern was largely reversed for hospitalized cases. The Pacific Island (6·3/100 000 population) and Māori (5·6/100 000 population) people had the highest rates, with Europeans (3·4/100 000 population) recording the third lowest incidence rate among ethnic groups followed by Asians (1·6/100 000 population) and ‘Other’ (1·0/100 000 population).
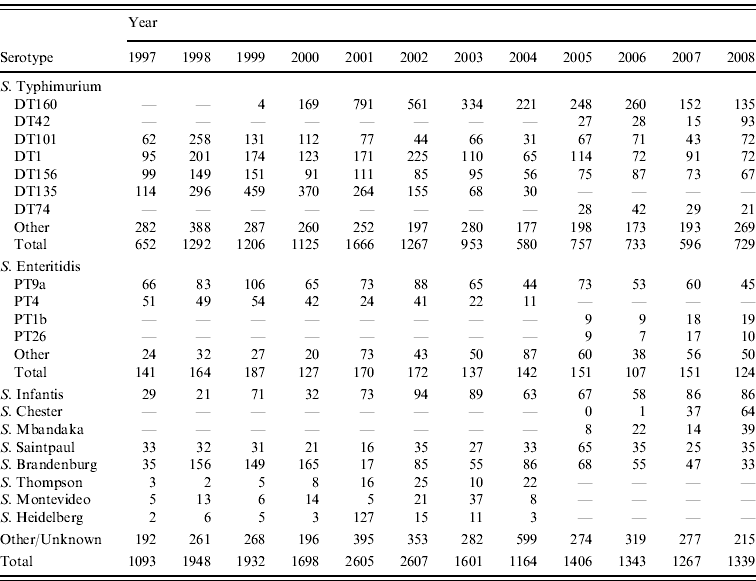
Table 2. Total number of selected Salmonella serotypes from laboratory-confirmed salmonellosis notifications, 1997–2008
Salmonellosis also varied by level of deprivation, again with contrasting patterns for notification and hospitalization rates (Table 1). Average annual notification rates in the least deprived CAUs were higher (37·2/100 000 population) compared to the most deprived CAUs (25·20/100 000 population). Hospitalization rates were reversed with higher rates recorded for the most deprived CAUs (5·7/100 000 population) compared with the most affluent CAUs (2·6/100 000 population).
Salmonella serotypes
The predominant Salmonella serotype in New Zealand is S. Typhimurium (accounting for 64% of all strains isolated over the 1997–2008 period) followed by S. Enteritidis (~10%) (Table 2). The marked rise in Salmonella incidence (as measured by notification and hospitalization rates) during the period 1998–2003 was driven largely by a rise in S. Typhimurium particularly DT135, DT1, DT101, DT156, DT160 and by S. Brandenburg.
DISCUSSION
This is the first study to describe national patterns in salmonellosis notifications and hospitalizations in New Zealand. Salmonellosis incidence continues to be high, with a period of multiple overlapping Salmonella outbreaks that further increased incidence from 1997 to 2008. These findings demonstrate marked ethnic and socioeconomic inequalities in disease distribution, with higher hospitalization rates for Māori and Pacific peoples and those living in more deprived neighbourhoods. Results also suggest a different epidemiology in rural areas which experience higher overall rates and a spring peak that is absent in urban populations.
The reported incidence of salmonellosis in New Zealand is relatively high by international standards. Rates in comparable countries are 35·8/100 000 (Australia) [Reference Sumner, Raven and Givney17], 9·9/100 000 (USA) [Reference Arshad14] and 25·9/100 000 (Canada) [Reference Keegan18]. The summer peak in salmonellosis incidence is similar to that previously reported [Reference Bentham and Langford19]. It is hypothesized to be partly due to favourable ambient environmental conditions for pathogen survival [Reference Kovats20], seasonal variations in pathogen reservoirs [Reference Clark6], transmission pathways [Reference Haley, Cole and Lipp10] and host behaviour [Reference Ekdahl21]. Positive associations between temperature and salmonellosis incidence in countries across Europe [Reference Kovats20] and Australia [Reference Zhang, Bi and Hiller4] have been documented. In New Zealand, Britton et al. [Reference Britton5] estimated a 15% increase in notifications for every 1°C rise in average monthly temperature. This has important implications in New Zealand as temperatures are projected to rise by 2°C by 2090 relative to levels in 1900 [Reference Mullan22].
Studies have also reported a positive association between seasonal rainfall and Salmonella occurrence [Reference Haley, Cole and Lipp10]. Climate change projections for New Zealand include an increase in rainfall in western and southern areas, with increased frequency of heavy precipitation events in the west [Reference Mullan22]. Consequently, regional climatic differences could contribute to disproportionately adverse health outcomes for some populations.
Our study indicated relatively high notification and hospitalization rates in spring (September–November). Spring rates were strongly influenced by rural populations which experienced a dominant spring peak in addition to one in summer, unlike urban populations which have a single peak in summer. This difference probably reflects greater local exposures to environmental pathogen reservoirs and opportunities for pathogen–human contact due to seasonal host activities. A study in Scotland reported a spring peak in human salmonellosis cases, with pronounced infection rates in the farming community, compared to higher rates in late summer-early autumn in the general community [Reference Sharp, Paterson and Forbes23]. In New Zealand, S. Brandenburg, associated with the lambing season has been implicated in spring peaks in rural cases in southern New Zealand [Reference Clarke and Tomlinson24].
Results show that salmonellosis risk is significantly higher in rural areas, although the relationship with increasing degree of rurality is not linear. Analogous to other, enteric zoonotic pathogens such as Campylobacter and verocytotoxigenic Escherichia coli (VTEC) factors such as a high number of livestock [Reference Gilpin25], activities involving contact with contaminated surface water [Reference Jokinen26] and private water supplies [Reference Said27] have been associated with increased disease rates in rural areas. In New Zealand, an association between peak salmonellosis rates in humans and farming practices [Reference Clarke and Tomlinson24] and occupational contact with livestock [Reference Baker28] has been reported. Thus, common environmental exposures related to rural living and agricultural activity may be important determinants of salmonellosis incidence in New Zealand and warrant further research.
Consistent with published studies, strong age associations in disease incidence were identified. For both notifications and hospitalizations, the 0–4 years age group had the highest rates. This vulnerability could be a result of increased contact with infection sources [Reference Doorduyn29], susceptibility to infection due to inadequate immunity or a greater probability of seeking treatment [Reference Koehler30].
There is less comparable literature on ethnic and socioeconomic patterns in salmonellosis infections. Interestingly, the notification and hospitalization data presented here show opposite patterns with regard to ethnicity and deprivation. Notification rates for Europeans were the highest, while hospitalization rates were highest for Pacific and Māori populations. A similar reversal is shown for socioeconomic deprivation; while notification rates showed that the socioeconomically advantaged had the highest rates, hospitalization rates indicated the reverse. Other enteric illnesses in New Zealand such as cryptosporidiosis and giardiasis show similar patterns in notification data [Reference Snel31] with only one other study reporting similar patterns in ethnic differences between notifications and hospitalizations [Reference Baker, Sneyd and Wilson32]. In that study, the authors advocate that such inconsistent patterns could be due to poorer access to health resources resulting in lower rates of reported cases [Reference Baker, Sneyd and Wilson32]. Higher rates for certain ethnic groups could also indicate cultural differences relating to food preparation and handling, apparently unrelated to deprivation status [Reference Dixon33]. Our results highlight the importance of using multiple data sources to describe disease patterns as demographic disparities could be masked when using single sources.
The predominant Salmonella serotype in New Zealand is S. Typhimurium (accounting for 64% of all strains isolated over the 1997–2008 period) followed by S. Enteritidis (~10%). This is similar to patterns reported in Canada [Reference Guerin, Martin and Darlington34] and the USA [Reference Olsen35]. S. Typhimurium has been most commonly reported from urban areas in Canada and The Netherlands [Reference Ford36, Reference van Pelt37], suggesting that associated risk factors such as contaminated food of animal origin [Reference Greig and Ravel38] and sandboxes [Reference Doorduyn29] may be important sources of infection. In contrast, in New Zealand Salmonella Typhimurium DT160 is the most frequently isolated [Reference Thornley39], with hosts including humans, livestock and wild avian species [Reference Price-Carter40]. Moreover, while the number of S. Brandenburg infections remains low nationally, region specific rates have shown an increasing trend [Reference Clarke and Tomlinson24], tracking changes in environmental reservoirs [Reference Clark6]. Indeed, novel epidemics due to serovar DT160 and S. Brandenburg have been reported in New Zealand [Reference Price-Carter40]. Future research into Salmonella serotypes based on location characteristics such as urban/rural status, seasonality and known risk factors may be more informative for identifying pathogen reservoirs and formulating explicit prevention and control strategies.
The main limitation of this study is that it was based on passive surveillance data, which is known to suffer from significant underreporting [Reference Arshad14] and is of limited value in identifying possible infection sources [Reference Snel31]. However, as in this case, it does indicate areas for future research. Combining data from multiple sources identified some of the systematic biases that affect public health surveillance systems. In particular, notifications which are dependent on access to medical care and use of diagnostics services appear to under-represent Māori and Pacific peoples and more deprived populations. Such biases need to be considered when interpreting and using such data. Finally, different serotypes can be spatially and temporally distinct in their prevalence and transmission, potentially resulting in different patterns of disease incidence [Reference Haley, Cole and Lipp10]. Unfortunately, we were unable to address this in the present study.
Despite these limitations, analysis of aggregated national data can show important patterns in disease incidence. Seasonal patterns indicate that given prospective climate change impacts on health, clarifying the influence of climatic variables on salmonellosis incidence would be helpful. We also reported higher salmonellosis risk in rural areas, particularly in spring with regional increases in zoonotic strains. This has important implications for rural population health in New Zealand as livestock reservoirs are expected to grow. Future work focusing on these seasonal reservoirs and their transmission mechanisms could support disease prevention measures in these populations.
ACKNOWLEDGEMENTS
This work was funded by a University of Otago Postgraduate Research Scholarship.
DECLARATION OF INTEREST
None.


