


Studies have investigated the food environment in residential neighbourhoods, and researchers are increasingly alerting the population to the health risks of school food environments(Reference Larsen and Gilliland1–Reference Rundle, Neckerman and Freeman3). Walkability and availability of food outlets affect eating behaviours as well as physical activity, which have effects on health status, particularly on obesity(Reference Frank, Kerr and Saelens4).
With rising urbanization, the growing popularity of ready-to-eat food retailers makes fatty food easily accessible. Exposure to convenience stores and fast-food stores (CS and FS, respectively) is a known contributor to childhood obesity(Reference Galvez, Hong and Choi5, Reference Mellor, Dolan and Rapoport6). This exposure is likely to affect other aspects of growth, including physical, mental and social development. There may be gender differences in school environment-linked health outcomes, which may be consequential many years later(Reference Pan, Hsieh and Wahlqvist7).
Mapping studies have been conducted in various countries; however, when these studies were conducted on adult populations, they may have represented food-shopping behaviours that differed from those of children(Reference Morland and Evenson8). Studies involving youth are largely located within Western settings in North America and Europe(Reference Davis and Carpenter9, Reference Van Dyck, Cardon and Deforche10). In the USA, where the prevalence of childhood obesity is epidemic, policy makers are urgently working towards reforming the school food environment, mainly with respect to school lunches(11). Fast-food restaurants appear to target neighbourhoods of poor sociodemographic make-up, resulting in further inequalities in accessibility to healthy foods(Reference Kestens and Daniel12, Reference Kwate and Loh13). Controlling the food environment within the school may be a useful way to prevent obesity by reducing energy intake(Reference Fox, Dodd and Wilson14).
The perceived availability of FS and CS was associated with a higher intake of unhealthy foods among secondary-school students in Hong Kong(Reference Ho, Wong and Lo15). To our knowledge, geographical mapping of Asian communities and commercial food landscapes has not been performed yet; this procedure may help us understand the health implications in a densely populated setting. In Taiwan, CS and FS are ubiquitous in urbanized areas; high exposure to processed foods may have an effect starting from elementary school, shaping the dietary behaviours of consumers beyond childhood.
Studies have generally looked at only body weight or BMI but not at other anthropometrics, which may be additional evidence of clinically relevant obesity. For example, stature is recorded to calculate BMI but not looked at in its own right and as a growth indicator(Reference Duffey, Gordon-Larsen and Jacobs16); body circumference and skinfold measurements may not be used to provide more direct measures of body fatness and distribution. Birth weight has also not been considered as an interactive factor for obesity in relation to fast food. Life-long trajectories for body compositional disorders begin during childhood, or even prenatally; maternal nutrition and health can influence a child's growth at birth and later(Reference Delemarre-van de Waal17). Moreover, childhood obesity, which precedes adult diseases that are chronic and difficult to treat, offers possibilities for early prevention. We have taken the opportunity to map the school environments of primary-school children in the population-representative Nutrition and Health Survey in Taiwan (NAHSIT) conducted during 2001–2002(Reference Pan and Lee18). Body composition has been assessed in relation to two types of food store exposure: ‘FS’ and ‘CS’. In addition, we considered the role of birth weight in body compositional response to the school food environment.
Materials and methods
Study sample
The data set used comprised the elementary-school children who participated in NAHSIT 2001–2002. The design and sampling of this survey has been described elsewhere(Reference Tu, Hung and Chang19). The sampled 359 townships/districts of Taiwan were classified into thirteen strata by regional dietary patterns, urbanization and geographical characteristics. In total, 2407 children aged 6–13 years from 104 elementary schools (eight from each stratum) were randomly selected by a ‘probability proportional to population size’ approach. They underwent health examinations and household interviews, providing demographic and anthropometric information. Birth weight data were obtained from the Taiwan Birth Registry. The present study excluded children without birth weight information (n 119) as well as inconsistent genders in the two data sets (n 5), leaving 2283 schoolchildren eligible for analysis, who were representative of the 1 809 687 schoolchildren in Taiwan at that time. Ethical approval was granted by the Institutional Review Board of Academia Sinica and by the National Health Research Institutes, Taiwan.
Geocoded mapping
School addresses were obtained from the NAHSIT data and transferred to a geocoded database using a Geo Gadget designed by the Center for Geographic Information Science (GIS), Academia Sinica, Taiwan. We applied the Geo Gadget to transfer the geocoded nominal data of 104 elementary schools into spatial coding with XY coordination for analysis. The map in Fig. 1 shows the sampled schools from NAHSIT represented by black dots over stratified regions. In addition to fresh produce markets and street vendors in Taiwan, there are two kinds of ready-to-eat food outlets: one comprises fast-food restaurants such as McDonald's, KFC and Burger King and the other comprises CS such as 7–11, Family Mart, OK, Hi-Life and Niko Mart. A food outlet location database was purchased from RITI Technology Inc. (RITI Technology Inc., unpublished results), which corresponded to the NAHSIT 2001–2002 time frame. The food outlet addresses were corrected using websites, yellow pages or magazines or by means of telephone calls to the stores. A digitalized database was then set up using the TWD97 TM2 coordinate system (Taiwan Datum 1997) and the reference ellipsoid GRS80 (Geodetic Reference System 1980) adopted by the International Union of Geodesy and Geophysics.
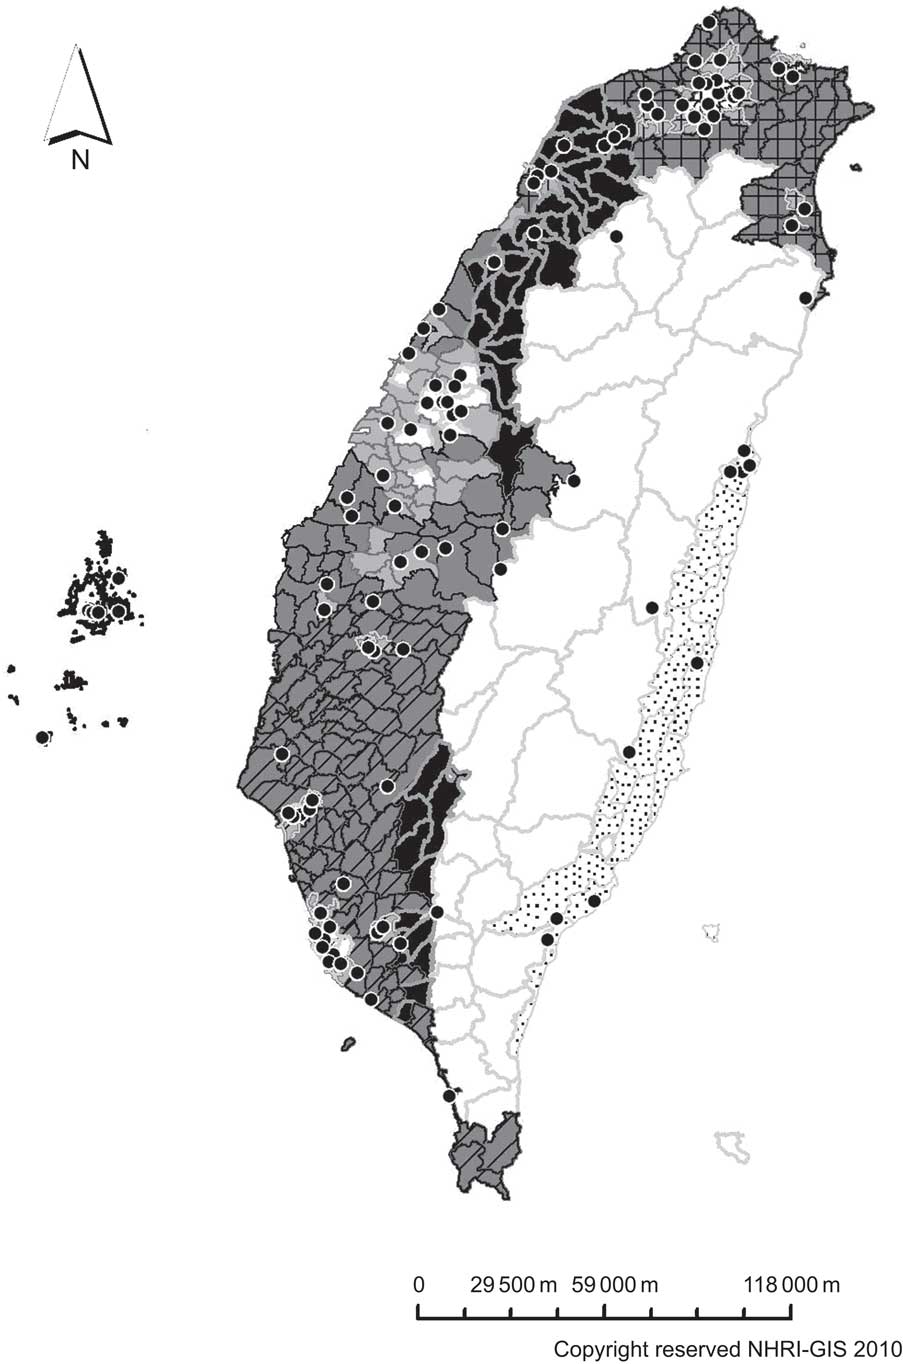
Fig. 1 Map of schools (•) and regional strata (![]() , Hakka area;
, Hakka area; ![]() , mountain area;
, mountain area; ![]() , Eastern area;
, Eastern area; ![]() , PengHu island;
, PengHu island; ![]() , first stratum in the Northern area;
, first stratum in the Northern area; ![]() , second stratum in the Northern area;
, second stratum in the Northern area; ![]() , third stratum in the Northern area;
, third stratum in the Northern area; ![]() , first stratum in the Central area;
, first stratum in the Central area; ![]() , second stratum in the Central area;
, second stratum in the Central area; ![]() , third stratum in the Central area;
, third stratum in the Central area; ![]() , first stratum in the Southern area;
, first stratum in the Southern area; ![]() , second stratum in the Southern area;
, second stratum in the Southern area; ![]() , third stratum in the Southern area) in Taiwan. Black dots represent each sampled school from the Nutrition and Health Survey in Taiwan (NAHSIT) 2001–2002
, third stratum in the Southern area) in Taiwan. Black dots represent each sampled school from the Nutrition and Health Survey in Taiwan (NAHSIT) 2001–2002
Buffer analysis
A circular buffer of 500 m was calculated from each school, corresponding to an approximate 10 min walk distance. The school and food outlet locations were combined from two forms of geocoded databases; thereafter, weighted survey variables were added to the school neighbourhoods. Fast-food restaurant and CS availabilities were computed within this buffer area.
Anthropometrics and covariates
Anthropometrics were collected during the NAHSIT physical examinations conducted at the schools. Because children's growth rates differ greatly in this age group, we calculated gender- and age-specific Z-scores for height, weight, BMI, waist circumference and triceps skinfold thickness (TSF) using 1-year intervals. The NAHSIT also conducted face-to-face household interviews to obtain information regarding family members, sociodemographics, nutritional attitudes and behaviours, as well as physical activity and diet(Reference Tu, Hung and Chang19). The Youth Healthy Eating Index–Taiwan (YHEI–TW), a scoring system modified from the US YHEI, was used to assess the children's dietary quality(Reference Feskanich, Rockett and Colditz20, Reference Yu21). Scores ranging from 0 to 90 were calculated from the 24 h dietary recall and FFQ, with higher scores indicating better dietary quality.
Covariates considered in the present study included age, ethnicity (Fukienese, Hakka, Mainlander, indigenous and others), father's education (up to primary school; high school; and above), household income (none, <20 000; 20 000–40 000; >40 000 NTD/month), pocket money (none; ≤100; ≤500; >500 NTD/month), birth weight (low; normal; high), physical activity (none; <30; <60; ≥60 min/d), time spent watching television (TV) on weekdays (≤1; 1–2; 2–3; ≥3 h/d), dietary quality (YHEI–TW; score range: 0–90) and region (Hakka; mountainous; Eastern; Penghu; Northern 1–3; Central 1–3; Southern 1–3).
Statistical analyses
Statistical analyses were performed using the statistical software packages SAS for Windows version 9·1 (SAS Institute, Cary, NC, USA) and SUDAAN (Survey Data Analysis) version 8 (Research Triangle Institute, Research Triangle Park, NC, USA), the latter using a Taylor series expansion to adjust variance estimates and achieve population representativeness with adjustment for the effect of sampling design. An unbiased sd for Z-score calculation was obtained by multiplying the adjusted se from SUDAAN by the square root of the corresponding sample size. The χ 2 test and the t test were used to identify the different demographics. Regression analysis was used to compare the body composition of schoolchildren with the number of food outlets among regions, using Central 1 as the reference group since it was closest to the medians of most measurements. To evaluate the impact of covariates, five multiple linear regression models for boys and girls were sequentially formed from fixed to changeable variables (model 1: age; model 2: social status; model 3: birth weight; model 4: personal behaviours; and model 5: region) to elucidate the relationship between ready-to-eat food stores and body composition. Statistical significance was defined as P < 0·05.
Results
There were no significant differences in demographic characteristics between boys and girls, including father's ethnicity and education, household income, pocket money, TV watching, physical activity and dietary quality (YHEI–TW; Table 1).
Table 1 Demographics and personal behaviours of the schoolchildren by gender (n 1 809 687)

NTD, New Taiwan Dollars; TV, television; YHEI–TW, Youth Healthy Eating Index–Taiwan.
Data were weighted for unequal probability of sampling design by SUDAAN software.
*YHEI–TW total score ranges from 0 to 90, with higher scores indicating better dietary quality.
Table 2 compares the anthropometric measurements of schoolchildren. Schoolchildren in mountainous areas had lower birth weight, height, body weight and TSF compared with children of other regions. BMI and waist circumference were lowest for schoolchildren living in Penghu.
Table 2 Mean birth weight and body composition of the schoolchildren by region (n 1 809 687)

TSF, triceps skinfold thickness.
Data were weighted for unequal probability of sampling design by SUDAAN software. Because of rounding, percentages do not total 100.
Mean values were significantly different from those of the Central 1 region: *P < 0·05, **P < 0·01, ***P < 0·001.
†Z-scores were gender and age specific.
The school neighbourhoods with the highest densities of CS and/or FS were located in the Northern 1 region, followed by Southern 1 (Table 3). This could be reasonably expected since Northern 1, Central 1 and Southern 1 were the most urbanized and densely populated areas. Schools in remote areas including mountainous areas, Penghu and Southern 3 had no CS or FS within a 500 m radial distance. These observations are reflected in the percentages of coefficients of variation, which allow regional comparisons of store density.
Table 3 Mean store numbers and CV% within 500 m around the school on the basis of region (n 1 809 687)
FS, fast-food store (McDonald's, KFC and Burger King); CS, convenience store (7–11, Family Mart, OK, Hi-Life and Niko Mart); CV (%), percentage of CV.
Data were weighted for unequal probability of sampling design by SUDAAN software.
Mean values were significantly different from those of the Central 1 region: *P < 0·05, **P < 0·01, ***P < 0·001.
A positive association was found between the number of FS and boys’ weight and BMI (β = 0·076 and 0·077, respectively; P < 0·05), as well as with girls’ height (β = 0·093; P < 0·05; Table 4). In other words, for each additional fast-food outlet within the school neighbourhood, the Z-score of girls’ height increased by 0·093. Adjustment for birth weight (model 3) rendered a non-significant association for boys’ waist circumference (β decreased from 0·069 to 0·060). In model 1, boys’ TSF was significantly associated with the number of FS (β = 0·053, P < 0·05); however, the significance was lost in model 2 (β = 0·048). Girls’ weight, BMI, waist circumference and TSF, as well as boys’ height, were not significantly related to either CS or FS within the school neighbourhood.
Table 4 Multiple regression results for body composition (height, weight, BMI, waist circumference and TSF) and store numbers within 500 m around the school on the basis of gender (n 1 809 687)
TSF, triceps skinfold thickness; CS, convenience store (7–11, Family Mart, OK, Hi-Life and Niko Mart); FS, fast-food store (McDonald's, KFC and Burger King); YHEI–TW, Youth Healthy Eating Index–Taiwan.
Model 1: adjusted for age.
Model 2: model 1 + ethnicity, father's education, household income and pocket money.
Model 3: model 2 + birth weight (lower, normal and higher birth weight).
Model 4: model 3 + physical activity, weekday television watching time and food quality (YHEI–TW).
Model 5: model 4 + region.
*P < 0·05, **P < 0·01, ***P < 0·001.
Discussion
Fast-food outlets, body composition and gender
We have found that FS, to a greater extent than CS, predicted body weight and BMI for boys, but not significantly for girls. Considering height as an index of growth, girls were taller when they had greater exposure to FS, but this was not so for boys. This factor has both short- and long-term health implications, differing by gender, especially for diabetes, CVD and cancer(Reference He, Zhang and Hunter22, Reference Lakshman, Forouhi and Sharp23).
Our results suggest that, in relation to FS and CS exposure, boys and girls experience different susceptibilities and physiological adaptations. The reason for this is unclear; however, a closer look at behavioural differences such as frequency of visits and purchases at these stores may help explain the gender differences. Nevertheless, although the types of food may differ culturally, socially and biologically, the basic belief is that a more abundant food exposure of the FS type or the presentation of food alters physical growth in boys and girls in potentially unhealthy ways. Although it is also possible that physical activity affects growth differently in boys and girls, we have adjusted for this and have found that it does not account for our findings. There are non-food environmental factors that must be considered in this complex equation, but some, like the advertising and food promotional context, could not be evaluated by us (except TV watching). However, we have taken into account a range of socio-economic factors in the models, which do not alter the findings. Of considerable interest is the fact that inclusion of overall dietary quality in the models, by way of the YHEI–TW, did not alter the findings; it is conceivable that there is varying dietary resilience, which allows biological protection for some children. If this is the case, there may be an adverse non-food quality contribution from FS, and this is plausible given what is known about the socio-behavioural and neuro-endocrine regulation of body composition and growth(Reference Bjorntorp24).
Research has suggested that adiposity influences pubertal development differently in boys and girls(Reference Wang25). Overweight girls tend to experience thelarche, pubarche and menarche at an earlier age compared with those with normal BMI(Reference Wang25, Reference Rosenfield, Lipton and Drum26); body fat can stimulate hormonal imbalance. Although girls typically become taller and reach puberty earlier than boys (boys catch up in later adolescence), the possibility of advancing pubescence by way of a high FS environment is a serious concern. Earlier onset of pubertal milestones has been linked to risk of breast cancer, apart from other types of diseases(Reference Ahlgren, Melbye and Wohlfahrt27, Reference Moorman, Palmieri and Akushevich28); however, some studies have challenged this association(Reference Herrinton and Husson29, Reference Osuch, Karmaus and Hoekman30).
Although obesity does not appear to induce precocious puberty in boys(Reference Biro, Khoury and Morrison31), it often precedes chronic diseases in adulthood. There is growing prevalence of the metabolic syndrome occurring within younger age groups. A recent study of the same data set found that metabolic syndrome could be predicted by waist circumference and BMI in Taiwanese children, especially in boys(Reference Chuang and Pan32). We found these same anthropometrics to be linked to FS exposure, although adjustment for region removed the significance for waist circumference, even after applying a sensitivity test by excluding regions with no fast-food outlets (data not shown). Because region presents possible overlaps with ethnicity, adjustment for this variable may have resulted in over-adjustment. Nevertheless, fast-food exposure evidently contributes to overweight in children and long-term health outcomes.
Relevance of birth weight
Birth weight can affect pubertal growth(Reference Olivo-Marston, Graubard and Visvanathan33), as well as obesity in childhood or adulthood. The latter may be attributed to the expression of ‘thrifty’ genes in utero, which enables the efficient storage of fat during periods of food abundance and results in consequent nutrition-related diseases(Reference McCance, Pettitt and Hanson34). This is further suggested by Barker's theory, which describes low birth weight as a risk factor for subsequent patho-physiological disturbances in adult life, including CHD(Reference Barker35). Although schoolchildren from mountainous areas had the lowest birth weight, rather than overweight, they had the smallest body size with the shortest stature and lowest body weight. The absence of fast-food restaurants in this region, as well as low birth weight or poor maternal nutritional status, which is dependent on accessibility to ‘healthy’ food choices, may play an interactive role in children's growth.
School neighbourhood and locality
The application of buffer analysis is a useful and notable GIS method. The method allows the drawing of a circular area and extraction of data from other dimensions within the coverage area, such as fast-food restaurants and CS. In the USA, a half-mile (805 m) distance around a residential address has been defined as a living neighbourhood(Reference Rundle, Neckerman and Freeman3). Most urban planners assume that a half-mile (800 m) is a walkable distance(Reference Rundle, Neckerman and Freeman3, Reference Agrawal, Schlossberg and Irvin36–Reference Cervero38). In Canada, mapping of ‘food deserts’ in different cities has addressed the accessibility to supermarkets within 1000 m(Reference Larsen and Gilliland1, Reference Apparicio, Cloutier and Shearmur39). Kestens and Daniel(Reference Kestens and Daniel12) used a 10 min walk pace to measure the road–school buffer. Huang et al.(Reference Huang, Hung and Sharpe40) applied questionnaires to analyse the activity of Taiwanese schoolchildren aged 11–12 years (5th and 6th grades), and they divided activities into three categories: running (8·0 kph or 5·0 mph); brisk walking (5·6 kph or 3·5 mph); and walking (4·0 kph or 2·5 mph). If we took 4·0 kph and 10 min walk distance as a catchment area, this would be approximately 667 m. On the basis of elementary-school children, as well as on the basis of higher residential density in Taiwan (i.e. limited geographical sparseness), a road buffer of 500 m was calculated around each school, corresponding to a 10 min walk at a pace of 50 m/min. A sensitivity analysis was carried out that extended the assessment of radius around schools to 700 m. It was found that the peak findings for weight in boys and height in girls were within a 500 m radius (data not shown). The use of school neighbourhoods as the basis for the present study takes into consideration the walkability (physical activity) and also, importantly, the accessibility to high-energy-density foods for young children.
Children in Penghu were found to be leaner than children of most other regions, showing lower BMI and waist circumference. No CS or FS was found on the islands located offshore of Taiwan during the survey period. However, its remoteness may not be the same as in mountainous areas, where the children also tended to be smaller in size. Ethnic background is likely to play a role in body composition; mountainous and eastern regions comprised the highest proportions of indigenous schoolchildren in Taiwan (81·4 % and 25·0 %, respectively), whereas Penghu had no indigenous population. Physical activity may also differ significantly between these regions, perhaps explaining the distinctive body fat distribution (i.e. waist, TSF). A recent Taiwanese study showed that the physical activity of schoolchildren varied between urban and rural areas, where urban children participated in a greater amount and more types of physical activity compared with rural children(Reference Huang, Hung and Sharpe40). Although we did not classify the sampled strata as rural or urban, population density was considered in the stratification of regions; regions with lower population densities were likely to limit physical activity to walking, hiking and riding a bicycle, whereas urban city dwellers had more variety. Having said that, exercise variety appears to be less important than time spent being active, since children of less urbanized regions (mountainous, Hakka and Penghu) engaged in more physical activity compared with the rest (data not shown) and were also less overweight.
Strengths and limitations
On account of the cross-sectional nature of the study, except for birth weight, causality could not be conclusively determined. However, the opportunity to evaluate a population representative sample, with time-matched school and store data sets, improved statistical reliability and extrapolability.
We could not account for other food outlets such as street vendors, school lunches and other food sources. In Taiwan, these are likely to be significant sources of food for young students. FS and CS, however, present the opportunity to investigate the relative risks and merits of highly processed, low-nutrient, energy-dense food consumption and its alternatives; the comparative design between FS and CS increases the confidence in these interpretations, without recourse to choices through other food vendors. The differential distribution between regions (i.e. abundant in urban areas, no stores in remote areas) also allows the public health implications of a range of FS establishments to be canvassed.
The ‘buffer analysis’ approach allowed us to identify stores located within circular areas, with each school as the origin point. However, it does not provide for the various configurations along which pedestrians actually move (i.e. streets, footpaths); a ‘network analysis’ could address this in a way currently unavailable to the present investigators(Reference Oliver, Schuurman and Hall41). Moreover, although we did not have information within the precinct of the school, the NAHSIT data set provided information on whether the children walked to school and how long they took, but not the distance. These were part of physical activity measures that took into consideration walking to school, which we have adjusted for in model 4 and which did not alter the findings.
The negative findings for food quality by the YHEI–TW and its relationship with FS densities may be a function of the methodology or a finding that offers insight or possible explanations into the nutritional sociology of food outlets to which children are exposed in various ways. The YHEI de-emphasises energy intake, which may be a pathway to food-outlet-linked body compositional disorders; it is inversely related to physical inactivity, a presumed non-food-related pathway, while reflecting food diversity with its health relevance beyond growth and short-term body compositional status(Reference Feskanich, Rockett and Colditz20, Reference Hurley, Oberlander and Merry42). It could be argued that a simpler, less-judgemental index of food quality than one that preconceives healthy foods, such as a food diversity score, might serve to assess food-outlet-linked growth and body compositional disorders more effectively(Reference Lee, Huang and Su43). In the meantime, the authors have looked at a range of energy-dense foods eaten and have been unable to find any that exhibited a difference by food store density. It is also possible that the exposures (YHEI–TW) among children had been relatively narrow and that the opportunity to see related effects on anthropometry had been limited.
The effects of food outlets on food-related health may, however, depend on characteristics not measured. They include past exposure and food memory (such as fast-food birthday parties), peer-group acceptability, sensory experiences (such as taste, texture, smell and appearance) and programmed expectations about serving size actuated elsewhere, as well as the extent to which background personal and household food behaviours are affected by food store density, among others(Reference Wahlqvist44).
Implications
The observed effect of FS exposure on children emphasizes the importance of ensuring healthier food sources, such as home-prepared school lunches, or personally controlled snacks. As noted by Sturm(Reference Sturm45), easy access to highly processed, fatty foods in the immediate vicinity of a school ‘could easily negate school food policies, especially among students who can leave campus. Surrounding food outlets could also lower the effectiveness of health education in the classroom by setting a highly visible example that counters educational messages’. Urban planners must consider the implications of CS and FS within school neighbourhoods as a public health burden.
Rundle et al.(Reference Rundle, Neckerman and Freeman3) showed evidence that better access to BMI-healthy food stores was linked to lower BMI. It seems that children's developmental growth is vulnerable to their surrounding food environment; their physical adaptations are becoming apparent, as obesity has now become an epidemic among children and youth. Prevention of childhood obesity through improved food choices and physical activity has tremendous potential to curb the incidence of chronic disease. There is a need for public health policy to restrict the establishment of fast-food vendors; alternatively, healthier food choices can be promoted, particularly in the vicinity of school neighbourhoods. It has already been appreciated that food-based community-directed strategies are those most likely to curtail nutrition-related health problems(Reference Wahlqvist44, Reference Sanigorski, Bell and Kremer46).
Conclusions
FS exposure in Taiwan, more so than CS exposure, increases the risk of general and abdominal obesity in boys and stature in girls. These findings have long-term implications for chronic disease in boys and risk of breast cancer in girls. Further food mapping studies, with a closer look at accessibility and usage, can be expected to deepen our understanding of the complex food choice environment and provide opportunities to arrest the obesity epidemic.
Acknowledgements
The present research was supported by the National Health Research Institutes, Taiwan. The authors have no conflict of interest to declare. P.-H.C., M.L.W. and M.-S.L. planned and contributed to all stages of the study; P.-H.C., M.L.W., M.-S.L. and L.-Y.H. performed data analysis; P.-H.C and H.-H.C. conducted the geocoded mapping; S.T.-Y.H. prepared the initial manuscript. All authors commented on the draft, contributed to the interpretation of the findings and approved the final version of the manuscript.


