


CVD is the leading cause of premature death and disability globally(1). Major clinical complications of CVD such as CHD, myocardial infarction and stroke manifest at middle or older age. However, it has been established that the atherogenic process (i.e. onset of lesions and fatty streaks in the aorta and coronary arteries) starts earlier, in childhood(Reference McGill, McMahan and Herderick2, Reference Enos, Holmes and Beyer3). Furthermore, worrisome incidences of elevated CVD risk factors in children and adolescents have been observed in several countries(Reference McGill, McMahan and Malcom4–Reference Berenson, Srinivasan and Nicklas7). In a recent survey of 324 Chilean children aged 4 years, 20 % had high total and LDL-cholesterol levels and 50 % of children had low HDL-cholesterol levels(Reference Corvalan, Uauy and Kain5). Children with elevated cholesterol levels tend to have higher levels later in life, and they are thus likely to have increased risk of CVD in adulthood(Reference Webber, Srinivasan and Wattigney8–Reference Lauer and Clarke10).
For adults, it has been established that the fatty acid composition of the diet is a key factor affecting the blood lipid risk profile(Reference Jakobsen, O'Reilly and Heitmann11). There is strong and convincing evidence that higher intakes of SFA and trans-fatty acids (TFA) and lower intakes of PUFA (mainly linoleic acid (LA; 18 : 2n-6) and α-linolenic acid (ALA; 18 : 3n-3)) have adverse effects on the blood lipid risk profile(Reference Mensink, Zock and Kester12) and increase the risk of CHD(Reference Jakobsen, O'Reilly and Heitmann11, Reference Mozaffarian, Micha and Wallace13). Evidence on the effects of dietary fatty acids on blood lipids in children is much less abundant than that in adults. Nevertheless, several studies indicate that dietary fatty acids affect serum lipids in children in the same way as they do in adults(Reference Nicklas, Farris and Smoak14, 15). Corvalan et al. (Reference Corvalan, Uauy and Kain5) suggest that the high prevalence of children with elevated LDL-cholesterol and low HDL-cholesterol in Chile is due to the high content of SFA and TFA in the local diet. In the Dietary Intervention Study in Children (DISC)(Reference Lauer, Obarzanek and Hunsberger16) and the Special Turku coronary Risk factor Intervention Project for children (STRIP)(Reference Lapinleimu, Salo and Routi17), diets with reduced SFA ( < 10 % energy; %E), increased PUFA (6–10 %E) and a total fat content of about 30 %E were found to lower total and LDL-cholesterol in children.
Reducing SFA intake is a major focus of most international dietary guidelines and recommendations aimed to prevent CVD. The WHO emphasises the need for the general population to lower intakes of SFA and TFA, and to increase intakes of PUFA(18). However, reliable data on fat and fatty acid intake in children are lacking, and the relationship between fatty acid intake in childhood and risk of future chronic disease is not clearly established. Uauy & Dangour(Reference Uauy and Dangour19) recently reviewed dietary fat and fatty acid intake recommendations for children (2–18 years). They concluded that, in view of the limited evidence currently available, fat and fatty acid intakes in children above the age of 2 years should follow the dietary guidelines for adults that aim at the prevention of future chronic disease.
Here we report a systematic review of the available population data on fatty acid intake in children and adolescents from various countries across the world. Reported intakes are compared with the population nutrient intake goals for the prevention of chronic diseases as defined by the WHO(18).
Methods
Search strategy
To estimate dietary fat and fatty acid intakes in children and adolescents, a literature search in PubMed (from 1995 to March 2010) was conducted using the following search string: (total fat, saturated fats, SAFA, polyunsaturated fats, PUFA, monounsaturated fatty acid, MUFA) AND (consumption OR dietary OR intake OR survey) AND (children OR adolescents) as words in the abstract. Reference lists of all articles of interest were checked for additional studies. No language restrictions were used. In addition to the PubMed literature search, national intake data were collected through nutritionists at local Unilever offices representing eighty-one countries.
The initial search yielded 845 publications and reports (Fig. 1). These publications and reports were screened to determine eligibility of data based on the following criteria: (1) representative national survey or observational study measuring dietary fatty acid intake; (2) published during or after 1995; (3) data from healthy children or adolescents (aged>2–18 years); and (4) complete information provided on intake of total fat plus individual fatty acids (SFA, MUFA and PUFA). For countries where multiple data were available, data from national dietary surveys were preferred. If these were not available, representative data from population-based observational studies were considered, and when these were not available, data from household food budget surveys were considered. This initial selection resulted in fifty-three potentially eligible data sources. In a subsequent selection step, twenty studies were excluded for the following reasons: (1) duplicate data set in a similar age group from the same country (n 10) so in these cases only the most recent datasets were used; (2) incomplete information on individual fatty acid intakes (n 4); (3) surveys only reporting data of specific ethnic or minority groups in the population (n 3); (4) studies which included children aged < 2 years (n 2); and (5) data reported for one sex only (n 1).

Fig. 1 Selection procedure and number of surveys and studies included and excluded from the review.
Quality of data
The included data were assessed and scored on quality using four criteria: (1) type of data source; (2) dietary assessment method; (3) year of publication; and (4) sample size (Table 1) (18, Reference Biro, Hulshof and Ovesen20–Reference Willett22). Survey type and dietary assessment method were given the highest weight (maximum score of 3) in the quality score. For year of publication and sample size the maximum score was 2. The total attainable quality score of a study thus ranged between 4 and 10.
Table 1 Criteria for evaluating scoring the data quality
* National dietary surveys scored 3, as these are the preferred type of study to estimate the distribution of nutrient intake in a population. Population-based studies were scored 2, as these tend not to be nationally representative. Household food budget surveys were scored 1, as they are of limited value in estimating the food intake of an individual(Reference Biro, Hulshof and Ovesen20–Reference Willett22).
† Weighed food record (3 and 7 d) methods are the highest-quality dietary assessment method for estimating the usual intake of foods in individuals, and hence were scored 3. Multiple 24 h recalls, or combining two different dietary assessment methods, such as 24 h recall with FFQ, increases the reliability and improves the dietary assessment, and hence were scored 2. On its own, the FFQ or 24 h recall was scored 1, due to lower quality of the methods for assessing usual intake(Reference Biro, Hulshof and Ovesen20–Reference Willett22).
‡ Recent data (published>2000) scored 2, as data older than 10 years may not be representative of current fatty acid intake due to changes in consumption patterns of oils and fats in various countries(18). Older surveys from ≥ 1995–2000 were scored 1 and data older than 15 years were not included.
§ Studies of larger sample size (>1000) were scored 2, while data with < 1000 subjects were scored 1.
Based on the resulting total score, data were divided into three categories: (1) high quality (total score 9–10); (2) medium quality (total score 6–8); and (3) low quality (total score 4–5).
Quantitative data synthesis
From each data source, we extracted the mean values and standard deviations of total fat, SFA, MUFA and PUFA intakes. Where fatty acid intakes were expressed as absolute amounts (g), values were converted to percentage of total energy intake (%E), using the reported mean energy intake. Where data were reported for subgroups (for example, by age range or by sex), a weighted mean was calculated by weighting the mean intake of each subgroup by the number of the subjects in the subgroup. When standard deviations were not given, they were calculated using the population sample size and reported standard errors of the mean.
The percentage of children from each country meeting the recommended intake for SFA (% < 10 %E) and PUFA (% 6–10 %E) was estimated using the reported mean values and standard deviations, assuming a normal distribution of the data. The calculated z-scores ((x − μ)/sd) were used to find P values (the probability) based on a normal distribution probability table(Reference Massart, Vandeginste and Buydens23).
For France, The Netherlands, Australia, and Mexico the standard deviations or standard errors of the mean of intakes were not available and therefore the percentage of children meeting the recommendations for these countries could not be calculated.
Recommended fatty acid intake
The mean intakes for each country were compared with the general population nutrient intake goals set by the WHO in 2003(18) for the prevention of chronic diseases: total fat 15–30 %E; SFA < 10 %E, TFA < 1 %E and PUFA 6–10 %E (of which 5–8 %E of n-6 (LA) and 1–2 %E of n-3 fatty acids (ALA)). For EPA and DHA there are no quantitative nutrient intake goals, but intakes for children are advised to be consistent with the general goal for the adult population, which is regular intake of one to two fatty fish meals per week(18).
Results
Data from thirty-one countries met the inclusion criteria. National dietary surveys were available for twenty-two countries; for eight countries, population-based observational studies (including one control group from a population-based intervention study) provided representative data on fat and fatty acid intake. Based on predefined scoring criteria, the quality of the intake data was high for twelve countries and medium for eighteen countries. Household food budget survey data were found for only one country (Brazil). Because the quality score was low and the results difficult to compare with those from other countries, we excluded these data from Brazil (Fig. 1).
From two countries, Belgium and New Zealand, two separate datasets reported intake in children and adolescents each and the quality scores were similar for the two different datasets from these countries (Table 2). Thus the present systematic review resulted in thirty-two eligible data set representing thirty countries.
Table 2 Characteristics of surveys and studies providing dietary intake data for thirty countries

ESKIMO, Ernährungsstudie als KIGGS -modul; MABAT, Israeli National Health and Nutrition Study; MHNS, Mexican Health and Nutrition Survey; NHANES, National Health and Nutrition Examination Survey.
* See unpublished results in Misra et al. (Reference Misra, Khurana and Isharwal57); data from a representative sample from the general population in New Delhi, India.
Mean daily intake of total fat ranged across countries from 23 to 40 %E in children and from 25 to 40 %E in adolescents (Table 3). In three of the thirty countries, namely Japan, Mexico and South Africa, the mean total fat intakes of children and adolescents met the recommended total fat intake ( < 30 %E). The percentage of children meeting the recommended fat intake ( < 30 %E) ranged from 2 to 85 % in all countries.
Table 3 Intake of total fat, SFA, MUFA and PUFA among children (aged 2–10 years) and adolescents (aged 11–18 years) in thirty countries
(Mean values and standard deviations)

%E; percentage energy; n/a, not available.
* Standard deviation calculated from the standard error of the mean.
† See unpublished results in Misra et al. (Reference Misra, Khurana and Isharwal57); data from a representative sample from the general population in New Delhi, India.
Mean daily intake of SFA ranged across countries from 1 to 15·2 %E in children and from 1 to 15·8 %E in adolescents (Table 3). In twenty-eight out of the thirty countries, children and adolescents had mean SFA intakes above the recommended WHO population nutrient intake maximum of 10 %E (Table 3 and Fig. 2). In all countries, less than 50 % of children and adolescents met the recommended ( < 10 %E) SFA intake, except for Japan (100 %) and South Africa (91 %).
Fig. 2 SFA intakes (% energy) in children (![]() ) and adolescents (
) and adolescents (![]() ) in thirty countries. Values are means. (
) in thirty countries. Values are means. (![]() ), Cut-off for the maximum dietary SFA (10 % energy) intake recommended by the WHO(18).
), Cut-off for the maximum dietary SFA (10 % energy) intake recommended by the WHO(18).
Mean daily intake of PUFA ranged across countries from 3·5 to 9·7 %E in children and from 3·6 to 11·2 %E in adolescents (Table 3), and was lower than the recommended WHO population nutrient intake range for PUFA (6–10 %E) in twenty-one out of the thirty countries (Table 3 and Fig. 3). Similar to SFA, less than 50 % of children and adolescents from all countries met the recommended (6–10 %E) PUFA intake, with the exceptions of Hungary (69 %), Israel (69 %), Japan (67 %) and the UK (59 % of 11- to 18-year-olds) (Table 3). Even in countries with the highest mean total fat intakes (>35 %E), namely Belgium, France, Portugal and Spain, mean PUFA intakes did not reach the lower 6 %E limit of the recommended range.

Fig. 3 PUFA intakes (% energy) in children (![]() ) and adolescents (
) and adolescents (![]() ) in thirty countries. Values are means. (
) in thirty countries. Values are means. (![]() ), Total PUFA intake range (6–10 % energy) recommended by the WHO(18).
), Total PUFA intake range (6–10 % energy) recommended by the WHO(18).
For eleven of the thirty countries, additional data on LA and ALA intakes were available; and for five countries data on the long-chain n-3 fatty acids EPA and DHA were also reported (Table 4). Mean intake of ALA was lower than the recommended 1–2 %E in ten countries, and mean intake of LA was lower than the recommended 5–8 %E in eight out of these eleven countries (Table 4). In five countries, mean intakes of total EPA and DHA varied between 45 and 150 mg in children and between 40 and 160 mg in adolescents (Table 4).
Table 4 Linoleic acid (cis-18 : 2n-6; LA), α-linolenic acid (cis-18 : 3n-3; ALA), EPA and DHA intakes among children and adolescents*
(Mean values and standard deviations)
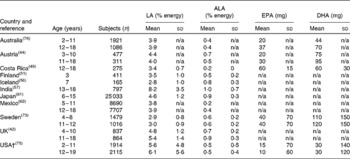
n/a, Not available;
* Total n-3 fatty acid intakes can be derived from summing the data for ALA, EPA and DHA.
† Standard deviation calculated from the standard error of the mean.
In two of the five countries for which TFA intake data were available (India and the UK), reported mean TFA intakes exceeded the recommended maximum of 1 %E (Table 5).
Table 5 Trans-fatty acid (TFA) intake in children and adolescents in five countries
(Mean values and standard deviations)
n/a, Not available.
Discussion
The present review indicates that in the majority of the countries for which fatty acid intake data are available, at least half of the children and adolescents do not meet the recommended SFA and PUFA intakes for the prevention of CVD(18). This is of public health concern, because dietary fat quality is an established determinant of the blood lipids and CVD risk(Reference Jakobsen, O'Reilly and Heitmann11), and fatty acid intake in childhood may have large consequences for CVD incidence in future adult populations.
Elevated blood cholesterol levels occur early in life
Cohort studies in the USA(Reference Ford, Li and Zhao24), Finland(Reference Viikari, Akerblom and Seppanen25) and Chile(Reference Corvalan, Uauy and Kain5) have reported elevated total and LDL-cholesterol levels in children from as young as 4 years old(Reference Corvalan, Uauy and Kain5). Recent national data from the USA show that 6·6 % of 12- to 17-year-old adolescents have elevated levels of LDL-cholesterol ( ≥ 3·3 mmol/l) and that 9·6 % of 6- to 17-year-olds are classified as having hypercholesterolaemia (total cholesterol ≥ 5·1 mmol/l)(Reference Ford, Li and Zhao26). An elevated cholesterol level is likely to track from childhood into adulthood; children with high cholesterol levels have a substantially increased risk of hyperlipidaemia as adults(Reference Webber, Srinivasan and Wattigney8). For example, in the Muscatine Study 48·5 % of girls and 68 % of boys and in the Bogalusa Heart Study 50 % of children with elevated total cholesterol in childhood (5–18 years) also had elevated levels ( ≥ 5·17 mmol/l) later in young adulthood (20–30 years)(Reference Webber, Srinivasan and Wattigney8, Reference Lauer and Clarke10).
In line with these observations, nowadays there are growing consensus and emphasis on the need for a life-course approach in the prevention of nutrition-related chronic diseases(18, Reference Uauy and Dangour19, Reference Hayman, Meininger and Daniels27–Reference Daniels and Greer29). In view of the rising incidence of overweight and obesity in children and its consequences for cardiometabolic risk, this approach is becoming increasingly important. Lifestyle and dietary patterns are established at an early age; and healthy diet and lifestyle behaviours are likely to be more easily adopted if introduced in early childhood(Reference Hayman, Meininger and Daniels27, Reference Viikari, Niinikoski and Juonala30).
Evidence on the effects of dietary fat on blood cholesterol in children
Many controlled dietary intervention studies in adults have established that replacing dietary SFA with PUFA reduces LDL-cholesterol(Reference Jakobsen, O'Reilly and Heitmann11) and CHD risk(Reference Jakobsen, O'Reilly and Heitmann11, Reference Mozaffarian, Micha and Wallace13). However, only few studies have investigated the effect of dietary fatty acids on blood cholesterol levels in children. Early indications that diet influences plasma cholesterol the same way in children as in adults came from the Young Finns Study, in which it was observed that plasma cholesterol was positively associated with SFA intake in 12-year-old children(Reference Akerblom, Viikari and Uhari31). The Finnish Special Turku coronary Risk factor Intervention Project for children (STRIP) aimed to reduce SFA intake of healthy infants at age 7 months by dietary counselling of mothers, and demonstrated that lower SFA ( < 10 %) and higher PUFA (about 10 %) intake in the intervention group resulted in a significant reduction of total and LDL-cholesterol levels(Reference Lapinleimu, Salo and Routi17, Reference Simell, Niinikoski and Ronnemaa32). These improvements were maintained up to at least 14 years of age(Reference Niinikoski, Lagstrom and Jokinen33). The Dietary Intervention Study in Children (DISC), conducted in children with elevated LDL-cholesterol levels, showed that a diet low in total fat (28 %E), SFA ( < 8 %E) and cholesterol, and high in PUFA (9 %E) significantly lowered LDL-cholesterol after 3 years of follow-up(Reference Lauer, Obarzanek and Hunsberger16). A recent cross-sectional analysis in 12-month-old Swedish infants showed that a diet higher in PUFA was associated with lower total and LDL-cholesterol levels in girls, although not significantly in boys, independent of the total amount of fat consumed(Reference Ohlund, Hornell and Lind34). Overall, the available evidence in children from intervention and longitudinal studies indicates that consuming lower amounts of SFA and high PUFA in childhood has the potential to decrease serum cholesterol both in children with normal lipid levels(Reference Simell, Niinikoski and Ronnemaa32, Reference Vartiainen, Puska and Pietinen35, Reference Niinikoski, Lagstrom and Jokinen36) and to a larger extent in hypercholesterolaemic children(15, Reference Lauer, Obarzanek and Hunsberger16, Reference Polonsky, Bellet and Sprecher37, Reference Shannon, Tershakovec and Martel38). An improved blood lipid profile in childhood can be hypothesised to slow the development of atherosclerosis and decrease CHD risk in later life(Reference McGill, McMahan and Malcom4, Reference Berenson, Srinivasan and Nicklas7, Reference Daniels and Greer29). Controlled long-term intervention studies are needed to determine the extent to which improvement of fat and fatty acid intake in childhood translates into less CHD in adulthood. However, evidence from one longitudinal cohort(Reference Morrison, Friedman and Gray-McGuire39) suggests that paediatric metabolic syndrome, defined as three or more abnormal CVD risk factors during childhood, is predictive for adult CVD events.
Methodological considerations
To our knowledge, the present paper is the first systematic review providing an overview of fatty acid intakes in children and adolescents in different populations around the world. Most data come from Europe, North America, Australia and New Zealand while data from Asia, Africa and South America are scarce. According to predefined quality criteria, the intake data were scored as ‘high’ and ‘medium’ for all included countries. Additionally, national dietary surveys, which are the preferred type of research to estimate the distribution of nutrient intake in populations, were available for the majority (twenty-two out of thirty) of countries and for the other countries (eight), representative data from observational studies were used. We therefore do not anticipate substantial bias in the presented data due to differences in methods to assess fatty acid intake.
Although any method to assess food and nutrient intake has inherent weaknesses(Reference Gibson40), data for the majority (twenty-four out of thirty) countries in the present review were based on higher-quality assessments methods, including 3–7 d weighed food records, multiple 24 h dietary recalls and 24 h dietary recalls combined with FFQ. Hence, in these twenty-four countries the quality of the reported fat and fatty acid intake data is likely to be higher than in the six countries where intake was estimated with single FFQ or 24 h recalls (Bulgaria, Canada, Mexico, New Zealand, Poland and Portugal). Moreover, nutrients such as n-3 fatty acids have large variations in intake and any dietary assessment method used(Reference Massart, Vandeginste and Buydens23) may not be suitable for measuring thier intake unless specially designed. Also, reported TFA intake may not be reliable, as for many countries there are no good data on their main dietary sources and contents in foods.
We could not evaluate the quality of food composition databases used in the surveys and studies due to limited information provided for several countries. However, for the majority of countries with established national dietary surveys it should be assumed that fatty acid content of foods in the applied food composition databases was reasonably accurate.
Overall, the possibility that differences in reported intake could be partly due to differences in the data collection methods cannot be entirely excluded. However, for most countries, higher SFA intakes and lower PUFA intakes than recommended are reported, without apparent differences due to quality of the underlying studies. Nevertheless, it is likely that a major part of the variation in reported intakes between populations reflects true underlying differences in intakes and type of fats and oils consumed.
To estimate the percentage of children meeting the recommendations for SFA and PUFA intakes, we assumed a normal distribution of intakes in the populations. This assumption may not hold for developing countries such as India(Reference Ghafoorunissa41) where the data were derived from a study with a small sample size and where the variability in fat intake can be large depending on the region and income level, which may result in a skewed or bimodal distribution of data. However, data on fats and fatty acids in children from Western countries are usually normally distributed, even with differences in region or socio-economic status(Reference Gregory, Lowe and Bates42). Thus, our estimations of the percentage children meeting recommendations are probably more reliable for these Western countries than for other countries.
Because of the methodological limitations, interpretation of numeric results within individual countries and comparisons between countries should be done with care. However, the available data strongly suggest that intakes of SFA and PUFA in children and adolescent are generally not optimal, and should be improved in many parts of the world.
Suggestions for future research
Data on dietary fatty acid intake in children and adolescents are lacking for many countries worldwide, particularly those in developing regions. Adequate intake data should be collected in these countries, particularly because many are undergoing rapid changes, i.e. towards more affluent lifestyles and diets that have adverse health effects. Data from national dietary surveys with representative population sampling, using a weighed food record or multiple 24 h recall, should be applied to measure current intakes at the population level(Reference Biro, Hulshof and Ovesen20–Reference Willett22). As well as intakes of fat and fatty acids, intakes of other dietary components that affect CVD risk, such as types of carbohydrates and Na intake, need to be assessed in children.
Official quantitative international recommendations on fat and fatty acid intakes for children are needed to help public health organisations and health influencers to develop policies for improving fatty acid intake in this age group. Moreover, future research is needed to establish to what extent improvement of dietary fatty acid intake in childhood translates into lower CHD risk in later life.
In conclusion, the available data consistently indicate that in many parts of the world children and adolescents have SFA intakes that are higher and PUFA intakes that are lower than intake levels recommended by the WHO for the prevention of chronic diseases. Public health initiatives should focus on improving the fatty acid composition of the diet starting early in childhood.
Acknowledgements
Collection of fatty acid intake data in Mexico was supported by Unilever Netherlands B.V. All the authors are employees of Unilever. Unilever markets food products made of vegetable oils, including margarines and dressings. R. K. H. and S. J. M. O. designed the study concept and R. K. H. searched and collected the data. All authors were involved in interpretation of the data and preparation of the manuscript. The authors would like to thank Peter van Bruggen for statistical input, and other Unilever colleagues who helped identify dietary data sources for specific countries.


