


Introduction
Large-scale surveys carried out periodically over several years are required to obtain robust information on population trends from which management strategies can be established (Primack Reference Primack2006). This is especially challenging in the case of rare, shy and widely distributed species such as the Asian Houbara Bustard Chlamydotis macqueenii, a partial migrant of the steppes and deserts of central and western Asia (Collar Reference Collar, Del Hoyo, Elliot and Saragatal1996).
For centuries, Houbara Bustards have been hunted by Arab falconers (Upton Reference Upton1989, Remple and Gross Reference Remple and Gross1993) and this tradition is now one of the pillars of Arab cultural heritage. A decline in numbers of Asian Houbara towards the end of the 20th century raised concerns about the conservation status of this species (Collar Reference Collar1980, Goriup Reference Goriup1997, Tourenq et al. Reference Tourenq, Combreau, Pole, Lawrence, Ageyev, Karpov and Launay2004) and a 2004 review by Birdlife International for the IUCN led to an elevation of the threat status from ‘Low Risk/near threatened’ to ‘Vulnerable’ on the IUCN Red List. The Arabian falconry community has shown great concern about the perceived decline of their traditional quarry and the National Avian Research Center (NARC) of Abu Dhabi, a body now belonging to the recently formed International Fund for Houbara Conservation, was created in 1989 with the mission of reconciling the tradition of falconry with sustainable use of resources.
In spring and summer, migrant Asian Houbara are mostly observed north of Turkmenistan in Uzbekistan, Kazakhstan and further east up to the Mongolian and Chinese Gobi. These birds spend the winter south of the Turkmen border, mainly in Pakistan, Iran, Iraq and Arabia (Combreau et al. Reference Combreau, Launay, Al Bowardi and Gubin1999, Reference Combreau, Launay and Lawrence2001, Judas et al. Reference Judas, Combreau, Lawrence, Saleh, Launay and Xingyi2006). Although residents are found in Iran, Pakistan and the Arabian Peninsula, they have been heavily impacted by human pressure and only a few remnant populations remain.
In 1998, NARC established a collaboration with the Kazakh Scientific Centre for Quarantine and Zoonotic Diseases (KSCQZD). KSCQZD surveys vast areas of Kazakhstan to monitor plague levels in rodent populations; this collaboration enables the collection of data on numbers of Houbara each year and throughout the country. Kazakhstan has large areas of suitable habitat and is thought to hold the largest numbers of breeding Asian Houbara (Goriup Reference Goriup1997). Birds breeding in western China and Mongolia also move across this country, making stop-overs in south-western Kazakhstan. Population trends measured in this country are thus undoubtedly a good indicator of the health of the overall migrant Asian Houbara populations. Here we evaluate regional population trends of Houbara throughout their range in Kazakhstan from data collected annually from 2000 through 2009.
Methods
Surveys covered large areas throughout southern Kazakhstan, stretching from the east of Lake Balkash through to the north of the Caspian Sea. KSCQZD operates numerous field stations, 12 of which were chosen according to their location in order to cover the widest possible Houbara range (Tourenq et al. Reference Tourenq, Combreau, Pole, Lawrence, Ageyev, Karpov and Launay2004). Surveys were conducted twice a year for periods of 2–3 weeks starting in the third week of April for spring surveys and in the fourth week of September for autumn surveys. Spring surveys monitor the size of the breeding Houbara population and autumn surveys monitor breeders, young adults and migrants. Surveys consisted of transects driven at low speed (30–40 km h−1) in 4 x 4 vehicles during which all Houbara seen were recorded, together with their distance from the observer, their angle from the transect line, and information relating to behaviour, age, sex, and group size. This method is best suited for surveying vast areas and has been used and validated previously for Houbara Bustards (Launay Reference Launay, Launay and Bailey1999, Seddon and Van Heezik Reference Seddon, Van Heezik, Launay and Bailey1999). Observers were assigned to a transect route in a given area and performed it year after year, thus avoiding inter-observer bias between years.
Due to the nature of the data, some limitations had to be taken into account in designing the analysis. For example, due to logistical constraints, some areas were sampled more than others and some transects were not sampled each year. Until recently, KSCQZD did not use GPS devices but relied on a grid with cells measuring 40 km x 40 km, hereafter termed sectors. In order to control for the above-mentioned bias, survey effort and numbers of birds seen were analysed with respect to these sectors. Of all the sectors visited at least once between 2000 and 2009 (totalling 416 in spring and 410 in autumn), only a subset were surveyed every year. Therefore in order to achieve continuity in the sectors analysed, but without compromising too much on the sample size, we selected for analysis only those sectors which were surveyed at least seven years out of 10 in spring and out of nine in autumn (n = 201 and 194 respectively; Fig. 1).

Figure 1. Location of the sectors surveyed in Kazakhstan. Sectors that were visited in a minimum of seven years (see methods) are represented by filled squares, with colours separating the five regions. Filled and unfilled squares combined represent all sectors in the dataset.
Sectors visited were grouped into relatively distinct geomorphic regions (Table 1, Fig. 1; Tourenq et al. Reference Tourenq, Combreau, Lawrence, Pole, Spalton, Xingyi, Al Baidani and Launay2005). The river Syrdar’ya was considered the natural boundary separating Betpak-Dala and Karakum (north of the river) from Kyzylkum (south of the river). Longitude 72°E was used arbitrarily to separate the Betpak-Dala region from the Balkash region. Survey effort was variable due to differences in the size of each region, with distances driven per survey varying between 2,835 ± 597 SD km and 7,575 ± 1,485 SD km (Table 1).
Table 1. Regions surveyed and survey effort

Data were analysed in two separate ways. First, we examined the total number of birds seen per sector, in a given season and year, divided by the total number of kilometres driven in that sector and in that given season and year. This total included all sightings but excluded chicks. Analyses were run using generalized linear models (GLM) in R (R 2009). Our standard base model evaluated the effects of year, region and the interaction between both variables on the number of birds per sector; the minimum adequate model was sought by sequential removal of non-significant terms using likelihood ratio tests (and a χ2) to compare between nested models. The response variable was not normally distributed or homoscedastic and therefore a negative binomial distribution was used, which fits best to the data (Crawley Reference Crawley2007). However, this was not sufficient to deal accurately with the large number of zero values in the dataset. Due to the very low detection probability of Houbara, no birds were recorded for many sectors in a given year and season. To address this, we used hurdle models, as specified in the "pscl" package (Zeileis et al. Reference Zeileis, Kleiber and Jackman2008). Hurdle models deal with zero-inflation by using two components: one which models non zero values (in our case using a negative binomial GLM), and a binomial component which models zero vs. non-zero values.
In a second set of analyses, we used the distance sampling procedure. This method makes use of the distance and angle at which animals are observed in addition to the sightings of birds (numbers of birds per sighting) and the number of kilometres driven each year, for each region and season. Using the program Distance (Thomas et al. Reference Thomas, Laake, Rexstad, Strindberg, Marques, Buckland, Borchers, Anderson, Burnham, Burt, Hedley, Pollard, Bishop and Marques2009), data are modelled using a detection probability curve to account for the decreasing probability of detection as animals are found further away from the transect line (something the first method of analysis does not model). AIC values were used to choose among competing models, the best of which was used to estimate density (Buckland et al. Reference Buckland, Anderson, Burnham and Laake1993). Best fit was achieved using a negative exponential function. Misleading results can be obtained with this method if too few animals are detected, and to avoid this we pooled data across years and into 3 year-classes (2000–2002, 2003–2005 and 2006–2008/9). We analysed the data with respect to season and to the five regions defined above and in the same sectors as above (i.e. visited in at least seven years). To obtain adequate fit of the detection function, sightings were grouped into 25 m distance intervals for analysis (Buckland et al. Reference Buckland, Anderson, Burnham and Laake1993).
Results
Spring
The change in number of birds seen per kilometre as a function of year (1st method of analysis) differed between regions (interaction year x region: ![]() , P < 0.0001; Figure. 2a–e). Relative densities declined by 93% over 10 years in the north-east Caspian region (
, P < 0.0001; Figure. 2a–e). Relative densities declined by 93% over 10 years in the north-east Caspian region (![]() , P < 0.0001; 25% per year on average), they declined by 54% in Karakum (
, P < 0.0001; 25% per year on average), they declined by 54% in Karakum (![]() , P < 0.001) with a major drop in the last 3 years, and in Kyzylkum they declined by 82% between 2000 and 2001, remaining stable thereafter (
, P < 0.001) with a major drop in the last 3 years, and in Kyzylkum they declined by 82% between 2000 and 2001, remaining stable thereafter (![]() , P = 0.9). In Balkash, the slight decrease in relative densities with year was not significant (
, P = 0.9). In Balkash, the slight decrease in relative densities with year was not significant (![]() , P > 0.5; 2.6% per year on average). In contrast, relative densities increased by 42% in Betpak-Dala (
, P > 0.5; 2.6% per year on average). In contrast, relative densities increased by 42% in Betpak-Dala (![]() , P = 0.1; 4% per year on average).
, P = 0.1; 4% per year on average).

Figure 2. Numbers of birds recorded per km driven during spring surveys as a function of year in each region. Data shown are means ± SE. Lines show model predictions.
Globally, the decline in relative densities varied between 36% and 26%, corresponding to an annual decline of 4.8% (![]() , P = 0.005) and 3.3% (
, P = 0.005) and 3.3% (![]() , P = 0.03) respectively, depending on whether or not the survey in Kyzylkum from year 2000 was included.
, P = 0.03) respectively, depending on whether or not the survey in Kyzylkum from year 2000 was included.
Partly owing to the regional variation in decrease in densities with years, Balkash, Betpak-Dala and Kyzylkum held densities several fold higher than those found in the other two regions in recent years (respectively 0.0064 ± 0.0008 and 0.0008 ± 0.0003 birds km−1 driven in 2008–9).
Autumn
Estimated densities within regions were highly variable between years and trends with year and within regions were less obvious than in spring, as evidenced by the weak effect of the interaction year x region on the number of birds seen per km (![]() , P = 0.05). Regional effects alone were highly significant (
, P = 0.05). Regional effects alone were highly significant (![]() , P < 0.001), with relative densities being more than threefold higher in Betpak-Dala and Kyzylkum than in the other regions (respectively 0.018 ± 0.002, 0.016 ± 0.002 and 0.0054 ± 0.0005). Year effects nearly reaching significance levels were identified in some regions, with an increase in Betpak-Dala (
, P < 0.001), with relative densities being more than threefold higher in Betpak-Dala and Kyzylkum than in the other regions (respectively 0.018 ± 0.002, 0.016 ± 0.002 and 0.0054 ± 0.0005). Year effects nearly reaching significance levels were identified in some regions, with an increase in Betpak-Dala (![]() , P = 0.1) and a decrease in Kyzylkum (
, P = 0.1) and a decrease in Kyzylkum (![]() , P = 0.08) and north-east Caspian (
, P = 0.08) and north-east Caspian (![]() , P = 0.16). But year had no global effect on the relative densities of Houbara in autumn (
, P = 0.16). But year had no global effect on the relative densities of Houbara in autumn (![]() , P = 0.9).
, P = 0.9).
Distance sampling approach
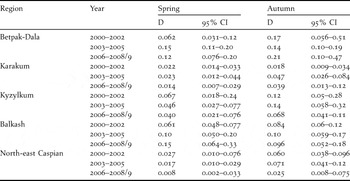
Table 2 shows the density estimates obtained across regions and in the three year-classes in spring and autumn. In spring, densities increased in Betpak-Dala and Balkash but decreased in all other regions, with the strongest decline observed in north-east Caspian. In autumn, densities were generally higher, decreasing in Kyzylkum and north-east Caspian, and stable or increasing elsewhere. As was the case with the first method of analysis above, spring density estimates were highest in Betpak-Dala and Balkash, and lowest in Karakum and north-east Caspian.
Table 2. Densities estimates (D, in birds km−2) obtained by the distance sampling approach.
Discussion
Our analysis shows that the breeding Houbara population has generally been declining over the greater part of Kazakhstan during the past decade although important regional differences exist. A steep decline occurred in three out of five regions, namely north-east Caspian, Kyzylkum and Karakum, which lost 93%, 82% and 54% respectively of their breeding population between 2000 and 2009 (Fig. 2). During the same period, the decline was more ambiguous in the region surrounding Lake Balkash (indeed an increase was clearly apparent in the distance sampling analysis, Table 2), and an increase in relative densities was observed in the Betpak-Dala region of central Kazakhstan. Autumn surveys revealed little decline overall and instead stressed important regional differences in densities, with Betpak-Dala, Kyzylkum and Balkash showing much higher densities than those found elsewhere. This most likely reflects the passage and stop-overs of migrants from further east in these southern areas.
Gubin (Reference Gubin1992) first proposed an estimate of Houbara population densities in Kazakhstan from data collected during extensive aerial surveys in Kyzylkum and Mangystauskaya Oblast (i.e. a section of the north-east Caspian region). Extrapolating to the whole country’s suitable habitats led to an estimated Kazakh Houbara population of c. 30,000–40,000 individuals (Goriup Reference Goriup1997). Additional surveys were carried out by Gubin from 2001 to 2005 but differences in methodology precluded an analysis of the trend or a comparison of the population size between earlier surveys in the 1980s and more recent ones (Gubin Reference Gubin2008). The distance analysis carried out here yields a total of approximately 49,000 birds in spring (of which 87% are found in Bedpak-Dala and Balkash) in years 2006–2009, making the assumption that the area of breeding habitat is roughly equivalent to the number of 40 km x 40 km sectors visited by KSCQZD (unfilled symbols in Fig. 1). This figure, as well as the one above, should be treated with great caution, notably owing to the uncertainty characterising the total area of occupied habitat.
Four years after the inception of the NARC-KSCQZD countrywide Houbara population assessment in Kazakhstan, an initial analysis suggested a pronounced decline in Kazakh populations (Tourenq et al. Reference Tourenq, Combreau, Pole, Lawrence, Ageyev, Karpov and Launay2004, Reference Tourenq, Combreau, Lawrence, Pole, Spalton, Xingyi, Al Baidani and Launay2005). Results presented here are new for years 2003 onwards and do not strictly agree with earlier estimates in the years before that. Concerning the period post-2002, it certainly appears that trends have changed in Betpak-Dala where an increase in numbers is currently occurring, as well as in Balkash and Kyzylkum where population numbers appear to have stabilised. Prior to 2003, a decrease is apparent in Betpak-Dala, Kyzylkum and north-east Caspian but not elsewhere. One reason for the difference between these results and previous estimates is the exclusion of autumn 1998 and spring/autumn 1999 from the current review. Higher numbers of birds were recorded in those years, both in spring and autumn, but they had to be removed because both sectors and survey effort were not recorded with enough accuracy. Additionally, we excluded sectors that had been irregularly visited (see methods) and the area surveyed has changed somewhat, new areas having been included (e.g. north of Lake Balkash). Hence we increased the robustness of the data, but also made the results less easily comparable to prior work.
Independently of regions, Houbara densities were highly variable between years, particularly in autumn. This is probably due partly to the movements of birds, which make autumn surveys more difficult to interpret. For example, weather conditions could affect the timing of migration, either of birds breeding in Kazakhstan, or of birds coming from further east and making stop-overs in southwestern Kazakhstan (Berthold Reference Berthold1993). This variability also probably results from differences in breeding success between years of both Kazakh breeders and Chinese-Mongolian migrants.
We found that densities were several times higher in the Betpak-Dala and Balkash regions of central and eastern Kazakhstan, a pattern that is only strengthened by the drop in numbers that has occurred over the years in the west (Karakum, Kyzylkum and north-east Caspian). West Kazakh birds mostly winter in eastern Iraq and western Iran (NARC unpubl. data). Cases of poaching on Houbara in Iraq and Iran are numerous: five of 18 birds tagged in 2005–2006 were lost to hunters or poachers 1–3 years post-release, two of which were actually returned to NARC by poachers who trapped the birds alive while wintering in Iraq. On the north-east Caspian breeding grounds, poaching has also occurred, but it is likely in addition that the fast-paced development of human activity in that region (related to the growth of the petroleum industry) has dramatically affected the availability of undisturbed habitat. In contrast, vast areas of uninhabited steppe currently exist in Betpak-Dala (Robinson et al. Reference Robinson, Milner-Gulland and Alimaev2003) where Houbara densities are high and not in decline.
Our results suggest that it is a complex undertaking to assign a level of vulnerability for this species as a whole. This paper looks exclusively at the situation of migrant Asian Houbara Bustards breeding in or crossing Kazakhstan in the course of their annual biological cycle. Although this forms the greater part of the Asian Houbara population, it excludes resident birds inhabiting the southern part of the range (Van Heezik and Seddon Reference Van Heezik and Seddon2002) and the shorter distance migrants that breed south of Kyzylkum. Furthermore, Kazakhstan hosts several Houbara populations that are only marginally interconnected. In particular, it is known from our extensive satellite tracking studies (Combreau et al. Reference Combreau, Launay, Al Bowardi and Gubin1999, Judas et al. Reference Judas, Combreau, Lawrence, Saleh, Launay and Xingyi2006, NARC unpubl. data) that the western Kazakh population is clearly separated at all times of its breeding cycle from more eastern populations such as the one in Betpak-Dala and those further east up to the Gobi desert of Mongolia and China. Each population is therefore subject to specific pressure that may result in different population trends. Conserving the species in its full ecological and genetic integrity thus entails that conservation measures are adjusted locally.
Acknowledgments
The authors are grateful to HH Sheikh Mohamed bin Zayed Al Nahyan, Crown Prince of Abu Dhabi and Chairman of the Environment Agency of Abu Dhabi (EAD), HH Sheikh Hamdan bin Zayed Al Nahyan, Deputy Chairman of EAD, HE Mohammed Al Bowardi and HE Majid Al Mansouri, respectively Managing Director and Secretary General of EAD for their support. Our special thanks go to Mr. Mohammed Saleh Al Baidani for his constant help at all levels in the UAE and in Kazakhstan, as well as to all the team from KSCQZD.


