


Introduction
There are three breeding species of crossbills in Scotland: the small-billed Common Crossbill Loxia curvirostra, which eats mainly the seeds of spruce Picea spp. trees, the large-billed Parrot Crossbill L. pytyopsittacus which eats Scots Pine Pinus sylvestris seeds, and the Scottish Crossbill L. scotica which is intermediate in size, and eats the seeds of several conifers (Gibbons et al. Reference Gibbons, Reid and Chapman1993, Cramp and Perrins Reference Cramp and Perrins1994, Marquiss and Rae Reference Marquiss and Rae2002, Summers et al. Reference Summers, Jardine, Marquiss and Rae2002). The Common Crossbill is the most numerous, especially during invasion years, after which some stay to breed before returning to the continent in a subsequent year (Newton Reference Newton2006). The Parrot Crossbill is the least abundant (Gibbons et al. Reference Gibbons, Reid and Chapman1993). There have been sporadic records of this species for over a century (Millais Reference Millais1886, Summers Reference Summers2004), though the larger number of recent breeding records may have resulted from the invasions in the 1980s (Catley and Hursthouse Reference Catley and Hursthouse1985, Summers Reference Summers2002).
The Scottish Crossbill is Britain's only endemic bird species and is a red-listed species of high conservation concern in the UK, although considered ‘Data Deficient’ under IUCN criteria due to a lack of detailed information about its population size and trends (BirdLife International 2004, Eaton et al. Reference Eaton, Gregory, Noble, Robinson, Hughes, Procter, Brown and Gibbons2005). There is also limited knowledge of habitat use. Previously, the population was estimated (indeed little more than guessed) at 320 pairs and 1,500 adults in the 1970s (Nethersole-Thompson Reference Nethersole-Thompson1975: 186), and these estimates have prevailed in subsequent literature (Thom Reference Thom1986, Batten et al. Reference Batten, Bibby, Clement, Elliott and Porter1990). Nethersole-Thompson (Reference Nethersole-Thompson1975) was probably the primary source for the estimates (reported as 300–1,250 pairs) in Birds in Europe (BirdLife International 2004) and subsequently changed to 900–3,900 individuals (www.birdlife.org/datazone).
Attempts to survey the distribution and numbers of Scottish Crossbills have hitherto been hampered by the lack of a method of field identification (Knox Reference Knox1990, Gibbons et al. Reference Gibbons, Reid and Chapman1993). However, recent work has shown that there are distinct call-types amongst crossbills in Scotland associated with birds with different bill sizes, and hence species (Summers et al. Reference Summers, Jardine, Marquiss and Rae2002, Reference Summers, Dawson and Phillips2007). This allowed mapping of the distribution of the different call-types (including the Scottish Crossbill) in Scotland (Summers et al. Reference Summers, Jardine and Dawson2004). It also led to the development of a survey method using lures to attract crossbills for counting and identification based on their calls in response to the lure (Buckland et al. Reference Buckland, Summers, Borchers and Thomas2006).
The aim of this study was to make the first estimate of the number of post-juvenile (i.e. potentially breeding) Scottish Crossbills and other crossbill species in the range of the Scottish Crossbill, and thereby fulfil one of the aims of the UK Biodiversity Action Plan (Anon 1995) for this species and allow IUCN threat classification.
Study area and methods
Sampling protocol
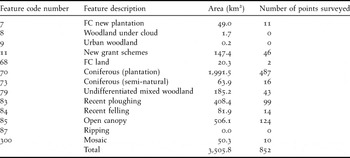
The survey was carried out in conifer woodland in mainland Scotland north of 56°50’N, comprising almost all of the range of the Scottish Crossbill (Summers et al. Reference Summers, Jardine and Dawson2004) (Figure 1). This area excluded a few outlying records south of this line. The sampling was based on 1-km squares of the Ordnance Survey grid. Initially, 1-km squares were selected with coniferous woodland at their centre, based on the 1999 National Inventory of Woodland and Trees (NIWT) (Forestry Commission 1999), using the classes of woodland listed in Table 1. Every fourth of these squares was chosen for survey, providing a systematic series of 889 survey points across the Scottish Crossbill's range (Table 1). When visited, 34 survey points were re-classified as ‘non-conifer’ because there were no conifers within 50 m of the survey point (the centre of the 1-km square). The distance of 50 m was deemed sufficient to account for any possible mapping errors. Using the percentage of each NIWT category that was re-classified as ‘non-conifer’, the area of each category was adjusted to give a total conifer woodland area of 3,506 km2 within the study area. Three survey points were not visited due to access problems. In total, 852 survey points with conifer woodland within 50 m of the centre of the square were visited. The exact position of each survey point was a 1-m2 plot (recorded by GPS – Garmin 60CX or 60C). If this was in dense woodland, the observer moved to the nearest open space (e.g. a woodland ride) to facilitate counting and sexing the birds. Seventy-eight percent of the actual points were within 20 m of the selected point, and 90% within 40 m. Eight observers were involved, though six did 97% of the work. The survey was carried out during January to April 2008.

Figure 1. The study area for the crossbill survey in northern Scotland, with subdivisions. The conifer woods are shown in black.
Table 1. Feature code numbers, descriptions and total areas of the classes of woodland within the study area that contained or potentially contained conifer woodland, as derived from the 1999 National Inventory of Woodland and Trees. The number of survey points visited within each class is also shown.
The efficiency of the lure
Previous work has shown that crossbills respond to playbacks of an excitement call, by flying to the lure and calling back (Summers et al. Reference Summers, Jardine, Marquiss and Rae2002). Not only does this allow one to count the responding crossbills, but also allows one to identify the species from the recorded excitement calls made in response to the playback. Tests of the probability of response to playback as a function of the initial distance from the lure of the focal bird yielded a response curve which indicated that crossbills are lured from an effective area of c. 18 ha (Buckland et al. Reference Buckland, Summers, Borchers and Thomas2006). Models that allowed for effects of date, time of day, size of flock, behaviour and habitat on response were considered, but Akaike's Information Criterion (AIC) indicated that none of these were required. To improve the precision of this response curve, additional data were collected during January to April 2007. It was not possible to obtain response probabilities for the different species of crossbill because recordings of calls, and hence species identification, were not obtained from those birds that did not respond. However, for those that did respond, a Kruskal-Wallis test was used to assess whether the distribution of distances could be assumed to be the same for all three species.
The availability of woodland
In the present survey, it was important to quantify availability of woodland from which crossbills could be drawn as a function of distance from each survey point. This allowed separation of the effects of varying woodland availability and the likelihood of response by birds at different distances (Buckland et al. Reference Buckland, Summers, Borchers and Thomas2006). To model the woodland availability function, additional points were selected at 10 m intervals from each survey point along the eight main compass bearings to a distance of 1 km. Each point was classed as woodland or non-woodland, to give estimates of the proportion of woodland at increasing distances from the survey point. This was carried out using the 2002 NIWT database and GIS software.
Field methods
Days with persistent rain and snow were avoided. Likewise strong winds were avoided when it was difficult to hear and record calling birds against a background of swishing tree tops. Most surveying was carried out when there was no wind or when it was light. Only three survey points were visited when the wind strength was force 5 (Beaufort scale).
The census technique involved playing a crossbill excitement call ‘D’ (Summers et al. Reference Summers, Jardine, Marquiss and Rae2002) from a compact disk player through a horn speaker for at least ten minutes in the four cardinal directions from the survey point (2.5 minutes per direction). Luring was carried out under licence from Scottish Natural Heritage. The sound volume was set low for the first 20–30 seconds so as not to scare any crossbills that were close by, but then increased to 85 decibels (tested at 2 m with a Dawe Sound Level Meter) for the rest of the time. When responding birds arrived at the survey point, the ‘clock was stopped’ and the loudspeaker was turned down in order to tape-record the birds when they called back, which they usually did. Recordings were made to cassette tapes in a Marantz recorder using a Twin Science Telinga microphone linked to a Pro 6 power supply and a 60 cm diameter parabola. Once the calls of the crossbills had been tape-recorded, the luring procedure continued with the loudspeaker at full volume until a full 2.5-minute sampling period for that compass bearing had been completed. Therefore, luring lasted for longer than 10 minutes when crossbills were encountered.
When counting the number of birds that responded to the lure, it was sometimes difficult to distinguish individual flocks. Therefore, the total number of birds was recorded per survey point. Double counting was avoided by noting the number and direction that birds left, and whether the same number reappeared from the same direction. An attempt was made to sex and age the crossbills that responded to the lure. The plumage of females is greenish and males are usually red, though sometimes orange or yellow. Juvenile birds were not unexpected because crossbills breed in winter when conifer seed is abundant. They were distinguished from post-juvenile birds by their streaked plumage (Cramp and Perrins Reference Cramp and Perrins1994). Post-juvenile birds were regarded as potential breeders (Cramp and Perrins Reference Cramp and Perrins1994).
The census method assumed that we counted only those birds within the luring range of the loudspeaker. However, because luring took place over a period of at least 10 minutes, it was possible for a bird to enter this range by chance during the luring period and thereby become part of the lured sample. This would lead to an over-estimation of crossbill numbers. To allow correction for this effect, a ten-minute period before luring began was used to note over-flying birds that were not occupying the woodland area around the survey point. The procedure used to correct for this bias is described below.
The survey was dependent on obtaining good quality recordings of the crossbill flight and excitement calls in order to make sonograms using RAVEN (Cornell University), and thereby identify the call-type and hence crossbill species. However, there were also birds for which no recordings were obtained, so remained unidentified. No attempt was made to identify crossbills in the field. A call-type refers to the combination of flight (numbers 1–4) and excitement calls (letters A–E), most of which are species-specific (Summers et al. Reference Summers, Jardine, Marquiss and Rae2002). In addition, birds that give a specific flight call tend to give a specific excitement call so the calls occur in distinct pairs. The following call-types were associated with small-billed crossbills (and hence Common Crossbills) in the 1990s: 1A, 2B and 4E. Those of intermediate bill size (Scottish Crossbills) were 3C, whilst 2D characterised the large-billed Parrot Crossbills. It was initially assumed that the range of calls recorded during the survey would be the same as those recorded in the late 1990s (Summers et al. Reference Summers, Jardine, Marquiss and Rae2002). However, there were some slight differences, resulting in a review of the call-types used in the analysis of the sonograms (see Appendix 1 in Supplementary materials).
An attempt was made to record flight and excitement calls from as many birds as possible in each flock as they arrived at the survey points. A total of 604 different sonograms was prepared. However, if only a single bird was recorded, the other birds in the flock were assumed to be of the same species. Likewise, if more than one flock arrived at a survey point and birds from only one flock were recorded, then it was assumed that all belonged to the species recorded. At survey points where both Common and Scottish Crossbills were recorded, it was sometimes possible to distinguish single-species flocks. However, when this was not possible, we assumed that 50% of the birds were Common Crossbills, and 50% Scottish Crossbills. If the total number was odd, the additional bird was alternately assigned as Common and Scottish Crossbill.
Analysis methods
Estimating the detection function and density
This followed the procedure outlined in Buckland et al. (Reference Buckland, Summers, Borchers and Thomas2006), using both the data from that study and the additional data collected during 2007. The response (flying to the lure) of birds was tested by playing the lure at different distances to birds that had previously been located. A logistic regression model was used, specifying crossbill response (1 = yes; 0 = no) to the lure as the response variable, and distance from the lure as a covariate. Additional covariates tested for inclusion using AIC were time of day (between 08h00 and 14h00 hours), date (days from January 1), flock size, habitat (factor with two levels; plantation and native pinewood) and behaviour (factor with three levels; perching and feeding, giving excitement calls and singing). The effective radius of detection was estimated from the fitted detection function, allowing the counts of crossbills of each species in the main survey to be converted to estimates of density, and hence of abundance within the survey region, using the equations of Buckland et al. (Reference Buckland, Summers, Borchers and Thomas2006).
Correcting crossbill abundance estimates
To allow us to apportion unidentified birds to species, total abundance of crossbills was first estimated, using all detections, whether identified to species or not. A multiplicative correction for unidentified birds was then obtained as [Nt/(Nc + Ns + Np)] where Nt = total abundance and Nc, Ns and Np = the abundance estimates for Common, Scottish and Parrot Crossbills, respectively. This correction was then applied to each of the species-specific abundance estimates.
The number of over-flying birds was estimated from f = (m/10)n, where f = the number of crossbills that would have flown over in the absence of the lure, m = the mean time that the lure was played per sampling point (minutes) and n = the number of birds recorded as over-flying in the 10 minutes prior to playing the lure. The sum total of crossbills lured to sampling points (c) was then multiplied by the correction factor 1−(f/c).
For Scottish and Common Crossbills, separate corrections to remove juveniles from the abundance estimates were obtained from the proportions of aged birds detected that were juveniles.
Females were not available for luring during incubation and when brooding small young. Incubation lasts 14 days (Cramp and Simmons 1994), and continuous brooding declines over the 7–9 days after hatching (Summers Reference Summers2006). Using clutch and brood survival estimates of 86% and 74% (Summers et al. in press), it is likely that on average, each female was unavailable for 15 days during the 109 days of the survey. Therefore, we increased the total count by a factor of (109 × 2)/(109 × 2 − 15) = 1.0739 to account for unavailable females, assuming that the sex ratio was parity and all breed.
Obtaining confidence intervals
Standard errors and confidence intervals corresponding to each species abundance estimate were obtained by bootstrap resampling (with replacement) of both the trials data on the effective area sampled, and the estimated counts at each survey point in the main survey. This was done as follows. The first resample of trials data was used to re-estimate the probability of response as a function of distance and hence the effective area sampled. This estimate was combined with the count corresponding to the first resample of the main survey data, exactly as for the real data. The second pair of resamples was analysed in the same way and so on, until 999 resamples had been generated and analysed. Confidence intervals were obtained by the percentile method.
Results
Time of survey
The survey was carried out between 6 January and 23 April 2008 (109 days). The mid-point of the survey was 13 February and the middle 90% of survey points were visited between 10 January and 7 April. The timing of the survey therefore corresponded well with when crossbills usually breed in Scotland (Nethersole-Thompson Reference Nethersole-Thompson1975) and was completed largely before Scots Pine cones open and make their seeds are available to all crossbills (Summers and Proctor Reference Summers and Proctor2005).
In January, visits to survey points were made between about one hour after first light and 14h00, when crossbills are active. Crossbills go to night roosts in early afternoon in mid winter (M. Marquiss pers. comm.) so the survey times were restricted. As the winter progressed, the first visits became earlier (earliest 06h15), and last visits later (latest 15h55).
A minimum of ten minutes was allotted to luring crossbills, and on average an extra 6.16 minutes were spent luring when birds were encountered (total of 16.16 minutes). Therefore, the overall average was 13.26 minutes (range 10–45 minutes).
Probability of response to the lure
Addition of 23 trials to the data on response probability reported by Buckland et al. (Reference Buckland, Summers, Borchers and Thomas2006) (based on 152 trials) confirmed that distance from the lure was the only variable that significantly influenced whether crossbills responded to the lure (Figure 2). A χ 2 goodness-of-fit test indicated a good fit of the detection function model to the data: ![]() . The effective radius of detection over which crossbills were lured was 265.3 m, corresponding to an effective area per point of 22.1 ha.
. The effective radius of detection over which crossbills were lured was 265.3 m, corresponding to an effective area per point of 22.1 ha.

Figure 2. A plot of response (1 = birds responded; 0 = no response) against distance of birds from the point for 175 trials. Also shown is the estimated probability of a response, as a function of distance from the point. The mean response is shown by ‘▲’, plotted at the mean distance of responses from the point, for each of the following distance intervals: 0–50 m; 50–100 m; 100–200 m; 200–400 m; 400–750 m. Updated from Buckland et al. (Reference Buckland, Summers, Borchers and Thomas2006).
The median distances over which Scottish, Common and Parrot Crossbills responded to the lure in the trials were 90 m (inter-quartile range 64–122 m, n = 18), 99 m (IQR 50–158 m, n = 50) and 40 m (IQR 25–60 m, n = 6), respectively. There were no significant differences in these medians (Kruskal-Wallis test statistic = 3.9, P = 0.14). Therefore, it was assumed that the different species respond similarly to the lure. These medians were small relative to the estimated effective radius of detection because distances from the lure of birds selected for the trials were smaller than distances of responding birds from the points in the main survey.
Crossbill distribution and numbers
Crossbills were noted at 451 of the 852 survey points (Figure 3) and their distribution was spread across the study area. The only regions where crossbills were infrequent were upper Deeside, Strathspey and the coastal woods. Identifiable sonograms were produced for 387 of the survey points. Common Crossbills were identified at 276 (from 112 10-km squares), Scottish Crossbills at 144 (from 72 10-km squares) and Parrot Crossbills at two. Although 34 survey points had both Common and Scottish Crossbills, there was a significant negative association (Yates’ corrected ![]() , P = 0.018). One survey point had both Scottish and Parrot Crossbills. There were 64 survey points where crossbills were detected but not identified to species because of lack of recorded calls.
, P = 0.018). One survey point had both Scottish and Parrot Crossbills. There were 64 survey points where crossbills were detected but not identified to species because of lack of recorded calls.

Figure 3. The distribution of survey points where crossbills occurred (filled circles) and were not found (open circles).
Scottish Crossbills had a disjunct distribution (Fig. 3). Most occurred in Nairn, Moray and Banff, and extended down into lower Deeside. The other main concentration was in Sutherland. By contrast, the Common Crossbills had a more westerly distribution, from Caithness in the north to Glen Spean in the south. They also occurred in the eastern part of the study area, but not in upper Strathspey and upper Deeside (Fig. 3). Unidentified crossbills occurred throughout the study area.
In total 1,767 crossbills were counted. These comprised 442 Scottish Crossbills, 954 Common Crossbills and two Parrot Crossbills at survey points where only these species occurred. There were 221 birds at survey points where both Scottish and Common Crossbills occurred, five at survey points with mixed Scottish and Parrot Crossbills and 143 birds at survey points where the no identifications were made. By splitting the mixed groups evenly or according to identified flocks, we obtained a total of 442 + 94 = 536 Scottish Crossbills, and 954 + 129 = 1,083 Common Crossbills.
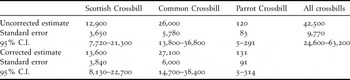
Accounting for the amount of woodland around each survey point (Fig. 4) and the effective area of the lure (Fig. 2), the initial estimates of numbers of Scottish, Common, and Parrot Crossbills (rounded to three significant figures) were 12,900, 26,000 and 120, respectively (Table 2). The estimated number of crossbills of any species, including unidentified birds, was about 42,500. This yields a correction factor of 1.0887 to account for unidentified birds.

Figure 4. Modelled availability of conifer woodland as a function of distance from the point, out to 1 km. The straight line shows availability of woodland if cover was complete out to 1 km, whilst the curved line shows actual availability.
Table 2. Abundance estimates (rounded to three significant figures) for Scottish, Common and Parrot Crossbills. The corrected estimates were obtained by applying multiplicative corrections as follows. Correction based on proportioning unidentified birds to species: 1.0887. Correction to remove juveniles from the estimate: 0.9691 (Scottish Crossbills); 0.9534 (Common Crossbills); no correction (Parrot Crossbills). Correction to remove bias arising from birds over-flying plots: 0.9332. Correction to account for incubating and brooding females: 1.0739. The Parrot Crossbill estimates are given for completeness, and for use in the calculation of proportioning unidentified birds to species, but they should be treated with caution. The lower confidence limit for Parrot Crossbills was the number counted, rather than the calculated value of 0.
Further corrections were then needed to these initial estimates. First, we corrected for the fact that juvenile birds made up 3.09% of the aged sample of Scottish Crossbills, and 4.66% of the aged sample of Common Crossbills, showing that both species made early breeding attempts (Fig. 5). There was no monthly variation (comparing January, February and ‘March plus April’) in the percentage of juveniles of either species (Scottish Crossbills, ![]() P = 0.27; Common Crossbills,
P = 0.27; Common Crossbills, ![]() , P = 0.58), so an overall multiplicative correction factor of (1 − 0.0309 = 0.9691) was used for Scottish Crossbills and (1 − 0.0466 = 0.9534) for Common Crossbills.
, P = 0.58), so an overall multiplicative correction factor of (1 − 0.0309 = 0.9691) was used for Scottish Crossbills and (1 − 0.0466 = 0.9534) for Common Crossbills.

Figure 5. The percentages of the different age/sex classes counted each month at survey points where only Scottish Crossbills and where only Common Crossbills were recorded.
Next, we corrected the estimate for all species by a multiplicative factor of 1.0739 to account for the unavailability of incubating and brooding females for counting. The monthly changes in the percentage of male Scottish Crossbills were not statistically significant (![]() , P = 0.11) and the overall sex ratio was close to parity (47.9% males,
, P = 0.11) and the overall sex ratio was close to parity (47.9% males, ![]() , P = 0.48), indicating that the temporary absence of incubating females had only a small effect. Likewise, the monthly changes in the percentage of Common Crossbill males were not significantly different at the 5% level (
, P = 0.48), indicating that the temporary absence of incubating females had only a small effect. Likewise, the monthly changes in the percentage of Common Crossbill males were not significantly different at the 5% level (![]() , P = 0.077) and the observed difference from parity was almost significant at the 5% level (54.3% males,
, P = 0.077) and the observed difference from parity was almost significant at the 5% level (54.3% males, ![]() , P = 0.052).
, P = 0.052).
Finally, we accounted for crossbills that may, by chance, have been flying across the survey plot when the lure was playing, and which would inflate the count for the sampled area if they came to the lure. This was done by assessing the number flying across the survey plots 10 minutes prior to luring. In total, f = 89 birds were estimated as flying over the survey plot, yielding a multiplicative correction factor of 0.9332.
Using the above corrections, the final estimated numbers of post-juvenile Scottish, Common and Parrot Crossbills were 13,600, 27,100 and 130, respectively (Table 2). For Scottish Crossbills, this will approximate to 6,800 pairs, given that the observed sex ratio was close to parity.
Numbers at survey points
The modal number was two at survey points in most months and numbers over 10 were rare (Fig. 6). The highest number recorded was 50. There was a significant difference among months for Scottish Crossbills (F3,106 = 4.61, P = 0.0045, on log transformed data). Larger numbers occurred at survey points in January compared to the other months, but there was no significant effect of month when the January data were removed (F2,75 = 0.67, P = 0.52). This seasonal effect was also noticeable for Common Crossbills (F3,238 = 5.85, P = 0.007) and the effect was also non-significant for the February to April data (F2,138 = 2.05, P = 0.13).

Figure 6. The percentages of the different number of crossbills counted each month at survey points where only Scottish Crossbills and where only Common Crossbills were recorded. 20 indicates where numbers were equal to and over 20. Sample sizes for Scottish Crossbills in January, February and March plus April were 31, 49 and 28, respectively. For Common Crossbills, these were 56, 98 and 88.
Discussion
There were several possible sources of error in the estimates of numbers. Although the observers positioned themselves so that they could observe the tops of the nearest surrounding trees, it was not always possible to see all the responding birds, because some birds did not approach closely. Therefore, counts of calling birds gave only a minimum estimate. However, a satisfactory count was often made when the birds flew close to the observer.
Incubating and brooding females were unavailable for counting. It was noticeable in March and April that the instances of single males increased for both Scottish and Common Crossbills (Fig. 5), possibly because their mate was on the nest. However, when an adjustment was made to account for unavailable females, it made only a small difference to the total estimates of abundance (Table 2).
It was assumed that all birds in a flock were of the same species as those individuals that were identified from tape-recordings. Likewise, if more than one flock was lured and individuals from only one flock were recorded, then all birds were classed as being the same as those from the tape-recorded flock. However, combinations of Common and Scottish Crossbills occurred on 34 occasions, so it is possible that some birds were misclassified in their species allocation in mixed flocks. Fortunately, such mixed flocks were infrequent (8%), so any bias will be small.
This survey is the first time that there has been an assessment of the size of the Scottish Crossbill population based on a sampling design and using objective criteria (calls) to identify the crossbills. Previous attempts to assess either population size or distribution lacked this rigour. The previous figure produced by Nethersole-Thompson (Reference Nethersole-Thompson1975) was based on his specialised knowledge of only part of the range, whilst previous descriptions of the range relied on the observers’ ability to detect small differences in bill size (Knox Reference Knox1990, Gibbons et al. Reference Gibbons, Reid and Chapman1993). In addition, there has been a belief that the main habitat of Scottish Crossbills is semi-natural or old Scots Pine woods (Batten et al. Reference Batten, Bibby, Clement, Elliott and Porter1990, Knox in Gibbons et al. Reference Gibbons, Reid and Chapman1993), and this may have encouraged observers to identify crossbills according to habitat.
Currently, the Scottish Crossbill is in category 1 (global conservation concern) within the Species of European Conservation Concern classification (BirdLife International 2004, www.birdlife.org/datazone). This status rating reflects data deficiency in estimates of population size, which was regarded as being only 300–1,250 pairs (BirdLife International 2004) or 900–3,900 individuals (www.birdlife.org/datazone). The estimate of 13,600 individuals (6,800 pairs) from our study suggest that this status should be revised to category 2 (unfavourable conservation status in Europe due to having a highly localised population concentrated in Europe) and ‘Rare’ (< 10, 000 breeding pairs) (BirdLife International 2004), with a further review when an assessment of population trend can be obtained. A monitoring scheme needs to be put in place in order to determine population trends. Although the situation is not critical for the Scottish Crossbill, this should not lead to complacency over its status.
Scottish Crossbills were found in 72 10-km squares during the survey, compared to 83 10-km squares during ad hoc surveys from 1995 to 2003 (Summers et al. Reference Summers, Jardine and Dawson2004). The latter figure refers to a composite range over several years, so is not directly comparable with the 2008 survey and does not indicate a range contraction. Twenty-six squares were new ones. Some of this change was due to greater survey effort, filling gaps in the distribution, but there were also notable absences; e.g. in Strathspey. It is also likely that there are distribution changes within a composite range, corresponding to changes in the conifer cone crops that the Scottish Crossbill feed on at each season or year (Marquiss and Rae Reference Marquiss and Rae2002). These changes in distribution have yet to be described.
Common Crossbill numbers within the range of the Scottish Crossbill will vary according to breeding success, mortality and movements within Scotland in response to cone cropping by spruces (Reinikainen Reference Reinikainen1937), and also according to irruptions from the continent (Newton Reference Newton1972). Common Crossbills feed on Sitka Spruces in Scotland (Marquiss and Rae Reference Marquiss and Rae1994, 2002) and given that the Sitka Spruces coned well in 2007, it is likely that the breeding success was good, and hence the population size was high during the survey, whilst the large Sitka Spruce crop in 2008 ensured that these birds then remained in Scotland. There was no indication of an irruption during the summer/autumn of 2007, so it is unlikely that the numbers encountered in the survey were influenced by a recent irruption.
Parrot Crossbills were rare in the survey. There were no records away from the previously known sites. Therefore, it is likely that Parrot Crossbills are restricted to the old Scots Pine forests where they have already been located (Marquiss and Rae Reference Marquiss and Rae2002, Summers Reference Summers2002, Summers et al. Reference Summers, Jardine, Marquiss and Rae2002).
Under current climate change models, there is concern that the Scottish Crossbill will disappear from Britain because the climatic conditions within which it currently occurs (its climate envelope) will no longer occur by the late 21st century (Huntley et al. Reference Huntley, Green, Collingham and Willis2007). However, this assumes that the conifers on which Scottish Crossbills rely will also disappear. Commercial forestry will play a key role within this scenario, and it is notable that increased conifer timber productivity is predicted for southwest and northeast Scotland, whilst potential range expansion is expected for Scots Pines within eastern Scotland (Broadmeadow and Ray Reference Broadmeadow and Ray2005). Therefore, the situation for the Scottish Crossbill may not be as bleak as suggested by the climate envelope model (Huntley et al. Reference Huntley, Green, Collingham and Willis2007). Regardless of how forestry policy and planted trees respond, conservationists will need to be able to advise on woodland management to safeguard the future of the Scottish Crossbill. Continued monitoring using the playback method (Buckland et al. Reference Buckland, Summers, Borchers and Thomas2006) will need to be part of this process.
Acknowledgements
The field work was carried out by Katrina Evans, Adrian George, Mark Gurney, Mark Hancock, Anna Macfie, Iain MacLean, Ron Summers and Johanna Willi. The loudspeakers were constructed by Nigel Butcher. Thanks are extended to landowners, factors and game-keepers, who helped with access to sites. The survey was part-financed by Scottish Natural Heritage, and administered by Andrew Douse and Nigel Buxton. SNH also provided a licence to use playback calls. Colin Campbell and Helen Michell of the Conservation Data Management Unit of the RSPB provided GIS support. David Jardine and Jeremy Wilson commented on the draft.


