


Countries differ widely in the extent to which they rely on the government to allocate resources, goods, and services. For example, government consumption in the year 2000 amounted to 34.3% of total consumption in Sweden as compared to 17.6% in the United States (Gwartney and Lawson Reference Gwartney and Lawson2008). Such large differences in government size are hard to reconcile with the standard political economy model of redistribution (Meltzer and Richard Reference Meltzer and Richard1981), where the size of government is determined by the economic interest of the median voter.Footnote 1 However, more recent research in economics and political science has suggested that the size of government is also determined by the dispersion or polarization of political preferences.
For example, polarization can affect political decision making within governments and legislatures. Veto player theory (Tsebelis Reference Tsebelis2002) predicts fewer changes in the budget in countries where the government consists of several parties and the ideological distance between parties is large. Alesina, Baqir, and Easterly (Reference Alesina, Baqir and Easterly1999) show that disagreement about the appropriate use of public spending leads to lower spending if the size of the budget is decided before its composition. Following Alesina and Tabellini (Reference Alesina and Tabellini1990) and Persson and Svensson (Reference Persson and Svensson1989), there are several articles that study the incentives of incumbent governments to limit future governments’ ability to tax and spend. Depending on the specific assumptions, this type of explanation can rationalize both negative (e.g., Svensson Reference Svensson1998) and positive (e.g., Azzimonti n.d.) relationships between polarization and size of government. Furthermore, polarization could lead to conflicts of interest among the poor that affect their ability to form coalitions for increased redistribution (Fernández and Levy Reference Fernández and Levy2008). Polarization might also be more directly related to preferences for redistribution. Similarity of attitudes and opinions has been shown to be positively related to altruism (e.g., Byrne Reference Byrne1961; Newcomb Reference Newcomb1961) and, therefore, potentially also to higher support for redistribution.
So far, empirical work on political polarization and economic outcomes has used indirect measures of political preferences based on income, ethnicity, or religion.Footnote 2 However, if political views do not follow straight from economic self-interest or group identification, polarization in terms of income, ethnicity, or religious beliefs may not fully capture the true level of political polarization.Footnote 3 In this article, we instead derive measures of political polarization based on voters’ self-reported political preferences. We then test whether these measures can explain differences in the size of government across countries.Footnote 4 Although it is unclear from a theoretical perspective whether the net effect of polarization on the size of government is positive or negative, our measures of political polarization based on survey data are strongly negatively related to the level of public spending.
Do these relationships reflect a causal effect of polarization on government size? An alternative explanation is that political polarization is instead affected by the size of government. As a simple test of the direction of causality, we divide the sample according to the level of democratic development. The idea is that voters must have a say in the political process for polarization in the electorate to affect spending decisions. Political polarization may be affected by government policies, but it is not obvious why this should depend on the level of democratic development. We find that the relationship between polarization and size of government is substantially stronger in democratic countries, supporting the view that polarization affects public spending rather than the other way around.
Figure 1 shows the relationship between one of our polarization measures (the standard deviation of responses to a question about government vs. individual responsibility) and government consumption as a fraction of total consumption for countries that are classified as “weak” or “strong” democracies, respectively. The correlation between polarization and size of government is clearly much stronger for strong democracies. Moreover, Figure 1 shows that the relationship is not driven by extreme values in a few countries.
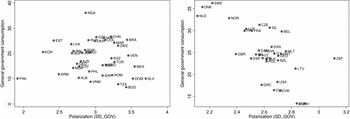
FIGURE 1. General Government Consumption and Polarization (Standard Deviation of Government Responsibility Question) in Weak (left) and Strong (right) Democracies
The pattern in Figure 1 is suggestive, but it does not allow us to conclude that political polarization causes smaller government. There are three specific problems associated with testing the effect of polarization on the size of government that we address. First, our measure of political polarization may be correlated with some other factor that in turn affects size of government. For example, polarization is higher in countries that either are poor, are ethnically fragmented, or have a low level of trust. We show that our measure of political polarization remains a robust predictor of size of government when controlling for these factors, as well as a wide range of other variables.
Second, standard political economy models of redistribution (e.g., Meltzer and Richard Reference Meltzer and Richard1981) predict that political polarization is increasing in income inequality. If government spending affects income inequality, for example, by improving labor market opportunities for the poor, then this would give rise to an endogeneity problem (i.e., that political polarization is itself a function of the size of government). However, our results are robust to controlling for income inequality and using polarization measures that adjust for the distribution of income within countries.
Third, our measure of polarization may reflect uncertainty as to how to answer survey questions rather than genuine disagreement over economic policy. For example, it is conceivable that certain types of public spending (e.g., schooling) reduce the uncertainty respondents feel about how to respond to survey questions, thereby creating a spurious link between government size and political polarization. Our main test for this possibility is to calculate a measure of “ideological coherence”—the extent to which answers to questions of economic policy follow a certain pattern—and then use this measure as a control variable. We also perform additional robustness checks related to our use of survey data, but none of these tests change our results appreciably.
Having established that there exists a strong, robust correlation—and perhaps also a causal relationship—between political polarization and public spending, we devote the last section of the article to the question of why this relationship exists. Surprisingly, we do not find that countries with high levels of polarization among the electorate have more fragmented legislatures or governments in terms of the number and relative size of political parties. We do, however, find that the average level of polarization among the supporters of different political parties is higher in polarized countries. For example, the U.S. Congress is much more concentrated than the Swedish seven-party parliament in terms of the number of political parties, but the level of polarization is larger among the supporters of both the Democratic Party and Republican Party than within the entire Swedish electorate.
As a further test of why polarization is related to government size, we calculate the level of polarization among respondents who support a party in government and among supporters of opposition parties. Although there are several reasons to expect polarization among government supporters to affect size of government, it is not clear that polarization among supporters of the opposition should have a direct effect on size of government. We indeed find that polarization among government supporters is a stronger predictor of size of government than polarization among opposition supporters. We also find that the relationship between political polarization in the electorate and size of government is substantially stronger in democracies with fragmented governments or legislatures. This result is consistent with veto player theory (Tsebelis Reference Tsebelis2002); spending proposals are more likely to be vetoed when there are several parties that disagree about the proper course of action.
Our results should be interpreted with some caution. The association between political polarization and size of government is robust, but much work remains before we can establish whether this correlation reflects a causal effect of polarization on public spending and, if so, which is the main mechanism behind this relationship.
Before proceeding to the empirical analysis, we describe our measures of polarization and the outcome and control variables. Data sources and definitions of variables are provided in Appendix A. All empirical results not provided in the text are available online in a Supplementary Appendix, which is available at http://www.journals.cambridge.org/psr2010005.
DATA
Political Polarization
We base our measures of polarization on responses to multiple-choice questions from the World Values Surveys (WVS) (European Values Study Group and World Values Association 2006). We focus on the 2000 wave for most countries, but data from the 1995 wave are used for some countries so as to increase the sample size. The WVS is based on face-to-face interviews with about 1,000 respondents in 83 different countries, but 9 of these are not included in our analysis.Footnote 5 The included countries and the year when the survey was carried out are listed in Table A1 of Appendix A.
We consider four questions that, broadly speaking, measure various economic aspects of left and right on a 1-to-10 scale.Footnote 6 Table 1 displays the wording of each question. Two things are worth noting about the way the questions are formulated. First, the questions capture preferences for the size of government rather than the focus of public spending (with the question about competition as a possible exception). Second, all but the competition question ask whether the government should be larger or smaller than the status quo in each country. We return to these issues in what follows.
TABLE 1. Economic Policy Questions

The wording of the questions has been slightly abbreviated.
To compare the level of polarization across countries in a systematic way, we use the standard deviation as our main measure of polarization. The standard deviation is perhaps the most common measure of dispersion and has the advantage of being simple and transparent. A property of the standard deviation is that it does not depend on whether answers are clustered in distinct groups. In this sense, it is a measure of “dispersion” as much as “polarization.” To see why this may be important, consider the histogram of responses for the government responsibility (GOV) question in Brazil and Sweden shown in Figure 2. Clearly, by any sensible interpretation of “polarization,” Brazil is more polarized than Sweden with respect to respondents’ views about the proper size for government. Note that in the case of Brazil there are two distinct groups at each end point (the respondents who state “1” and “10,” respectively), whereas responses are spread out more evenly for Sweden. Esteban and Ray (Reference Esteban and Ray1994) developed a polarization measure that takes this into account. We therefore also calculate the level of polarization using Esteban and Ray's measure and a simple measure of bipolarization: the minimum of the proportion of respondents that answer “1” or “10.” These measures are highly correlated with the standard deviation (see Appendix B for a more detailed discussion of the different polarization measures).

FIGURE 2. Histogram of Responses to GOV Question in Brazil and Sweden
The economic policy questions are posed in different languages and contexts. Moreover, the fact that three of the questions relate to the current size of government is potentially problematic. For example, fewer people might prefer an increase in the size of government if the current size of government is large. Consequently, not only mean responses, but also polarization of preferences may depend on the size of government (e.g., larger size of government might generate agreement that government size should be reduced). The set of questions listed in Table 1 is therefore not ideal; it would have been better to use questions about the preferred absolute size of government rather than preferred changes from the status quo. However, as long as there is no censoring of responses and concentration of responses do not directly depend on the current size of government, the standard deviation is unaffected by whether questions refer to preferred changes from the status quo or preferences for the absolute size of government.Footnote 7 Table 2 also shows that the standard deviations calculated from the different economic policy questions are strongly correlated at the country level. The lowest correlation is 0.66 and the highest 0.86. The mean values are correlated to a much lower extent; the correlation ranges from −0.14 to 0.41. This suggests that it is much less of a problem that questions are country specific when focusing on the dispersion of responses rather than mean values.
TABLE 2. Pairwise Correlations of Standard Deviations
What characterizes countries with high or low degrees of political polarization? Table 3 lists the 10 countries with the highest and lowest standard deviations for the question about government responsibility (GOV). Perhaps surprisingly, Pakistan is the country with the lowest level of political polarization. This is not a peculiarity of this particular question. As shown in Table A1 in Appendix A, Pakistan also has a very low standard deviation for the other economic policy questions. However, Pakistan is among the countries with the lowest response rates. In the case of the government responsibility question, 37% of the respondents in Pakistan said that they did not know or gave no answer at all.Footnote 8 The other countries on the list are less surprising, with the Scandinavian countries among the 10 most cohesive and 5 Latin American countries among the most polarized.Footnote 9 Another indication that our measure of polarization captures something essential is that political polarization is relatively stable over time. The correlation between our polarization measures and polarization calculated from the previous wave of the WVS varies between 0.72 and 0.81 for the four questions.Footnote 10
TABLE 3. Countries with Lowest and Highest Levels of Political Polarization

Outcome and Control Variables
We focus on one broad measure of government size: general government consumption as a fraction of total consumption (GOVCONS). This measure has been compiled by Gwartney and Lawson (Reference Gwartney and Lawson2008), based on data from the World Bank and the International Monetary Fund. To reduce measurement error, we consider the average of the years 2003 to 2005. This measure captures the extent to which governments rely on political rather than private choice to allocate resources, but it could also reflect whether governments have the fiscal and legal capacity to collect tax revenue. As we see in the empirical analysis, our results for democratic countries are robust when controlling for gross domestic product (GDP) per capita, indicating that our results are unlikely to be driven by differences in tax-collecting capacity. We also report the main results using a measure of redistribution, transfers, and subsidies as a fraction of GDP (GOVTRANSSUB), which is obtained from the same source as the consumption measure. Naturally, this measure says nothing about the beneficiaries of redistribution. A high share of transfers and subsidies in the economy does not necessarily imply that the government redistributes resources from one group to another (e.g., from the rich to the poor). Keeping this caveat in mind, we nevertheless interpret this as a noisy measure of the level of redistribution.
We use the same basic set of control variables as Persson and Tabellini (Reference Persson and Tabellini2003, sect. 3.2.1) in their government size regressions. We divide the Persson and Tabellini controls into two categories: one set of control variables that are likely to be exogenous with respect to both polarization and government size, and one set that may be endogenous. The exogenous controls are geographic dummy variables and colonial origin. The regional dummies are Africa (AFRICA), South and East Asia (ASIAE), and Latin and South America and the Caribbean (LAAM). The colonial variables indicate British (COL_UKA), Spanish (COL_ESPA), or other colonial origin (COL_OTHA) weighted by years of independence. The variables that may be endogenous are logarithm of GDP per capita in 2000 (LYP), openness to trade in 2000 (TRADE), proportion of population between 15 and 64 (PROP1564) in 2000, proportion of population above 65 in 2000 (PROP65), a dummy variable indicating whether the country has a federal political structure (FEDERAL), and an indicator variable for Organisation for Economic Cooperation and Development (OECD) membership before 1993 with Turkey excluded (OECD). We include a number of additional control variables as robustness checks, but these are described further in connection with the results. The definitions and sources of all variables are listed in Table A2 in Appendix A.
ESTIMATION
In this section, we discuss our empirical strategy for investigating the relationship between polarization and size of government. Let yi denote a measure of government size in country i. To test whether political polarization is related to size of government, we run the regression
where Polarizationi is a measure of polarization in country i and Xi is a vector of control variables measured at the country level. Because polarization may be correlated with the mean value of responses, we control for the mean in all regressions. Higher levels of political polarization are associated with smaller government in case β < 0. There are three main issues associated with the estimation of β. (There are also some other issues related to income inequality and survey data that we address toward the end of the Results section.)
First, Polarizationi may be correlated with other variables that affect the size of government. We use three different specifications of the vector of control variables Xi to test for this possibility. In the “basic” specification, we only include the mean response as a control variable. In the “short” specification, we include the geographic and colonial controls from Persson and Tabellini (Reference Persson and Tabellini2003). In the “long” specification, we also include the potentially endogenous set of control variables (i.e., GDP per capita, openness to trade, federal political structure, OECD membership, and the two demographic variables). Note that by including endogenous variables in the regression, we control for mechanisms through which political polarization may affect size of government.Footnote 11 Comparing the estimate of β in the basic, short, and long specifications gives an indication of the robustness of the relationship between polarization and government size. We also perform further robustness tests by controlling for geographic, demographic, cultural, and political factors.
Second, political polarization may itself be affected by the size of government. Our main way of dealing with this problem is to divide the sample according to the level of democratic development. The idea is that government policy is more likely to be affected by polarization in democratic countries. Although political polarization may, in turn, be affected by government policies, it is not obvious why this should depend on the level of democratic development. A simple test of whether polarization causes smaller government is therefore to see whether the relationship between polarization and size of government is stronger in more democratic countries. We use the Polity IV democracy index (Marshall and Jaggers Reference Marshall and Jaggers2007) and classify the 30 countries with a democracy score (DEMOC) of 9 to 10 as “strong” democracies and the 39 countries with a score of 0 to 8 as “weak” democracies. We choose this particular cutoff in order to get roughly half of the countries in each group. The democracy index is not available for 5 countries, but we classify 3 of these countries as strong democracies, giving us a sample of 33 strong democracies in total.Footnote 12 As a robustness test, we divide the sample according to more inclusive criteria for “strong” democracies.
Third, the specification of regression (1) is problematic from both conceptual and statistical points of view for countries where respondents agree that the government should be kept at a minimum (or maximum). From a conceptual perspective, it is not possible for polarization to vary between countries where all citizens favor minimal government because polarization is then always zero. From a statistical point of view, it is difficult to disentangle the effect of polarization from the effect of changing the mean when responses are close to the end points of the scale.Footnote 13 Fortunately, there is no country in our data with a mean value of responses close to the end points of the scale or where the actual size of government is negligible.Footnote 14 For example, there are only two countries with a mean response below 4 and no country with a mean response above 8 for the GOV question.Footnote 15 We have done robustness checks where we remove the countries with the two highest or two lowest mean values from the data, but because the results remain essentially unchanged, we do not discuss them further.Footnote 16 Another indication that extreme mean values are not a serious problem is that the correlations between mean and standard deviation are low for the economic policy questions. The exception is the question regarding private ownership of business (PRIVATE), where the correlation is 0.44.Footnote 17
RESULTS
We first report the results from our three main specifications of control variables for different levels of democratic development. We then perform robustness tests with respect to additional control variables, income inequality, and issues related to our use of survey data. In the following section, we discuss theoretical mechanisms suggested by previous literature. In the main text of the article, we focus on general government consumption (GOVCONS) as the measure of government size, which is the government size variable available for most countries (74 countries), but we also report the main result for transfers and subsidies (GOVTRANSSUB). Some results that we refer to in the text are not reported in the article, but these are available in the Supplementary Appendix.
The results from regression (1) for the three different specifications (basic, short, and long) tested on the three samples (all countries, weak and strong democracies) are shown in Table 4. Political polarization has a negative and statistically significant relationship with government consumption in the specifications with controls for the mean response and exogenous set of control variables, but the size of the coefficients and significance levels are reduced in the specification with the endogenous set of control variables. However, the results depend entirely on the level of democratic development. When the sample is restricted to strong democracies, the estimated effect of polarization on government consumption is statistically significant and robust to the different sets of control variables, whereas it is close to zero and statistically insignificant for the weak democracies.Footnote 18 The strength of the association between polarization and public spending is substantial in strong democracies. For example, an increase in our polarization measure with respect to the GOV question by one standard deviation predicts a decrease in government consumption as a share of total consumption by 4.0 percentage points. The corresponding estimate varies between 2.0 and 6.1 percentage points for the other questions.
TABLE 4. Political Polarization and Government Consumption

Note: This table reports coefficients and heteroscedasticity robust standard errors for the standard deviation of each question for the three specifications discussed in the text.
*p = .10; **p = .05, ***p = .01.
As expected, the results for strong democracies get somewhat weaker, but are generally still statistically significant—when we use more inclusive definitions of strong democracies. The same also holds if we use the classification of democracies from the Polity IV project, which is based on the Polity score (POLITY). According to this classification, 51 countries are defined as democracies. However, because there are so few countries in the nondemocracy category, it is difficult to make an inference about heterogeneous effects based on this classification.
An alternative explanation for the stronger relationship between polarization and size of government in strong democracies is that polarization is measured with more error in weak democracies, thus exacerbating attenuation bias. To adjust for measurement error, we instrument polarization in weak democracies with polarization from the most recent prior wave of the WVS. The estimates from these regressions are imprecise due to the limited number of observations, but the size of the point estimates does not indicate that the results for weak democracies are due to problems of measurement.Footnote 19
We interpret the stronger effect of polarization in democracies as suggestive evidence that there is a causal effect of polarization on the size of government. However, the possibility that polarization is affected by size of government cannot be ruled out. In particular, a larger size of government may induce respondents to agree that government should not expand, thereby generating a correlation between government size and polarization (see the discussion in the Data section). Because democratic countries on average have larger public sectors, this mechanism could potentially account for the stronger correlation between polarization and size of government in democracies. Although we cannot completely rule out this alternative explanation, there are two reasons why we find it less plausible. First, the results are similar for the question about attitudes toward competition (COMP), which is stated in absolute terms. Second, government size is not systematically related to a desire for smaller government (in terms of the mean responses). For example, people tend to favor a higher level of redistribution (as measured by the EQUALITY question) the larger is the size of government. This does not fit well with the idea that the low level of polarization in countries with large public sectors is caused by a general agreement that the size of government ought to be reduced.
Polarization is also associated with smaller governments when regression (1) is estimated using government transfers and subsidies as the dependent variable instead of government consumption. For strong democracies, political polarization is associated with lower levels of redistribution, whereas there is no relationship between polarization and redistribution in weak democracies. Political polarization is not statistically significant in the short specification for strong democracies, but statistically significant in three out of four cases in the long regression. The reason is that GDP per capita is not controlled for in the short specification. Conditional on the set of exogenous control variables (i.e., the variables in the short specification), richer countries have lower levels of redistribution. As poorer countries are also more polarized on average, not controlling for GDP per capita leads to an omitted variable bias toward zero in the short specification.
The relationship between polarization and size of government changes very little when we replace the standard deviation with the alternative polarization measures discussed in the Data section.Footnote 20
As the effect of polarization on government consumption is only present in strong democracies, we focus on this subsample for the remainder of the article. To provide a more complete description of our results, Table 5 shows the estimated coefficients for all control variables when the sample is restricted to strong democracies.Footnote 21 We now turn to robustness checks with respect to additional control variables, income inequality, and survey data.
TABLE 5. Political Polarization and Government Consumption (Strong Democracies)

Note: This table reports coefficients and heteroscedasticity robust standard errors for the standard deviation of each question for the three specifications discussed in the text.
*p = .10; **p = .05, ***p = .01.
Robustness: Additional Control Variables
Table 6 reports the results when we add additional controls to the long specification. The first set of controls is geographic factors: percent of mountainous terrain (MOUNTAIN), the logarithm of country areaFootnote 22 (AREA), and absolute distance to the equator (LATITUDE). The second set of controls includes additional demographic factors: the logarithm of total population (LOGPOP) and population density (POPDENS). We also include the average level of trust (TRUST), as well as measures of ethnic (ETHFRAC), religious (RELFRAC), and linguistic (LINGFRAC) fractionalization. Finally, we control for a number of political variables that have been found to explain the size of government in previous studies (e.g., Persson and Tabellini Reference Persson and Tabellini2003): whether the country has a presidential regime (PRES) and whether the legislature is elected under a majoritarian rule (MAJ). Note that we restrict the sample to strong democracies and that the degrees of freedom are small in these regressions, implying that standard errors become large. Overall, the relationship between polarization and size of government remains robust when additional control variables are included in the regression. It is also worth noting that none of the additional control variables are consistently statistically significant.
TABLE 6. Political Polarization and Government Consumption: Additional Control Variables (Strong Democracies)

Notes: All regressions include control variables from the long specification. This table reports coefficients and heteroscedasticity robust standard errors for the standard deviation of each question for the three specifications discussed in the text.
*p = .10; **p = .05, ***p = .01.
Robustness: Income Inequality
One concern with the estimates reported previously is that polarization of political preferences could be a direct consequence of income inequality, which in turn might be affected by the size of government.Footnote 23 For example, spending on public schooling for the poor is likely to reduce pretax income inequality. One way to control for this is to include a measure of income inequality in regression (1). As seen in Table 6, including the Gini coefficient (a measure of income inequality) in the long specification does not change the coefficients by much, with the competition (COMP) question as the exception. Note, however, that the Gini coefficient is strongly correlated with political polarization, implying that including the Gini index as a control exacerbates attenuation bias.Footnote 24
Another way to control for income inequality is to create an “income-adjusted” measure of political polarization. For each country and question, we run a regression of the respondents’ answers on the respondents’ income.Footnote 25 We then calculate new polarization measures for each country based on the residuals from these regressions. This gives us polarization measures based on political opinions orthogonal to personal income. The income-adjusted polarization measures are highly correlated with the nonadjusted polarization measures; all correlation coefficients are above 0.99. Not surprisingly, rerunning the regressions of government performance using the income-adjusted standard deviations yields very similar results. The reason for the small differences between the income-adjusted and ordinary polarization measures is the low explanatory power of stated income for political preferences. A potential explanation for this result is that income is measured with error in the WVS.Footnote 26
Robustness: Survey Data
A key problem in using survey data is that questions may not only capture differences in political preferences. In particular, the dimension of political conflict measured by our economic policy questions could be more salient in some countries than in others. If people do not perceive a question as capturing a relevant dimension of politics, then it seems plausible that they give it less thought, or that they are more uncertain about their preferences.Footnote 27 We perform two different tests to check whether political polarization is due to respondents’ uncertainty about their actual preferences.
First, we include the country response rate as a control variable in regression (1). The idea is that in countries where many people are uncertain about their preferences, more people will also state that they “don't know” what they think or not answer the question at all. As shown in Table 7, the estimated effect of polarization is practically unchanged when the response rate (PROPRESP) to each question is included as a control variable in the long specification.
TABLE 7. Political Polarization and Government Consumption: Survey Data Issues (Strong Democracies)

Notes: All regressions include control variables from long specification. This table reports coefficients and heteroscedasticity robust standard errors for the standard deviation of each question for the three specifications discussed in the text.
*p = .10; **p = .05, ***p = .01.
Second, we calculate the country-level correlations between individuals’ responses to the economic policy questions. For each question, we then calculate the country average of the absolute value of the correlations with the other questions. This measure (COHERENCE) captures countries’ “ideological coherence”—the extent to which responses to the questions follow a certain pattern—and we expect it to be lower the more uncertain people are about their political preferences.Footnote 28 Political polarization is negatively correlated with ideological coherence in both weak and strong democracies.Footnote 29 That is, the more polarized opinions are in a country, the lower is the correlation between responses to different questions. Moreover, ideological coherence is positively correlated with public spending.Footnote 30 However, as shown in Table 7, our results for polarization are robust to controlling for ideological coherence.Footnote 31 Ideological coherence has a positive sign in three out of four regressions, but the coefficients are never statistically significant.
The result that ideological coherence is higher in countries with a low level of polarization is reassuring in another sense. Because respondents may interpret questions in the political context of their own country, a potential concern is that political polarization is a consequence of partisan policies. For example, suppose that the government in a certain country redistributes income from group X to group Y. If people in this country think of “redistribution” as redistribution from X to Y, then measured preferences for redistribution may be polarized, even if the preferences are homogenous regarding some other redistribution scheme (say, from the rich to the poor). However, as shown previously, the estimated effect of polarization on government consumption is similar for all four questions, implying that partisan policies must shape opinions on these questions in order to invalidate our argument. The fact that the responses to the economic policy questions are more strongly correlated at the individual level in countries where polarization is low therefore indicates that divisive policies are not a main cause of the measured level of polarization.Footnote 32
A related concern is that people might be uncertain about the trustworthiness of politicians. Such uncertainty could give rise to an unwillingness to funnel resources to the public sector and, in case people have different beliefs about how trustworthy politicians are, polarization in stated preferences for the size of the public sector. To test this possibility, we include the average response to the WVS question regarding the confidence in parliament (CONFIDENCE) as an additional control variable in regression (1). We also use the level of corruption (CORRUPTION) within the political system as a proxy for the trustworthiness of politicians. As shown in Table 7, the results change very little from either of these tests.
A final concern with the use of survey data is that people might not want to deviate too much from the opinions of others. A respondent who wants to minimize the maximum deviation from other respondents will answer 5 or 6 provided that he or she does not know the responses of others. If so, responses would be centered around 5.5 in countries where people are concerned about conforming to others. Hence, we include the absolute deviation from 5.5 (CONSENSUS) as a control variable in regression (1) to serve as a rough control for “false consensus.” There is an additional reason to include CONSENSUS as a control variable. Mean values need not perfectly reflect the true mean of preferences if responses are centered at either end of the scale (e.g., 1 or 10 on a 1-to-10 scale). For example, consider two countries with normally distributed underlying distributions of preferences with the same mean. If the mean is above 5.5, the country with the highest standard deviation of the underlying distribution will have a lower observable mean because a larger share of respondents has their answers censored at 10. Hence, the measured standard deviation might be informative about the true mean of preferences, even if we control for the measured mean. Including the absolute deviation from 5.5 as an additional control variable is a rough way of controlling for this confounding factor. As it turns out, our results remain almost exactly the same when CONSENSUS is included as a control variable in the main specifications. Another indication that censoring is quantitatively unimportant is that there is no systematic relationship between the mean values (in terms of left or right) and government size in the basic specification of regression (1) reported in Table 5.
WHY IS POLARIZATION RELATED TO THE SIZE OF GOVERNMENT?
So far, we have shown that polarization in the electorate is strongly correlated with size of government in democratic countries. We also presented some tentative evidence that the relationship is causal. In the remainder of the article, we try to answer the question as to why polarization among voters is related to the level of public spending. Most of the theoretical mechanisms mentioned at the beginning of this article imply that polarization in the electorate translates into polarization in the legislature or government. We therefore first investigate the overall question of whether polarization in the electorate is related to polarization in the legislature/government and then proceed to discuss specific theories. There are also theoretical reasons for why polarization in the electorate could have a direct effect on public spending. We discuss these theories toward the end of the section.
Polarization in the Legislature and Government
A previous empirical literature measured polarization or fractionalization in the legislature and government based on the size and number of political parties. For example, Bawn and Rosenbluth (Reference Bawn and Rosenbluth2006) and Perotti and Kontopoulos (Reference Perotti and Kontopoulos2002) showed that a larger number of parties in government is associated with higher levels of public spending. In a similar spirit, we use the data about parties in the legislature and in government, as well as a classification of the ideology of parties from the Database of Political Institutions (Beck et al., Reference Beck, Clarke, Groff, Keefer and Walsh2001). We focus on five different measures: an index of government fractionalization (HERFGOV), an index of fractionalization in the legislature (HERFLEG), the number of political parties in government (NGOV), the number of political parties in the legislature (NLEG), and an index of the political polarization of parties in the legislature (LEGPOL). The first two measures are Herfindahl indexes calculated as the sum of the squared seat shares of all parties in the government/legislature and is thus higher the more concentrated is the government or legislature to a few large parties.Footnote 33 The number of parties in the legislature (NLEG) and government (NGOV) are simply the raw sums of the number of parties. The index of political polarization of parties in the legislature (LEGPOL) is based on an assessment of the ideology of each political party. The polarization index measures the maximum political distance between the ideology of the executive's political party (Left, Center, or Right) and the ideologies of the three largest government parties and the largest opposition party.
Perhaps surprisingly, these five measures of polarization in legislature/government are not systematically related to our polarization measures based on the stated opinions of survey respondents. The Herfindahl index for the legislature (HERFLEG) is positively related to polarization in the electorate (i.e., the party structure is more concentrated in polarized countries), but the correlation is only significant for the government responsibility question (GOV). In contrast, the number of parties in the legislature is positively correlated with polarization based on three of the four questions, but the relationship is only significant for the question about private versus government ownership (PRIVATE). The measures based on the number of parties in the government (HERFGOV and NGOV) are positively related with polarization for some questions and negatively for others, but none of the correlations are statistically significant. The polarization index based on party ideologies (LEGPOL) is negatively related to polarization for all four questions, but none of the correlations are statistically significant.
These findings suggest that polarization in the electorate does not affect public spending through a direct effect on the level of polarization in the legislature or government. However, the number of political parties is a crude measure of polarization because it does not say anything about the political positions of different parties. LEGPOL is based on a classification of party ideology, but this classification is coarse (Left, Center, Right) and primarily based on the names of political parties. Moreover, the formation of political parties depends on many other factors than voters’ political preferences. Examples include electoral rules (e.g., Duverger Reference Duverger1954; Riker Reference Riker1982), sociological factors (e.g., Lipset and Rokkan Reference Lipset and Rokkan1967), and the ability of social and political groups to overcome collective action problems inherent in party formation (Olson Reference Olson1965).
As an alternative way to measure polarization in the government and legislature, we use information about party sympathies in the WVS to derive measures of the political opinions among the supporters of different parties.Footnote 34 Polarization among supporters of political parties can be informative about polarization in the legislature/government both because the opinions of the party elite are related to the opinions of the party's supporters and because the party elite may act based on the preferences of their voters (irrespective of their own preferences).
We first calculate the standard deviation of responses for supporters of different political parties in the legislature in each country. Interestingly, the average level of political polarization among the supporters of parties in the legislature is closely correlated with our measures of polarization in the whole electorate.Footnote 35 For example, the level of polarization among Republican Party supporters in the United States in terms of our economic policy questions is higher than the level of polarization in the entire Swedish electorate. However, polarization of political parties (as measured by the Herfindahl index) is substantially lower in the U.S. Congress than in the Swedish seven-party parliament. This suggests that whether polarization in the electorate leads to a polarized party structure depends, among other things, on whether parties are formed based on differences in opinion regarding economic policy or according to views along other dimensions of political cleavage.Footnote 36
We also calculate the level of polarization among respondents who support a party in government, as well as polarization among supporters of parties in opposition. This gives us two polarization measures for each country, one for the government and one for the opposition. If polarization in the electorate is related to government size through polarization in the government or legislature, polarization among supporters of the government should arguably have a stronger effect than polarization among supporters of the opposition. Table 8 shows that polarization among the supporters of the government is a more robust predictor of government consumption than polarization among the supporters of the opposition. The estimated effect of polarization among opposition supporters is close to zero or even positive when we include both polarization measures in the same regression.Footnote 37
TABLE 8. Political Polarization and Government Size: Test of Theoretical Mechanisms (Strong Democracies)

Notes: All regressions include control variables from the long specification. The table reports coefficients and heteroscedasticity robust standard errors for the standard deviation of each question for the three specifications discussed in the text.
*p = .10; **p = .05, ***p = .01.
Taken together, these results indicate that polarization among voters does not affect the level of spending by influencing the number and relative sizes of political parties. We do find, however, that polarization among supporters of the government is more strongly associated with public spending than polarization among opposition supporters. With these results in mind, we now continue to discuss a number of specific theoretical mechanisms that can potentially explain how polarization affects spending.
Veto Players. According to Tsebelis’ (Reference Tsebelis2002) veto player theory, political decisions are more likely to be vetoed by political parties if there are many parties in government and if the ideological distance between parties is large. This suggests that polarization leads to fewer changes in government spending, but the theory is ambiguous with respect to the level of government spending.
As we showed previously, political polarization in the electorate is not related to measures of polarization in the government or legislature based on the number of political parties. However, as pointed out by, for example, Tsebelis (Reference Tsebelis1999), the importance of veto players depends both on the number of veto players and on the ideological distance between them. This suggests that we should expect an interaction effect between political polarization and the number of veto players. To test for this, we include an interaction term between polarization and HERFGOV and HERLEG in regression (1). As we show in Table 8, the relationship between polarization and size of government is stronger for countries with fragmented governments and legislatures. The interaction effects are not statistically significant for all four questions, but this is partly due to few degrees of freedom in the long specification.Footnote 38 In addition, we interact polarization with the number of parties in the legislature and government (NLEG and NGOV). Political polarization is more strongly related to government size in countries with many parties in government and the legislature, but the difference is generally not statistically significant.Footnote 39
Although the interaction effects are imprecisely estimated due to few observations, the results suggest that political polarization in the electorate is a stronger predictor of public spending in countries with fragmented legislatures and governments.
Strategic Incumbents. Following the seminal work by and Alesina and Tabellini (Reference Alesina and Tabellini1990) and Persson and Svensson (Reference Persson and Svensson1989), there is a large literature that focuses on the dynamic strategic incentives of incumbent governments. One of the main ideas in this literature is that incumbents who are uncertain whether they will be reelected have an incentive to behave strategically by implementing policies that restrict the choice set of future governments. The more the preferences of the incumbent government depart from the preferences of potential future governments, the more the incumbent will try to restrict future governments’ room to maneuver. For example, Persson and Svensson consider a model in which political parties differ in their preferred size of government and show that incumbents will act strategically by incurring debt in order to affect the cost of public spending in future periods. As pointed out by Persson and Svensson, another state variable that incumbents might use to influence future governments is a “public capital stock” that may be required for the production of public goods. This implies that polarization of preferences over the size of government may be systematically related to the actual size of government. The net effect of polarization on size of government may be either positive or negative, depending on whether it is easier to build up or destroy the stock of public capital. Azzimonti (n.d.), Glazer (Reference Glazer1989), and Svensson (Reference Svensson1998) develop models along similar lines, although size of government is increasing in polarization in Azzimonti (n.d.) and Glazer (Reference Glazer1989), whereas it is decreasing in Svensson (Reference Svensson1998).
The dynamic political economy models rely on electoral uncertainty: polarization only matters in countries where reelection probabilities are sufficiently low. To test for this, we include an interaction term between polarization and the government's share of the total number of seats in the legislature (GOVSEATS). The idea is that the reelection probability is increasing in the government's vote share. As shown in Table 8, the interaction term is negative, indicating that the effect of polarization on size of government is larger when the government's reelection probability is high.Footnote 40 Svensson (Reference Svensson1998) models a more specific mechanism; incumbents restrict future governments’ opportunity to raise funds by implementing an inefficient legal system. Although polarization is the ultimate cause of small government in his model, an inefficient legal system is the proximate cause. We test this aspect of Svensson's model by including a measure of property rights (PRIGHTS) into regression (1). As reported in Table 8, the estimated effect of polarization is not particularly sensitive to controlling for property rights, thus not supporting this particular model of strategic incumbent behavior either.
Two-stage Voting on the Budget. Alesina, Baqir, and Easterly (Reference Alesina, Baqir and Easterly1999) develop a model of two-stage voting where the size of the budget is decided before its composition. Agents first vote on the amount to spend on a public good, and then they vote on the type of public good to provide. As voters in the first stage anticipate the outcome of the second stage, support for spending on the public good is decreasing in the dispersion of preferences over its type. This mechanism relies on a two-stage budget process and is therefore most plausible as a model of voting in legislatures that vote on the budget in two stages.
The main prediction of the model is that disagreement about how to spend public resources leads to preferences for lower levels of spending. Unfortunately, there are no questions in the WVS that directly capture preferences over the type of spending. Although our economic policy questions may partly reflect preferences for the focus of spending (e.g., spending on social relief programs instead of military equipment), they arguably capture preferences for the overall size of government better.Footnote 41 To distinguish between these two types of preferences, we therefore use a principal factor analysis. The underlying idea is that the responses to the four questions depend both on a factor common to all questions and one idiosyncratic term for each question. We interpret the common factor as reflecting a general preference for increasing or decreasing the size of government, whereas the idiosyncratic terms reflect preferences for a specific type of government intervention. This interpretation is supported by the factor loadings. The common factor has a positive impact on the private ownership (PRIVATE), government responsibility (GOV), and competition (COMP) questions, but a negative loading for the income inequality question (EQUALITY), which has a “reversed” scale. We calculate new polarization measures based on the common factor and the residuals for each question from the factor analysis. As it turns out, the new polarization measure based on the common factor is strongly positively correlated with each polarization measure based on the idiosyncratic factors. Both types of polarization measures are negatively related to government consumption, indicating that polarization over both size of government and composition of public goods matters for size of government.Footnote 42 The polarization measures based on the question residuals appear to be somewhat more robust as predictors of public spending when both types of measures are added jointly to regression (1), which gives some support for this particular mechanism. However, due to the high correlation between these measures and the limited number of degrees of freedom, we are reluctant to put much emphasis on this result.Footnote 43 In addition, we have not taken into account that not all countries use a two-stage voting process and that our measures of polarization are based on the preferences of voters, not on those of members of the legislature (which would be more suitable for testing this mechanism).
Coalition Formation. Fernández and Levy (Reference Fernández and Levy2008) develop a model that explicitly shows how polarization in the electorate may affect the formation of political parties and redistribution. In their model, parties are endogenous and preference diversity among the poor affects their ability to extract resources from the rich. As taste diversity increases from a low level, redistribution becomes increasingly tilted toward special interest groups and general redistribution to the poor goes down. However, at a certain threshold, all special interest coalitions break down and general redistribution to the poor increases. Fernández and Levy's model thus predicts a U-shaped relationship between preference heterogeneity and general redistribution.
A distinguishing feature of this model is that the level of redistribution is determined by polarization among the poor. As a rough test of this model, we therefore calculate two measures of polarization for each country, one based on respondents who reported a below-median or median income and another for respondents with an income above the median. As is shown in Table 8, the results remain qualitatively similar irrespective of which measure is used, thus not supporting the mechanism suggested by Fernández and Levy (Reference Fernández and Levy2008).
Voter Preferences and Turnout
We now turn to a discussion of some theoretical mechanisms that can explain how polarization among voters can affect spending without necessarily implying polarization in the legislature or government.
In Meltzer and Richard's (Reference Meltzer and Richard1981) canonical model of redistribution, the size of government is determined by the income of the median voter. Two minor modifications of the model, however, directly imply that dispersion of voter preferences may be related to the size of government. We discuss each case in turn.
Voter Turnout. The first modification of Meltzer and Richard's (Reference Meltzer and Richard1981) model is to relax the implicit assumption that all citizens vote in elections. Empirical research indicates that the income of the median voter tends to be above the median income in the population (Bassett, Burkett, and Putterman Reference Bassett, Burkett and Putterman1999). If people with a preference for a larger government are less likely to vote, then the median voter will prefer a smaller government than the median opinion in the population. Moreover, the difference between the median voter and the median in the population will often be larger the higher is the variance of the distribution of preferences. To see this, note that there are typically fewer voters in-between two points close to the median (e.g., two different tax rates) the more dispersed are political preferences. Footnote 44
If voter turnout is the mechanism by which polarization affects size of government, then it would imply two other phenomena. First, we should expect the median respondent in polarized countries to desire an increase in spending (because the decisive voter prefers a lower level of spending than the median opinion in the population). Second, the effect of polarization should depend on the level of voter turnout.
Because the questions do not clearly distinguish preferences over the size of the budget from preferences about the type of spending, we use a principal factor analysis. We follow the same procedure as in the test of Alesina, Baqir, and Easterly's (Reference Alesina, Baqir and Easterly1999) model, but exclude the competition question (COMP) from the analysis because that question does not refer to the status quo. Hence, the common factor reflects the preferred change from the status quo size of government. The correlation between the median and standard deviation of the common factor for strong democracies is positive (0.27), indicating that the median voter in polarized countries indeed desires an increase in public spending, although the correlation is modest and not statistically significant. Yet, if polarization affects government size through the nonrepresentativeness of the decisive voter, then we should also expect the estimated effect of polarization in the common factor to be sensitive to the inclusion of the median as a control variable. This is not the case, which casts doubt on the importance of the voter turnout mechanism. Furthermore, we find no evidence in favor of the voter turnout mechanism when we include an interaction term between polarization and voter turnout in parliamentary elections (TURNOUT) in regression (1) (Table 8).
Altruism. The second modification of Meltzer and Richard's (Reference Meltzer and Richard1981) model is that voters may not be completely selfish. Previous research has shown that attitudinal similarity is a strong predictor of altruism, attraction, and friendship (e.g., Batson et al. Reference Batson, Duncan, Ackerman, Buckley and Birch1981; Byrne Reference Byrne1961, Reference Byrne1971; Chen and Kenrick Reference Chen and Kenrick2002; Feren, Carroll, and Olian Reference Feren, Carroll and Olian1988; McGrath Reference McGrath1984; Newcomb Reference Newcomb1961; Suedfeld, Bochner, and Wnek Reference Suedfeld, Bochner and Wnek1972), suggesting that political polarization may be related to voter altruism.Footnote 45 Depending on the exact shape of the income distribution, a general decrease in altruism could in theory lead to either more or less redistribution. In practice, however, the median voter typically does not gain from redistribution. This implies that lower levels of altruism reduce redistribution and provision of public goods (Bassett, Burkett, and Putterman Reference Bassett, Burkett and Putterman1999).
In contrast to the other theoretical mechanisms, an effect of polarization on size of government via altruism could arise due to polarization about any type of attitude question that respondents consider salient. As a test of this mechanism, we therefore compare the results for polarization in economic policy with the results for polarization using other types of questions. We use five questions that have been deemed particularly important to explain cultural differences in value orientation across time and cultures (Inglehart and Baker Reference Inglehart and Baker2000).Footnote 46 The five questions are questions about the importance of god (GOD), strength of national pride (PRIDE), respect for authorities (AUTHORITY), and two questions about whether abortion (ABORT) and homosexuality (HOMO) are justifiable. Naturally, the validity of this test hinges on the assumption that attitudinal similarity in terms of economic-political values is not more important for altruism than attitudinal similarity in other domains.
The estimated effects of polarization (in economic policy) remain largely unchanged when the standard deviations and means of the five questions about value orientation are included in the long specification. Polarization in terms of respect for authorities and attitudes toward homosexuality is associated with larger government, whereas polarization in the other three questions is negatively related to size of government, but the coefficients are most often not statistically significant. It is noteworthy that polarization in all five questions is negatively correlated with polarization in three of the four economic policy questions. For example, recall that Sweden was one of the most cohesive countries with respect to the government responsibility question, whereas Brazil was one of the most polarized. The opposite holds for the question about respect for authorities: Sweden is among the 10 most polarized and Brazil among the 20 most cohesive.
Taken together, these results do not lend much support to the idea that polarization affects public spending through voter altruism. The results also suggest that polarization is not one dimensional, but highly domain specific.
Theoretical Mechanisms: Summary of Results
The main result from our tests of theoretical mechanisms is that polarization is more strongly related to the size of government in countries with fragmented party structures. This is in line with veto player theory; spending proposals are more likely to be vetoed when there are several parties that disagree about the proper course of action. We also found some support for the idea that disagreement about the direction of spending matters more than disagreement about the level of spending (as predicted by Alesina, Baqir, and Easterly Reference Alesina, Baqir and Easterly1999). Although we found no support for theories that rely on strategic behavior of incumbent governments, coalition formation, voter turnout, or voter altruism, our tests of these theories are quite weak, mainly due to few observations and data limitations. More theoretical and empirical research on the link between polarization and size of government is needed before definitive conclusions can be drawn.
CONCLUSION
The relationship between political polarization and size of government has been the subject of much theoretical work in economics and political science. In this article, we conduct the first empirical test of this relationship that uses a measure of political polarization based on self-reported political preferences. From a theoretical perspective, polarization could lead to either larger or smaller governments. We show that our measures of political polarization are strongly negatively correlated with the level of public spending. This relationship is robust to a large set of control variables and holds for several different polarization measures. We also find the correlation between polarization and government size to be significantly stronger among democratic countries, which supports (although it does not prove) a causal interpretation. One particular concern with this interpretation, however, is that three out of our four measures of polarization are based on respondents’ preferred changes from the current size of government, which implies that measured polarization may depend on government size. This is an alternative explanation for our findings that we could not completely rule out.
We made some progress in uncovering why polarization is related to government spending, although further research is needed to draw a firm conclusion. One noteworthy finding is that polarization in the electorate is unrelated to the fragmentation of the government and legislature in terms of the number of political parties. We did, however, find that the effect of political polarization was stronger in countries with fragmented governments, suggesting that polarization in terms of opinions and party structure interact in a way consistent with veto player theory.
The main priority for future research is to better identify the underlying causal mechanism. For this purpose, it would be interesting to examine whether political polarization can explain variation in public spending within countries. A definite test of the causal mechanism does, however, require some kind of exogenous variation in political polarization that does not have an independent effect on the size of government. Unfortunately, it is difficult—if at all possible—to come up with an instrument that affects political polarization, but does not have an independent effect on government size.
Another area for future research is to analyze the determinants of political polarization, a topic that is beyond the scope of this article. Previous research presents several interesting ways to study this question. For example, media probably plays a role in shaping political preferences. Bernhardt, Krasa, and Polborn (Reference Bernhardt, Krasa and Polborn2008) developed a model that predicts that profit-maximizing media firms may have an incentive to supply biased news to partisan audiences, and DellaVigna and Kaplan (Reference DellaVigna and Kaplan2007) and Gerber, Karlan, and Bergan (Reference Gerber, Karlan and Bergan2006) empirically showed that biased media actually affects voting behavior. Political polarization could also be due to a divergence in beliefs about the effects of different policies rather than by a conflict of interest or partisanship. Dixit and Weibull (Reference Dixit and Weibull2007) and Acemoglu, Chernozhukov, and Yildiz (Reference Acemoglu, Chernozhukov and Yildiz2007) theoretically studied how such polarized beliefs could arise.
APPENDIX A: DATA
Data on Party-level/Government/Opposition Polarization
To calculate polarization for political parties and for supporters of the government and opposition, we use the question in the World Values Survey (WVS) that asks respondents about which party the respondent would vote for if national elections were held tomorrow (WVS code: e179). The political parties in the WVS were then matched with data on the number of seats in the legislature and whether the party was in government or opposition. All respondents that supported parties that were not represented in the legislature were excluded from the data. The resulting data was then used to calculate the standard deviation of responses for each political party in each country and for government/opposition supporters in each country.
The data about political parties (number of seats and government/opposition) is based on election results from the most recent election prior to the start of the survey in each country. The main data source Beck et al. (Reference Beck, Clarke, Groff, Keefer and Walsh2001), but we have also relied on other data sources (details are available on request).
TABLE A1. List of Countries, Survey Year, and Political Polarization

Note: Asterisks (*) indicate strong democracies.
TABLE A2. Dependent and Control Variables

Note: GDP, gross domestic product; OECD, Organisation for Economic Development; WVS, World Values Survey.
APPENDIX B: ALTERNATIVE POLARIZATION MEASURES
As discussed in the Data section, there are several ways to measure polarization. In this appendix, we discuss alternative polarization measures, in particular, the polarization measure suggested by Esteban and Ray (Reference Esteban and Ray1994).
Two of the theoretical papers about the relationship between polarization and size of government discussed in this article suggest specific measures of polarization. Alesina, Baqir, and Easterly (Reference Alesina, Baqir and Easterly1999) construct a model where the provision of public goods is decreasing in the median deviation from the median preference for the composition of public goods. This is a crude measure given that there are only a few discrete responses to the questions in the WVS. A close substitute to the median distance to the median is the average absolute deviation from the average. This measure is practically indistinguishable from the standard deviation in our data; the correlation is 0.992 for the government responsibility question. The model by Fernández and Levy (Reference Fernández and Levy2008) calls for a polarization measure based on the probability that two randomly matched individuals in the population hold the same opinion. However, this measure does not resonate well with multiple-choice questions because it treats “4” and “5” on a 1-to-10 scale as two groups, as distinct as “1” and “10”.
Esteban and Ray's (Reference Esteban and Ray1994) measure of polarization includes a parameter α that, loosely speaking, measures the extent of sensitivity to polarization rather than dispersion. To satisfy their axioms, α must be between zero and approximately 1.6. We calculate Esteban and Ray's measure for α equal to 0.5, 1.0, and 1.5. As pointed out in Section 4 of Esteban and Ray's article, their measure is not designed for cases in which individuals in one category also identify with people in the neighboring category. For example, if 25% of respondents answer “1”, 25% answer “2”, and the rest answer “10”, then this is considered less polarized than an equal split between “2” and “10”. However, if people who answer “1” or “2” have similar opinions, then it can be argued that the first example is more polarized because preferences in this group are closer to the end point of the scale. For this reason, we also consider a simple measure of bipolarization: the minimum of the proportion of respondents that answer “1” or “10”. Note that both the standard deviation and Esteban and Ray's polarization measure treat the ordinal scale of responses to multiple-choice questions as an interval scale. Mouw and Sobel (Reference Mouw and Sobel2001) demonstrate that it is possible to measure dispersion without this assumption, but their measure is difficult to interpret in our context. Our bipolarization measure, however, is only based on the ordinal properties of responses.
In the case of Sweden and Brazil (see the Data section), Brazil is more polarized irrespective of which measure is used. The standard deviation is 3.44 in Brazil and 2.22 in Sweden, whereas the measure of bipolarization is 0.23 in Brazil and 0.02 in Sweden. Brazil ranks higher than Sweden based on Esteban and Ray's (Reference Esteban and Ray1994) measure of polarization for all three levels of α, but the relative difference between the two countries falls substantially the higher is α.
Table B1 shows the correlation between the standard deviation and the other polarization measures for all countries in our data based on the question about government responsibility. Esteban and Ray's (Reference Esteban and Ray1994) measure of polarization is strongly correlated with the standard deviation, but the higher is α, the lower the correlation. This suggests that we could test whether it is polarization or dispersion that matters for public spending simply by comparing our results for the standard deviation with those for Esteban and Ray's measure with high α. However, as noted previously, Esteban and Ray's polarization measure is not ideal for measuring polarization of responses to survey questions. In addition, the distribution of polarization scores becomes more skewed the higher is α. To see this, Figure B1 displays histograms of Esteban and Ray's measure for the three different values of α. For example, when α is equal to 1.5, half of the countries are lumped together in a very narrow range. This makes reliable inference difficult. Moreover, our measure of bipolarization is strongly correlated with the standard deviation. This implies that it is difficult to distinguish empirically between “dispersion” and “polarization.”
TABLE B1. Correlations with Polarization Measures (GOV)

FIGURE B1. Histogram of Esteban and Ray's (Reference Esteban and Ray1994) Polarization Measure for the Government Responsibility Question (GOV) for α = 0.5 (left), α = 1.0 (center), and α = 1.5 (right)


