


School lunches have experienced many upheavals in the last three decades. Prior to 1980 the vast majority of children had a school meal provided by the school which was required to meet basic standards(Reference Evans and Harper1), or went home for lunch. The 1980s saw the emergence of the packed lunch brought from home, which overtook school meals as the most popular lunch choice in the late 1990s(Reference Gregory, Lowe and Bates2). Government standards for school meals were reintroduced in 2001, which specified that fruit and vegetables, low-fat starch and dairy food and protein-rich food must be offered to children every day(Reference Evans and Harper1). However, few checks were in place to ensure that these standards were routinely followed and surveys found little benefit to children's food choices at lunchtime as a result of introducing these standards(Reference Nelson, Nicholas and Suleiman3). More rigorous standards were recently introduced into English primary schools; first, food-based standards in September 2006 followed by nutrient-based standards in September 2008(4). Restrictions were placed on certain foods including low-quality meat, savoury snacks and confectionery, in addition to fruit, vegetables, low-fat dairy and starch and protein-rich foods. The nutrient-based standards provide maximum standards for fats, sugars and Na and minimum standards for vitamins and minerals. Currently about 44 % of primary school children have a school meal in the UK(4, 5) and the vast majority of the remainder take a packed lunch which is not covered by these school-meal standards.
Differences between the types of foods in school meals and packed lunches are described in a number of surveys. However, comparisons between lunch types are made difficult by the fact that the contents of lunches vary widely between lunch types. The National Diet and Nutrition Survey (NDNS)(Reference Gregory, Lowe and Bates2) found that, for 4- to 10-year-old children, school meals provided more than half the total consumption of fish, vegetables, chips and ‘other’ potatoes and puddings and over one-third of meat products. They also found that school meals provide a greater percentage of starchy foods and protein-rich foods than the rest of the daily diet but a lower percentage of milk and dairy foods and foods rich in fats and sugars. The most common food items in packed lunches are sandwiches, confectionery, savoury snacks and sweetened drinks(Reference Evans and Cade6). Although differences in the food content are well established, differences in the nutrient content of packed lunches compared with school meals are less clearly defined.
The importance of highlighting differences according to school lunch type is twofold. First, intake at lunchtime may be associated with overall nutrient intake. Studies measuring the impact of lunchtime intake on the total daily dietary intake of primary school-age children have found that high intakes of sugar at lunchtime result in higher levels over the whole day(Reference Rogers, Ness and Hebditch7, Reference Ruxton, Kirk and Belton8). Therefore, highlighting differences in either lunch type could help to identify priorities for improvement to children's diets. Second, recent changes introduced to school meals could potentially have amplified or attenuated differences between school meals and packed lunches in terms of levels of specific nutrients. Any policy-dependent changes in the relationship between lunch types are key to evaluating success of existing policy in this area and determining future recommendations.
With the introduction in 2006 of school-meal standards(9), it is an ideal time to review existing literature to assess the differences in the nutrient content of children's lunches both before, and since, the new standards were introduced. In the past, parents have viewed packed lunches as more nutritious than school meals(Reference Cross and MacDonald10); however, a number of studies have not found this to be the case(Reference Rogers, Ness and Hebditch7, Reference Ruxton, Kirk and Belton8). Furthermore, a study of teenagers aged 13–16 years reported a worse blood profile in young people usually having a packed lunch(Reference Whincup, Owen and Sattar11). The main aims of the present paper are to identify all UK-based cross-sectional studies that have measured a range of nutrients consumed in both school meals and packed lunches in primary school-age children aged 5–11 years since 1990, and to assess the nutritional differences between meal types, using meta-analysis where possible. The secondary aim is to compare the nutritional gap between school meals and packed lunches both before and after the introduction of food-based standards in 2006.
Methods
To compare packed lunches and school meals in British children aged 5–11 years a systematic literature review was carried out of all published and unpublished studies that collected data on both school meals and packed lunches between January 1990 and December 2009. Data on the fourteen nutrients included in the nutrient school-meal standards, plus total sugar, were considered for analysis.
Literature search
A search strategy was developed to identify all surveys measuring lunchtime intake in British primary school children (Table 1). Studies conducted from 1990 onwards were considered for inclusion. Electronic databases used were MEDLINE, EMBASE, BIOSIS and CAB Abstracts. Several websites were also searched using the search terms ‘meal’, ‘pack’, ‘lunch’ and ‘mid-day’ in conjunction with ‘school’ or ‘children’. These were: http://www.thecochranelibrary.com, http://catelogue.bl.uk http://apps.isiknowledge.com, http://lib.leeds.ac.uk/record=b1620056 (index to theses and dissertations) and http://lib.leeds.ac.uk/record=b1617171 (index to theses and dissertations). In addition, all references included in the articles included in the present review were cross-referenced for any additional surveys.
Table 1 Search strategy to identify surveys measuring food and nutrient intake at lunchtime in school children

Inclusion criteria
To be included in the review the surveys needed to satisfy the following criteria:
(1) Study carried out in a British primary school in children aged no younger than 5 years and no older than 11 years;
(2) Data collected from January 1990 up to December 2009;
(3) Measurement of energy and nutrient intakes, not simply provision of these nutrients to children;
(4) Intake assessed by weighing or observation at lunchtime, and not due to recall at a later time or date;
(5) Study assessed both school meals and packed lunches using similar methods;
(6) Published in the English language.
To be included in the meta-analysis the survey was required to provide additional information on the degree of variation such as standard deviation or standard error, to enable calculation of the difference and standard error of the difference between lunch types.
Outcome measures
The outcome measures obtained from the surveys were energy in kJ and weights of protein, total and saturated fat, carbohydrate, total sugar, non-milk extrinsic sugars (NME sugar), fibre (measured as NSP), Na (not including salt added to food), folate, Ca, Fe, Zn, vitamin A and vitamin C.
Statistical analyses
For each nutrient, two related sets of analyses were carried out. First, meta-analyses with all available studies, both published and unpublished, were performed to determine the pooled estimate of the difference between school meals and packed lunches over the whole time period and in two distinct time periods: January 1990 to August 2006 and September 2006 to December 2009. In the first time period no rigorous standards for school meals existed and in the second time period food-based school-meal standards were in place. Second, sensitivity analyses were carried out which included meta-analyses with published studies only in the two time periods. Comparisons were made with results from both analyses.
For each survey the effect size and standard error of the difference in effect size were extracted where available. If not reported, the mean, standard deviation and number in each sample for those having a school meal and those having a packed lunch were extracted where possible and used to estimate the effect size and standard error of the difference. If no measures of mean and standard deviation were reported, the corresponding author was contacted to determine whether the information was available from unpublished sources. Pooled estimates were calculated by weighting each trial by the inverse of the variance and reported together with measures of heterogeneity using I 2 in Stata 10 (StataCorp LP, College Station, TX, USA)(12). I 2 values of greater than 50 % indicate that results need to be interpreted with caution. Forest plots are displayed for the primary analyses where surveys were stratified on time period. Results for nutrients where the pooled estimate was close to zero are described in the text. Results for the sensitivity analyses are reported in a table without forest plots. Meta-regression was used to determine the association of time period (before standards and after standards) on pooled estimates. Random-effects models were used to take account of differences in study design related to collection methods. Authors were contacted for extra information if necessary.
Results
Study information
After removal of duplicate articles, the electronic searching found 812 articles; 236 from MEDLINE, eighty-five from EMBASE, 392 from BIOSIS and ninety-nine from CAB Abstracts. Of these articles, two were deemed to be relevant to the scope of the present review. Three additional references were obtained from searching websites and contacting relevant organisations and authors directly. One additional article was obtained as a result of cross-referencing all references of obtained papers and one further paper was obtained from hand searching the most popular nutrition journals using the keywords ‘meal’, ‘pack’ and ‘lunch’. Finally, two references were existing papers in file.
Seven studies were included in the meta-analyses, five of which contained either published data(Reference Rogers, Ness and Hebditch7, Reference Ruxton, Kirk and Belton8, Reference Mock, Adams and Snowden13, Reference Rees, Richards and Gregory14) or data in the press(Reference Gatenby15). Results reported by Gatenby(Reference Gatenby15) included information from two populations of children, one in an affluent school where no children had free school meals (labelled as ‘affluent’ in forest plots) and one in a school with high levels of free school meals (labelled as ‘FSM’ in forest plots). Two studies contained unpublished results. The first was secondary analysis of NDNS data analysed at the University of Leeds and in preparation for submission for publication in 2010 (CEL Evans, unpublished results). The second included unpublished results from the School Food Trust containing data from a 2007 survey submitted for publication in 2009 (J Pearce, unpublished results). Two studies lacked measures of variation such as standard deviation or standard error and were excluded from the meta-analysis(16, Reference Tilston, Neale and Gregson17). Information on the seven studies used in the review is shown in Table 2. The studies utilised a variety of different methods to measure nutrient intake and varied in the age range sampled.
Table 2 Summary of surveys on school meals and packed lunches
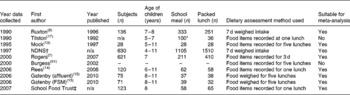
n/a, data not available; NDNS, National Diet and Nutrition Survey; FSM, free school meals.
* Estimated from percentages.
† CEL Evans, unpublished results.
‡ J Pearce, unpublished results.
Six studies reported means and standard deviations for each nutrient. The NDNS data reported effect size and standard error of the difference using multilevel analysis to take into account that data was collected over a whole week and not 1 d only. The studies excluded from the meta-analysis reported means only. All seven studies reported results for energy, protein, total fat, carbohydrate, NSP, Fe and vitamin C. Six studies reported results for total sugar, saturated fat, Ca, folate and vitamin A. Five studies reported results for Na and two for NME sugars. Four studies reported results for Zn. Two authors (Ruxton(Reference Ruxton, Kirk and Belton8) and Rees(Reference Rees, Richards and Gregory14)) provided extra unpublished information on fats and sugars. Mock(Reference Mock, Adams and Snowden13) could not be contacted for extra information on total sugar.
Nutrients
The nutrient levels in each study by meal type are detailed in Table 3. Pooled estimates and 95 % CI for the difference in energy and fourteen nutrients, namely, energy, protein, total fat, saturated fat, carbohydrate, total sugar, NME sugar, NSP, folate, Ca, Na, vitamin A and vitamin C, between school meals and packed lunches were obtained. A positive pooled estimate indicates higher levels in packed lunches, and a negative pooled estimate indicates higher levels in school meals. The pooled estimates from the sensitivity analysis with CI and levels of heterogeneity for each nutrient are presented in Table 4.
Table 3 Summary data of surveys on school meals and packed lunches included in meta-analyses

NDNS, National Diet and Nutrition Survey; FSM, free school meals; SFT, School Food Trust; n/a, not available; NMES, non-milk extrinsic sugars.
* M Metsalaar, unpublished results.
† C Ruxton, G Rees and J Pearce, unpublished results.
Table 4 Pooled estimates of differences in nutrient intake in packed lunches compared with school meals (no standards v. food-based standards) using published surveys from 1990 to 2007 (excluding unpublished results)

FSM, free school meals; NMES, non-milk extrinsic sugars.
Seven out of eight studies reported higher energy intakes in packed lunches compared with school meals. Based on all data, the pooled estimate for energy intake was 543 (95 % CI 233, 854) kJ. Energy intake was similar in packed lunches and school meals before standards were introduced (see Fig. 1) and 950 kJ higher in packed lunches (95 % CI 383, 1517 kJ) with food-based standards in place. I 2 was higher than 50 % for both time periods. The sensitivity analysis with published data only indicated that energy intake was higher in packed lunches both before and after standards were introduced. I 2 was lower than 50 % for earlier studies but higher than 50 % for the period with standards in place (see Table 4). The difference in energy intake between school meals and packed lunches increased by 781 (95 % CI − 19, 1580) kJ after the introduction of food-based standards.

Fig. 1 Forest plot of pooled estimate (ES) of difference in energy intake (kJ) by lunch type in primary school children. NDNS, National Diet and Nutrition Survey; FSM, free school meals; SFT, School Food Trust. * M Metsalaar, unpublished results. † C Ruxton, G Rees and J Pearce, unpublished results.
Six out of eight studies reported higher protein intakes in school meals compared with packed lunches. Based on all data (forest plot not shown), the pooled estimate for protein intake was − 1·6 (95 % CI − 3·2, 0) g. Protein intake was similar in packed lunches and school meals before standards were introduced (pooled estimate 2·1 (95 % CI − 4·4, 0·3) g; I 2 = 95 %) and after the introduction of standards (pooled estimate 0·8 (95 % CI − 2·1, 0·5) g; I 2 = 0 %). The sensitivity analysis with published data only confirmed that protein intake was similar in packed lunches and school meals both before and after the introduction of standards (see Table 4). The difference in protein intake between school meals and packed lunches increased by 1·1 (95 % CI − 2·2, 4·5) g after the introduction of food-based standards.
All eight studies reported higher carbohydrate intakes in packed lunches compared with school meals. Based on all data (forest plot not shown), the pooled estimate for carbohydrate intake was 18·1 (95 % CI 10·9, 25·3) g. Carbohydrate intake was higher in packed lunches before standards were introduced (pooled estimate 11·3 (95 % CI 2·0, 20·5) g; I 2 = 96 %) and after the introduction of standards (pooled estimate 26·5 (95 % CI 12·2, 40·9) g; I 2 = 93 %). The sensitivity analysis with published data only indicated that carbohydrate intake was higher in packed lunches both before and after the introduction of standards (see Table 4). The difference in carbohydrate intake between school meals and packed lunches increased by 15 (95 % CI − 7·7, 37·7) g after the introduction of food-based standards.
Six out of eight studies reported higher total fat intakes in packed lunches compared with school meals. Based on all data (see Fig. 2), the pooled estimate for total fat intake was 7·0 (95 % CI 1·5, 12·5) g. Total fat difference was close to zero before standards were introduced and 13·2 g higher in packed lunches (95 % CI 1·5, 24·9 g) with food-based standards in place. The sensitivity analysis with published data only indicated that total fat intake was similar in packed lunches and school meals both before and after standards were introduced (see Table 4). The difference in total fat intake between school meals and packed lunches increased by 12·2 (95 % CI − 3·3, 27·8) g after the introduction of food-based standards. I 2 was higher than 50 % for both time periods.

Fig. 2 Forest plot of pooled estimate of (ES) difference in total fat intake (g) by lunch type in primary school children. NDNS, National Diet and Nutrition Survey; FSM, free school meals; SFT, School Food Trust. * M Metsalaar, unpublished results. † C Ruxton, G Rees and J Pearce, unpublished results.
Seven out of seven studies reported saturated fat intakes higher in packed lunches. Based on all data available (see Fig. 3), the pooled estimate for saturated fat intake was 4·7 (95 % CI 2·4, 7·1) g. Saturated fat was 2·6 g higher in packed lunches (95 % CI 0·5, 4·7 g) before standards were introduced and 6·4 g higher in packed lunches (95 % CI 2·8, 9·9 g) with food-based standards in place. The sensitivity analysis with published data only confirmed that saturated fat intake was higher before and after standards were introduced (see Table 4). The difference in saturated fat intake between school meals and packed lunches increased by 3·7 (95 % CI − 2·2, 9·6) g after the introduction of food-based standards. I 2 was higher than 50 % for both time periods.
Fig. 3 Forest plot of pooled estimate (ES) of difference in saturated fat (sat fat) intake (g) by lunch type in primary school children. NDNS, National Diet and Nutrition Survey; FSM, free school meals; SFT, School Food Trust. * M Metsalaar, unpublished results. † C Ruxton, G Rees and J Pearce, unpublished results.
Seven out of seven studies reported higher total sugar intakes in packed lunches compared with school meals. Based on all data available (see Fig. 4), total sugar intake was 14·0 (95 % CI 10·3, 17·7) g. Total sugar was 10·1 g higher in packed lunches (95 % CI 6·3, 13·9 g) before standards were introduced and 18 g higher in packed lunches (95 % CI 11·7, 24·3 g) with food-based standards in place. The sensitivity analysis with published data only confirmed that total sugar intake was higher both before and after standards were in place (see Table 4). The difference in total sugar intake between school meals and packed lunches increased by 7·8 (95 % CI − 3·4, 19) g after the introduction of food-based standards. I 2 was higher than 50 % for both time periods.

Fig. 4 Forest plot of pooled estimate (ES) of difference in total sugar intake (g) by lunch type in primary school children. NDNS, National Diet and Nutrition Survey; FSM, free school meals; SFT, School Food Trust. * M Metsalaar, unpublished results. † C Ruxton, G Rees and J Pearce, unpublished results.
Five out of five studies reported higher NME sugar intakes in packed lunches compared with school meals. Based on all data available (see Fig. 5), the pooled estimate for NME sugar intake was 11·7 (95 % CI 10·3, 17·7) g. NME sugar intake was 6·7 g higher in packed lunches (95 % CI 3·8, 9·6 g) before standards were introduced and 17·5 g higher in packed lunches (95 % CI 8·2, 26·9 g) with food-based standards in place. The sensitivity analysis with published data only confirmed that NME sugar intake was higher both before and after standards were introduced (see Table 4). The difference in NME sugar intake between school meals and packed lunches increased by 10·5 (95 % CI − 4·9, 25·9) g after the introduction of food-based standards. I 2 was higher than 50 % for both time periods.

Fig. 5 Forest plot of pooled estimate (ES) of difference in total non-milk extrinsic sugar (NMES) intake (g) by lunch type in primary school children. NDNS, National Diet and Nutrition Survey; FSM, free school meals; SFT, School Food Trust. * M Metsalaar, unpublished results. † C Ruxton, G Rees and J Pearce, unpublished results.
Five out of eight studies reported higher fibre intakes in packed lunches compared with school meals. Based on all data (forest plot not shown), the pooled estimate for fibre intake was 0·2 (95 % CI − 0·5, 0·9) g. Fibre intake was similar in packed lunches and school meals before standards were introduced (pooled estimate 0·1 (95 % CI − 0·9, 1·1) g; I 2 = 98 %) and after the introduction of standards (pooled estimate 0·4 (95 % CI − 0·8, 1·5) g; I 2 = 94 %). The sensitivity analysis with published data only indicated that fibre intake was similar in packed lunches and school meals before standards and slightly higher in packed lunches with standards in place (see Table 4). The difference in fibre intake between school meals and packed lunches increased by 0·3 (95 % CI − 1·4, 1·9) g after the introduction of food-based standards.
Six out of six studies reported higher Na intake in packed lunches compared with school meals. Based on all data available (see Fig. 6), the pooled estimate for Na intake was 357 (95 % CI 174, 539) mg. Na intake was 114 mg higher in packed lunches (95 % CI − 11, 239 mg) before standards were introduced and 483 mg higher in packed lunches (95 % CI 276, 690 mg) with food-based standards in place. The sensitivity analysis with published data only confirmed that Na intake was higher with standards in place (see Table 4); however, no analysis was carried out for the earlier time period, as only one study was available. The difference in Na intake between school meals and packed lunches increased by 369 (95 % CI − 69, 807) mg after the introduction of food-based standards. I 2 was higher than 50 % for both time periods.

Fig. 6 Forest plot of pooled estimate (ES) of difference in Na intake (mg) by lunch type in primary school children. NDNS, National Diet and Nutrition Survey; FSM, free school meals; SFT, School Food Trust. * M Metsalaar, unpublished results. † C Ruxton, G Rees and J Pearce, unpublished results.
Six out of eight studies reported higher Fe intakes in packed lunches compared with school meals. Based on all data available (see Fig. 7), the pooled estimate for Fe intake was 0·3 (95 % CI 0, 0·6) mg. Fe intake was similar in school meals and packed lunches before standards were introduced (pooled estimate 0·1 mg higher in packed lunches, 95 % CI − 0·3, 0·5 mg) and 0·6 mg higher in packed lunches (95 % CI 0·2, 1·0 mg) with food-based standards in place. The sensitivity analysis with published data only confirmed that Fe intake was similar in school meals and packed lunches before standards and higher in packed lunches with standards in place (see Table 4). The difference in Fe intake between school meals and packed lunches increased by 0·5 (95 % CI − 0·2, 1·2) mg after the introduction of food-based standards. I 2 was higher than 50 % for both time periods.

Fig. 7 Forest plot of pooled estimate (ES) of difference in Fe intake (mg) by lunch type in primary school children. NDNS, National Diet and Nutrition Survey; FSM, free school meals; SFT, School Food Trust. * M Metsalaar, unpublished results. † C Ruxton, G Rees and J Pearce, unpublished results.
Three out of five studies reported higher Zn intakes in school meals compared with packed lunches. Based on all data available (forest plot not shown), the pooled estimate for Zn intake was 0·1 (95 % CI − 0·1, 0·4) mg. Zn intake was higher in school meals before standards were introduced (pooled estimate − 0·4 (95 % CI − 0·7, − 0·1) mg; I 2 = 95 %) but similar with food-based standards in place (pooled estimate 0·1 (95 % − 0·1, 0·3) mg; I 2 = 21 %). The sensitivity analysis with published data only confirmed that Zn intake was similar in school meals and packed lunches with standards in place (see Table 4). Insufficient data were available in the earlier time period. The difference in Zn intake between school meals and packed lunches increased by 0·5 (95 % CI − 0·1, 1·1) mg after the introduction of food-based standards.
Seven out of eight studies reported higher Ca intakes in packed lunches compared with school meals. Based on all data available (forest plot not shown), the pooled estimate for Ca intake was 55·5 (95 % CI 20·9, 90) mg. Ca intake was similar in school meals and packed lunches before standards were introduced (pooled estimate 27·5 mg higher in packed lunches; 95 % CI − 7·8, 62·8 mg; I 2 = 97 %) and higher in packed lunches after the introduction of food-based standards (pooled estimate 81·7 (95 % CI 12·8, 150·7) mg; I 2 = 84 %). However, the sensitivity analysis with published data only did not confirm this and indicated that Ca intake was higher in packed lunches before the introduction of standards and similar when standards were in place (see Table 4). The difference in Ca intake between school meals and packed lunches increased by 55·7 (95 % CI − 52·4, 163·9) mg after the introduction of food-based standards.
Four out of seven studies reported higher folate intakes in school meals compared with packed lunches. Based on all data (forest plot not shown), the pooled estimate for folate intake was − 1·5 (95 % CI − 9·2, 6·3) μg. Folate intake was similar in packed lunches and school meals before standards were introduced (pooled estimate 0·1 μg higher in school meals; 95 % CI − 11·1, 10·9 μg; I 2 = 97 %) and after the introduction of standards (pooled estimate 3·0 μg higher in packed lunches; 95 % CI − 9·2, 6·3 μg; I 2 = 0 %). However, the sensitivity analysis with published data only indicated that folate intake was higher in packed lunches before the introduction of standards but similar when standards were in place (see Table 4). The difference in folate intake between school meals and packed lunches increased by 3·1 (95 % CI − 22·3, 16·1) μg after the introduction of food-based standards.
Five out of eight studies reported higher vitamin C intakes in packed lunches compared with school meals. Based on all data (forest plot not shown), the pooled estimate for vitamin C intake was 4·6 (95 % CI 0·2, 9) mg. Vitamin C intake was similar in packed lunches and school meals before standards were introduced (pooled estimate 5·8 (95 % CI − 0·4, 12·0) mg; I 2 = 93 %) and after the introduction of standards (pooled estimate 3·4 (95 % CI − 1·9, 8·6) mg; I 2 = 39 %). The sensitivity analysis with published data only indicated that vitamin C intake was higher in packed lunches before standards but similar when standards were in place (see Table 4). The difference in vitamin C intake between school meals and packed lunches increased by 2·9 (95 % CI − 16·9, 11·2) mg after the introduction of food-based standards.
Five out of seven studies reported higher vitamin A intakes in packed lunches compared with school meals. Based on all data (forest plot not shown), the pooled estimate for vitamin A intake was − 12·5 (95 % CI − 55·7, 30·8) μg. Vitamin A intake was similar in packed lunches and school meals before standards were introduced (pooled estimate 39·9 μg higher in school meals; 95 % CI − 87·5, 7·7 μg; I 2 = 91 %) and after the introduction of standards (pooled estimate 25·9 μg higher in packed lunches; 95 % CI − 42·2, 94·1 μg; I 2 = 73 %). The sensitivity analysis with published data only indicated that vitamin A intake was similar before standards but higher in packed lunches when standards were in place (see Table 4). The difference in vitamin A intake between school meals and packed lunches increased by 65·3 (95 % CI − 42·5, 173·0) μg after the introduction of food-based standards.
Discussion
This meta-analysis is the first formal comparison of the nutrient content of packed lunches with school meals consumed by primary school children in the UK. The number of surveys that have measured both school meal and packed lunch nutrient intake over the last 20 years is small and heterogeneity between studies is high; however, some important findings were identified.
Intakes of carbohydrate, total sugar, NME sugar, saturated fat and Na were consistently reported to be higher in packed lunches compared with school meals by all studies. Energy and Fe levels were also higher in packed lunches in most studies.
Total sugar intake and NME sugar intake were estimated to be approximately 10 g and 7 g higher, respectively, for children having a packed lunch compared with those having a school meal before the introduction of school-meal standards. This gap widened to 18 g for both total and NME sugars after the introduction of school-meal standards. There is a suggestion that the gap between school meals and packed lunches in terms of sugars is widening although this was not significant when tested and heterogeneity was high for these analyses.
These results are consistent with the results from the largest UK study published on school meals by Nelson et al. (Reference Nelson, Nicholas and Suleiman3) and the largest published study on packed lunches by Evans & Cade(Reference Evans and Cade6) where NME sugar levels were 29 g in packed lunches and 14 g in school meals. The difference between school meals and packed lunches was particularly dramatic in a school in a more deprived area collected by Gatenby(Reference Gatenby15). Children having school meals since 2006 to the present usually have water to drink, although they invariably consume a pudding(Reference Gregory, Lowe and Bates2). Children having a packed lunch usually consume confectionery as well as a sweetened drink(Reference Evans and Cade6, Reference Jefferson and Cowbrough18, Reference Jefferson and Cowbrough19). The main reason for the higher sugar levels in packed lunches is therefore most likely to be due to sweetened drinks and/or having more than one sweet snack. High sugar intakes from drinks are associated with higher body weights in children(Reference Gibson and Neate20) and increased risk of impaired blood profile and diabetes mellitus(Reference Vartanian, Schwartz and Brownell21), although total sugar intakes from all sources are not associated with body weight in children(Reference Gibson and Neate20).
Saturated fat intake was estimated to be approximately 2·6 g higher for children having a packed lunch compared with those having a school meal before the introduction of school-meal standards, increasing to 6·4 g after the introduction of school-meal standards. The food-based school-meal standards include improvements in the quality of meat served to children and in particular include restrictions on processed meat products, which may have contributed to the widening of the gap between lunch types. Surveys of children's diets in developed countries have generally concluded that saturated fat intake is too high(Reference Gregory, Lowe and Bates2, Reference Biró, Regöly-Mérei and Nagy22, Reference López-Frías, Nestares and Iañez23). High levels of fats, particularly saturated fats, are linked with higher levels of serum total and LDL-cholesterol(Reference Crowe, Skeaff and Green24, Reference Mensink and Katan25), higher blood pressure(Reference Mensink, Janssen and Katan26), atherosclerosis(Reference Merchant, Kelemen and de Koning27) and increased risk of obesity(Reference Gibson28, Reference Berenson, Wattigney and Tracy29). In turn, high cholesterol levels themselves are an established risk of CVD, due to the increased risk of atherosclerosis, which starts in childhood(Reference Berenson, Srinivasan and Bao30). Children with high serum cholesterol levels are also more at risk of having high serum cholesterol levels as adults(Reference Webber, Harsha and Phillips31). A recent review of trials has determined an association between CVD and high total fat intake(Reference Hooper, Summerbell and Higgins32). However, in this study, the evidence for higher total fat intakes in packed lunches was not consistent. At the time of the packed lunch survey, the profile of some foods popular in lunch boxes, such as savoury snacks, had recently been updated to reduce the saturated fat content(Reference Evans and Cade6).
Na intake was estimated to be broadly similar in children having either lunch type before the introduction of school-meal standards. However, after the introduction of school-meal standards, Na intake was nearly 500 mg higher in packed lunches compared with school meals. This widening gap was not significant when tested but suggests that Na intake in school meals has reduced with the introduction of food-based standards. These standards restrict the use of savoury snacks and processed meats that are more likely to contain high levels of salt. Packed lunches generally contain foods high in Na such as sandwiches, savoury snacks and dairy products(Reference Evans, Greenwood and Thomas33). Lower dietary Na intakes are associated with lower blood pressure(Reference Sacks, Svetkey and Vollmer34–Reference He and MacGregor37) and a reduction in CVD(Reference Cook, Cutler and Obarzanek38), therefore reductions in Na intake are beneficial to health.
Packed lunches were nutritionally superior to school meals in one respect, namely Fe. Children having packed lunches since the introduction of school-meal standards had higher Fe intakes at lunchtime. This is possibly a consequence of reducing processed meat products such as sausage rolls and burgers, which tend to be higher in Fe than poultry that has now replaced these products. Many children are consuming lower Fe levels than recommended(Reference Gregory, Lowe and Bates2).
Even small sustained higher levels of total sugar, saturated fat and Na intakes at lunchtime of children having packed lunches v. school meals could potentially have an impact on long-term health of young people. Indeed, there are reports that plasma insulin levels in young people aged 13–16 years who usually take a packed lunch are 7 % higher than in those who usually take a school meal(Reference Whincup, Owen and Sattar11). This could be the result of slightly higher sugar intakes over extended periods of time. The same study also reported a 4·5 % increase in the total:HDL-cholesterol ratio and a slightly higher systolic blood pressure in those regularly having a packed lunch, although differences were not statistically significant. The NDNS of young people(Reference Gregory, Lowe and Bates2) reported that there were no significant differences by lunch type for blood cholesterol levels and haematological analytes in younger children aged 4–10 years. Therefore, differences in nutrient intake may not become apparent as effects on CVD risk markers until children are older.
Interventions to improve health may be successful with relatively minor decreases in fat, sugar and Na. A meta-analysis of interventions in adults concluded that a reduction in total fat intake of 2·5 % is enough to reduce cholesterol levels by a useful amount(Reference Brunner, White and Thorogood39). The benefits of reducing fat intake in children on risk of disease in adulthood are not as yet well understood. Some evidence exists of the benefit of improvements in fat intake(Reference Brunner, Shipley and Blane40, Reference Caballero41); however, more work is necessary in this area.
The results for other nutrients were inconsistent. Levels of protein, folate, vitamin C and Zn were broadly similar in both lunch types. Results for remaining nutrients, namely, energy, total fat, fibre, Ca and vitamin A, were less consistent, with less evidence of differences by lunch type. Although there was evidence that energy intake is higher in packed lunches, particularly since the introduction of standards, this was at odds with the results of the national study (NDNS) which reported lower energy intakes for packed lunches while all the remaining studies (which were regional) reported higher energy intakes in packed lunches. This national survey looked at the whole day, not just lunchtime, and had a different focus for staff and parents at lunchtime than studies which just measured intake at lunch and therefore may be less biased towards changes in lunchtime intake due to the study. Unfortunately, the lack of focus on lunchtime meant that assumptions had to be made about which foods constituted lunch due to the methods of data collection. This may have led to packed lunch foods that were eaten at morning or afternoon break not being included in the lunchtime analysis and a reduction in the mean energy intake at lunchtime of children having packed lunches.
Weaknesses of the present study include the following points. Heterogeneity between studies was high for most analyses, making robust conclusions difficult. This is probably due to the different methodology used to collect nutritional data from each study. Sources of error are many. The most recent edition of the Composition of Foods, which provides the nutrient content of a range of foods, does not include analysis of every food available in supermarkets and updates the results approximately once every 10 years, necessitating estimation. However, in the UK this information from the Royal Society of Chemistry is the only source of nutritional information. Some nutrients such as Zn and NME sugars intake were not collected in all studies, making it more difficult to make conclusions. An up-to-date review of school meals and packed lunches is further complicated by the fact that data take a number of years to publish. Unpublished results were used for this reason. The findings of the present report may change when the nutritional standards are implemented from September 2008.
Studies assessing differences between school meals and packed lunches are relatively rare; however, many recent changes have been made to school meals and therefore the authors recommend more regular data collection to determine differences in lunch type after the nutrient standards were introduced in September 2008. The present study provides some evidence that packed lunches are less nutritious than school meals. The widening of the gap between lunch types in recent years may be partly due to the improvement of school meals and partly due to the worsening of packed lunches in terms of fats, sugars and Na content. Efforts to increase the proportion of children having a school meal or improving the content of packed lunches, particularly in reducing added sugars and saturated fat, would be beneficial to children. The main sources of sugars in packed lunches are sweetened drinks, confectionery and yoghurts(Reference Evans and Cade6). The main sources of fats, including saturated fats, are confectionery and crisps. American multi-component school-based interventions that have reduced fat intake at lunchtime(Reference Greenwald, Clifford and Milner42, Reference Arbeit, Johnson and Mott43) have mainly concentrated on lunches provided by schools, and recommend substituting other less-energy-dense foods such as fruit, vegetables or cereals(Reference Epstein, Gordy and Raynor44–Reference Heald, Golding and Sharma46) or including more low-fat choices at lunchtime(Reference Arbeit, Johnson and Mott43). However, encouraging young people to replace these energy-dense packed lunch foods provided from home with foods higher in starch and lower in fat and sugar is more challenging.
One recent intervention had some success in changing packed lunch food types such as fruit and vegetables but little impact on intake of fats and sugars(Reference Evans, Greenwood and Thomas47). Schools are now strongly encouraged to have a packed lunch policy providing parents with clear guidelines on what to provide for their child's lunch. Reducing consumption of sweetened drinks, which are linked to increases in weight and risk factors for diabetes, may be the first step to improving children's food intake at lunchtime. The best solution may be to increase take-up of school meals by offering cheap or free meals. Recent pilot schemes in Scotland (Hungry for Success)(48) reported a doubling of take-up to 85 % when free school meals were made available. Further pilots are now in place in Durham, Newham and Wolverhampton. Partial subsidy would still potentially be beneficial in terms of school meal uptake, as price is a strong predictor of take-up level(Reference Rona and Chinn49).
Conclusion
Packed lunches had a worse nutrient profile compared with school meals for all nutrients considered. This was true even before the school meal food-based standards were introduced. The introduction of food-based standards for school meals in 2006 has moderately improved the nutrient content of school meals, slightly widening the gap between school meals and packed lunches. With no standards in place for packed lunches brought from home, nutrient-based standards introduced in 2008 may further widen this gap.
Acknowledgements
No specific funding was obtained for the present study.
We are extremely grateful to Dr Carrie Ruxton, Dr Gail Rees and to Jo Pearce for providing additional unpublished results from their nutritional surveys of children's lunches. We would also like to thank Manon Metsalaar for carrying out the secondary analysis of the NDNS data used in the present review.
C. E. L. E. carried out the statistical analysis and wrote the first draft. C. L. C. carried out the systematic review and contributed to the final draft. D. C. G. provided statistical guidance and support and contributed to the final draft. J. E. C. provided guidance for the analysis and contributed to the final draft.
There is no conflict of interest.


