


Systems for the continuous monitoring of interstitial fluid glucose are used in the clinical management of patients with diabetes to supplement information gained from repeated capillary blood glucose(Reference Maran, Crepaldi and Tiengo1). Interstitial fluid glucose is sufficiently related to circulating blood glucose levels to make such clinical use of value.
The use of such systems has been validated particularly with regard to the ability to reliably detect and report high and low glucose values in people with diabetes(Reference Monsod, Flanagan and Rif2). The ability to continuously measure glucose concentration may have scientific value in a number of non-diabetic settings, for example to investigate the relationship between circulating glucose changes and nutritional intake, and behaviours such as appetite or cognitive function. However, there are no studies validating use of such systems in healthy non-diabetic subjects.
Real-time interstitial fluid glucose levels may be influenced by factors other than central arterial blood glucose levels, which could differ between diabetic and non-diabetic individuals. Physiological factors may include local tissue metabolism of glucose, local and regional differences in blood flow rates, arteriovenous shunting of blood, make-up of subcutaneous tissue and other obscure variables. Research groups including ours have used continuous interstitial glucose-monitoring devices to examine real-time changes in glucose levels after meals and their relationship to either cognitive function, appetite control or physical activity(Reference Brouns, Bjorck and Frayn3–Reference Simpson, Holdsworth and Macdonald6). These studies require frequent concomitant measurement of biological (glucose levels) and psychological or behavioural (appetite, cognitive performance and physical activity) parameters. Assessment of the nature of the relationship between appetite, cognitive function and circulating glucose availability has to date been compromised by reliance on finger capillary glucose measurement, since this cannot be undertaken continuously during other activities. The only practical way to frequently assess glucose levels within such a study is to use a system, which measures glucose continuously in interstitial fluid and which does not interfere with other experimental procedures such as test meal consumption and computerised cognitive testing.
Measurement of glucose from arterialised venous (AV) plasma is considered the best available proxy measure of central arterial glucose(Reference Liu, Moberg and Kollind7). The most convenient method to estimate circulating glucose is by capillary glucose measurement. Therefore, in the present study, we sought to examine the relationship between glucose concentrations measured from the interstitial fluid with those in AV blood and less frequently measured finger capillary glucose in non-diabetic subjects. We studied overweight males who were likely to show a greater (albeit non-diabetic) glucose excursion following a 75 g oral glucose load.
Methods
Subjects
Fifteen healthy male volunteers with a BMI in the overweight range (26–31 kg/m2) aged between 30 and 50 years were recruited. Baseline questionnaires administered to subjects at recruitment included personal details, medical screening questions, the Dutch Eating Behaviour Questionnaire(Reference Van Strien, Frijters and Bergers8) and the Three-Factor Eating Questionnaire(Reference Stunkard and Messick9). Bioimpedance (Biospace Inbody 3.0, Seoul, Korea) was used to determine body composition at screening. Exclusion criteria were known diabetes, smoking, high habitual caffeine intake (more than four cups of instant coffee per day), high levels of exercise (i.e. no more than four episodes of physical exercise per week) and concurrent use of medication (including over-the-counter medicines and recreational drugs). Subject characteristics are shown in Table 1.
Table 1 Subject characteristics
(Mean values and standard deviations)
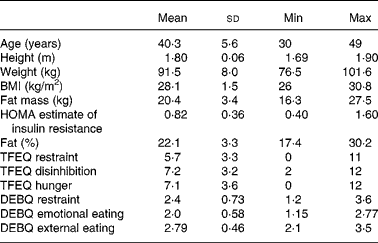
Min, minimum; Max, maximum; HOMA, homeostatic model assessment; TFEQ, Three-Factor Eating Questionnaire; DEBQ, Dutch Eating Behaviour Questionnaire.
The present study was conducted according to the guidelines laid down in the Declaration of Helsinki, and all procedures involving human subjects were approved by Leeds West NHS Ethics Committee. Written informed consent was obtained from all subjects.
Procedure
The study was designed to examine the relationship between interstitial glucose using the Glucoday® (A Menarini Diagnostics, Firenze, Italy)(Reference Varalli, Marelli and Maran10) continuous ambulatory glucose-monitoring device (AGD), AV blood and capillary (finger prick, FP)) glucose profiles in response to an oral glucose tolerance test (OGTT) in moderately overweight male subjects.
Subjects were instructed to adhere to their normal energy intake for 3 d before the test day and also to refrain from exercise and alcohol the day before the test.
All subjects were given a standard evening meal with moderately high glycaemic index and a drink for consumption between 19.30 and 21.00 hours before the test day. The standard evening meal was chosen to be moderately high GI, since a low GI evening meal has been shown to blunt the glycaemic response to a high GI meal at breakfast(Reference Stevenson, Williams and Nute11). A snack was also provided at 22.00 hours on the night before the test day to avoid a fast longer than 12 h in line with WHO recommendations for OGTT(12). Average energy intake from the evening meal and snack was 5263·5 kJ (1258 kcal; 15·9 g fat; 37·0 g protein and 257·8 g carbohydrate). Subjects were allowed to consume water ad libitum throughout the test day. They were provided with bottled water for consumption before retiring on the evening before the test day and also for consumption after rising on the morning of the test day itself.
On the morning of the test day and following an overnight fast of at least 8 h, subjects attended the Human Appetite Research Unit. Subjects were fitted with the Glucoday® device by a trained researcher according to the manufacturer's instructions at 07.00 hours to allow a 2 h device stabilisation period. At 08.45 hours, the forearm was warmed using a thermostatically controlled electric blanket to a temperature of 40–45°C and this was maintained throughout the blood sampling period(Reference Liu, Moberg and Kollind7). An 18 gauge intravenous catheter was inserted into the cephalic vein at the wrist in a retrograde direction to collect AV blood.
Three venous samples for fasting glucose and insulin were taken at 5 min intervals starting at 09.00 hours. At 10.00 hours, subjects consumed a glucose drink (Lucozade 419 ml) containing 75 g anhydrous glucose over a 5-min period. AV samples for glucose were drawn every 3 min for 90 min starting at 10.00 hours until 11.30 hours and at 9-min intervals for the remainder of the test period (until 13.00 hours). Thus, in total, forty-four AV samples were drawn from each participant.
From 09.00 to 10.00 hours, three capillary blood samples were taken at 30-min intervals. A further six capillary blood samples were taken at 15-min intervals from 10.15 to 11.30 hours followed by three additional samples taken at 30-min intervals from 12.00 to 13.00 hours. Therefore, a total of twelve capillary blood samples were taken. At 13.00 hours, the intravenous catheter and Glucoday® device were removed and subjects were allowed to eat.
Capillary blood glucose measurement
Capillary blood glucose was measured using the same precalibrated GlucoMen® Visio Meter (z) for each subject. CV for reference venous whole-blood samples in the range 2·1–22·0 mmol/l are 0–4·3 %. The GlucoMen® Visio system is calibrated v. venous plasma values using a Yellow Springs 2300 analyzer and shows very good accuracy when tested by hexokinase method on a Roche laboratory analyser, according to the manufacturer's information.
Continuous interstitial ambulatory glucose-monitoring device
Interstitial glucose was measured via continuous ambulatory monitoring using the Glucoday® microdialysis technique. The Glucoday® device consists of a microdialysis fibre, which is inserted into the subcutaneous tissue, and a biosensor, which consists of a glucose oxidase membrane. The device provides 3 min interstitial glucose estimates for up to 48 h. The AGD was calibrated against FP, according to the manufacturer's instructions using a one-point calibration before OGTT (capillary sample 3).
Arterialised venous glucose measurement
AV blood samples (each 1 ml) were taken at regular intervals from an indwelling catheter into glucose oxalate tubes, centrifuged and aliquoted (2 × 250 μl), before being frozen at − 80°C. The cannula was kept patent with a flush of at least 1 ml 0·9 % sodium chloride solution after each sample had been taken. Before each sample was taken, 1 ml of blood was drawn and discarded. Glucose was analysed using the hexokinase method on a Pentra 400 Horiba ABX clinical chemistry analyser (Montpellier, France). Within-assay precision for twenty repeat tests gave a CV of 0·8 %, and between-assay precision for the samples tested in duplicate over 20 days gave a CV of 1·7 %. Mean percentage of CV for low glucose (1·7 mmol/l) was 1·2 %, medium (5·2 mmol/l) was 0·5 % and high (14 mmol/l) was 0·7 %.
Blood insulin profiles
Three 2 ml blood samples were collected, at 5-min intervals (see schedule), into a serum tube, centrifuged and aliquoted (two 0·5 ml aliquots) and frozen at − 80°C. Insulin was measured using a time-resolved fluorescence immunoassay on an AutoDELFIA (PerkinElmer, Waltham, MA, USA) automated analyser. For twenty runs, within-assay mean precision was 2·0 % CV and between-assay mean precision 2·7 % CV. Mean CV for low insulin (5·65 μU/ml) was 2·4 % within- and 2·3 % between-assay precision; for medium insulin (13·7 μU/ml), CV was 1·8 % within- and 3 % between-assay precision and for high (30·2 μU/ml) was 1·7 % within- and 3·5 % between-assay precision.
This assay detects biologically active insulin with a high degree of specificity. HOMA estimates of insulin resistance(Reference Matthews, Hosker and Rudenski13) (based on the mean of the three fasting insulin and glucose levels) were calculated.
Data analysis
The AGD records a measurement every 3 min, capillary blood glucose and AV measurements were made as close in real time as possible to the corresponding AGD measurements, but could not be exactly synchronised. All three measurements were, however, within 3 min of each other. Data were aligned on a minute-by-minute basis with time 0 set as the start of consumption of the oral glucose load. The period of analysis began at 30 min before commencement of the OGTT and concluded with the final venous sample taken 182–186 min after the commencement of the OGTT.
In order to compare the data from all measures on a minute-by-minute basis, it was necessary to interpolate values for each measure for those minutes where measured values were not obtained. Interpolation of data was performed using the software package R 2.6.0(14). The same interpolation method was used for each measure.
Interpolation was done using a highly robust locally weighted scatterplot smoother(Reference Cleveland, Grosse, Shyu, Chambers and Hastie15). This was chosen in preference to linear or cubic splines, which produced physiologically implausible predicted values, especially before the sharp increase in glucose in response to the glucose load.
The bandwidth or smoothing span applied to each measure was chosen to be as small as possible(Reference Härdle16) without resulting in physiologically implausible predicted values. For AV where forty-four actual measurements per participant were available, a smoothing span of 0·05 was used. For the capillary blood glucose (FP) where eighteen actual measurements per participant were available, a span of 0·2 was used. For the continuous AGD where 240 measurements per participant were available, a span of 0·1 was used. This small but wider than expected bandwidth was necessary to reduce the impact of occasional obvious outliers. The use of these relatively small smoothing spans means that smoothed values are very close to the observed values since locally weighted scatterplot was used to interpolate rather than smooth. Altering the selected spans (within the preset parameters) used in the analysis had no substantial impact on the interpolated profiles. R code for the smoothing and individual plots is available on request as supplemental material.
Bland–Altman plots were produced for each pair of measures, and Kendall's W, a non-parametric measure of concordance, was computed for each pair and to examine the concordance of all three measures.
Time to peak was determined for each participant as the time (min) to maximum glucose concentration from the commencement of consumption of the oral glucose load. Bland–Altman plots were also produced for each pair of measures for time to peak (by plotting the average of the two measures against the difference between the two measures).
Pearson's product moment correlation coefficients were calculated to examine the relationship between time to peak and time to return to 75 and 50 % of peak glucose values for each method with BMI, percent body fat and HOMA-estimated insulin resistance.
Results
The interpolated curves for each measure on each participant were averaged across subjects (see Fig. 1). This shows the rise and fall in glucose measured by each method before, during and after the OGTT. Analysis of time to peak glucose indicated that the AGD measures lagged approximately 15 min behind the FP (mean difference 14·67 (sd 10·06)) and AV (mean difference 14·73 (sd 6·16)) measures (Table 2). The CI for time to peak in capillary data is wider than for the other measures since fewer capillary measures were taken in total. A one-way ANOVA with measure (AGD, AV and FP) included as the within-subjects variable showed that there was a significant difference in the mean time to peak (F(2,28) = 23·42, P < 0·001). Time to peak was significantly different for the AGD compared with AV (P < 0·001) and FP measures (P < 0·001), while AV and FP measures showed no difference in time to peak using Bonferroni-corrected post hoc tests.

Fig. 1 Smoothed aligned mean (with corresponding standard error) glucose for each method (n 15) (![]() , AV (arterialised venous);
, AV (arterialised venous);![]() , FP capillary;
, FP capillary; ![]() , AGD interstitial). OGTT, oral glucose tolerance test.
, AGD interstitial). OGTT, oral glucose tolerance test.
Table 2 Mean time (min) to peak and time to return to 75 and 50 % and number of subjects returning to 75 and 50 % within the test period for each measurement method
(Mean values and standard deviations)
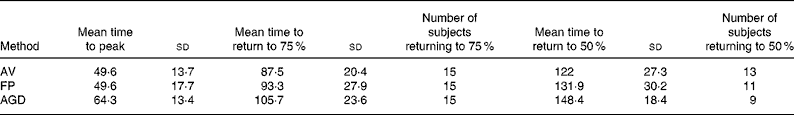
AV, arterialised venous; FP, finger prick; AGD, ambulatory glucose-monitoring device.
A significant main effect of measurement method was found for difference in time to return to 75 % of peak glucose (F(2,28) = 8·249, P < 0·01). AGD measures took significantly longer to return to 75 % of max levels than AV (P < 0·001), but neither method was significantly different to FP. While all subjects returned to 75 % of maximum glucose levels during the 180-min measurement period, a number of subjects did not return to 50 % of their maximum glucose value during the test period. Thirteen subjects returned to 50 % of their maximum AV glucose value within the test period, while the corresponding number of subjects for AGD was nine and for capillary glucose was eleven. Time to return to 50 % of maximum glucose levels also differed significantly between the measurement methods (F(2,14) = 18·4, P < 0·001). Only eight participants returned to 50 % on all three methods. The AGD was slower than AV (P < 0·001) and FP (P < 0·01) in time to return to 50 % of maximum glucose.
Percent body fat was reasonably correlated with time to peak glucose measures for each method (AV: r 0·689, P < 0·01; AGD: r 0·743, P < 0·01; FP: r 0·520, NS), while BMI did not in this sample. HOMA estimates of insulin resistance were not correlated with time to peak, time to 75 or 50 % for any glucose measurement method. The time to peak according to AV, FP and AGD was significantly intercorrelated (smallest r 0·750, P < 0·01).
Figs 2–4 were produced using Mander's(Reference Mander17) variation of Bland–Altman's method(Reference Bland and Altman18). Fig. 2 compares glucose measurements using AV and FP and shows that differences between the measures increase with increasing level of circulating glucose. For all measurements in the highest quintile, the FP measures were higher than the venous measures, but otherwise FP measures were not consistently higher or lower than AV.
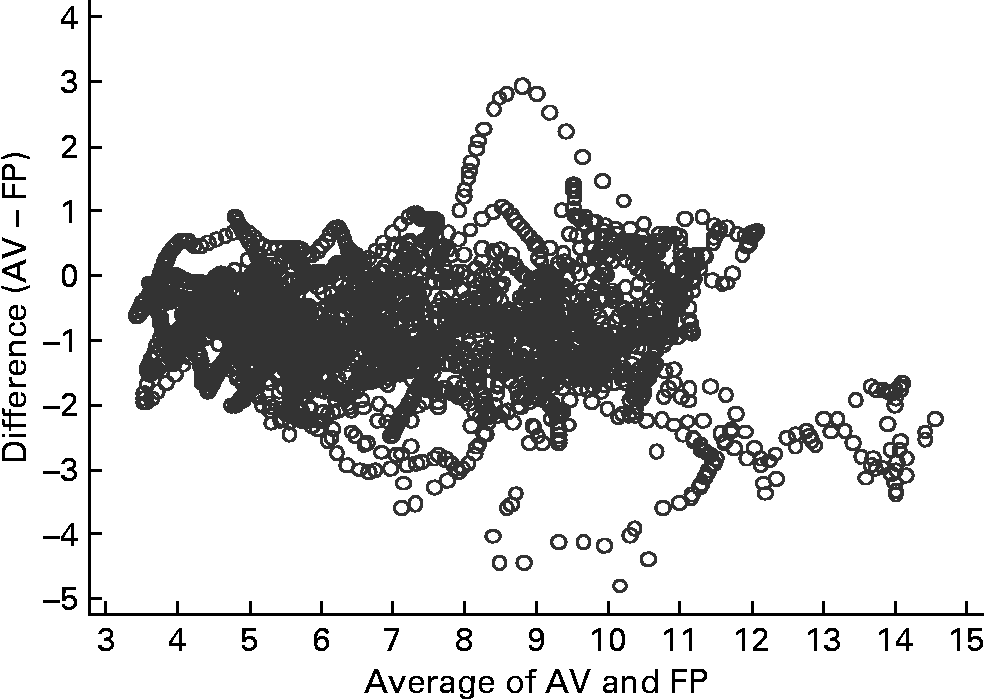
Fig. 2 Bland–Altman plot for capillary (finger prick – FP) and arterialised venous (AV) samples (n 15). The Bland–Altman plot illustrates the difference between the two measures (y-axis) plotted against the mean of the two measures (x-axis).
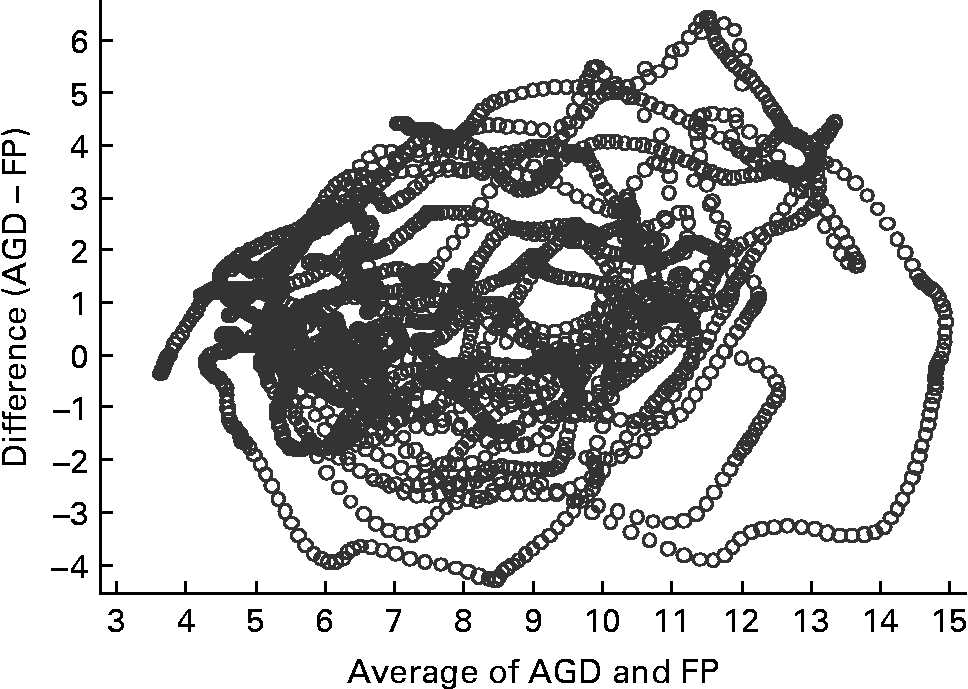
Fig. 3 Bland–Altman plot for capillary (finger prick – FP) samples and an ambulatory glucose-monitoring device (AGD) (n 15). The Bland–Altman plot illustrates the difference between the two measures (y-axis) plotted against the mean of the two measures (x-axis).
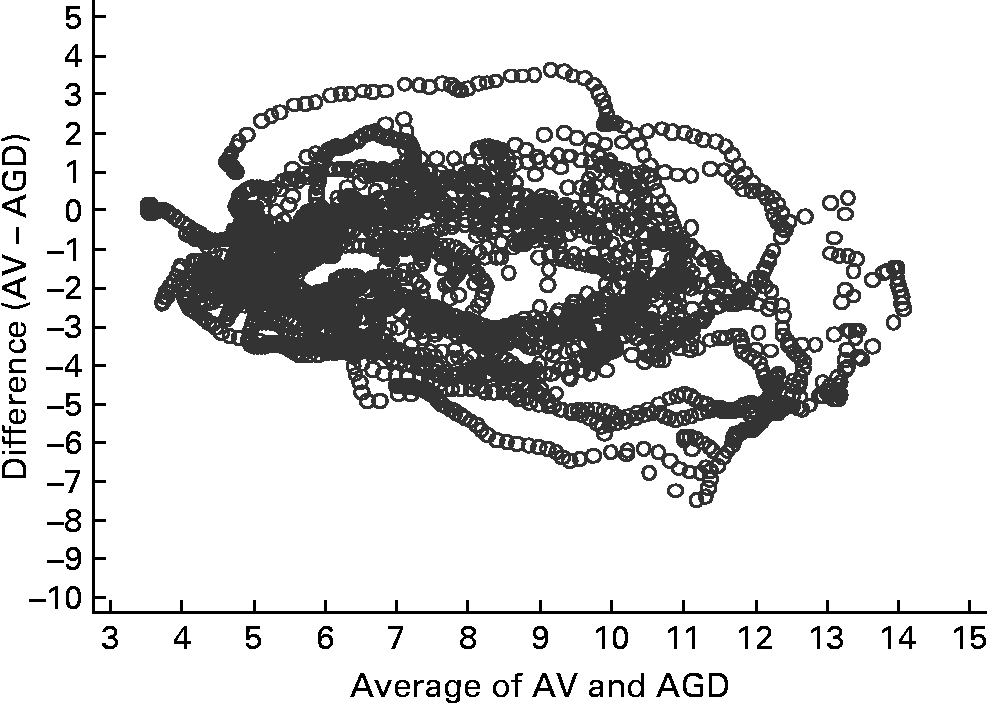
Fig. 4 Bland–Altman plot for arterialised venous (AV) samples and an ambulatory glucose-monitoring device (AGD) (n 15). The Bland–Altman plot illustrates the difference between the two measures (y-axis) plotted against the mean of the two measures (x-axis).
Figs 3 and 4 compare glucose measurements using capillary blood and AV plasma with the AGD. The pattern is similar for both comparisons. There was a trend for a positive difference between the measures such that AGD produces higher values than capillary especially in the presence of greater glucose concentrations. A similar positive trend is apparent for AV plasma, although values are more evenly distributed at higher glucose concentrations. Concordance between the three measurement methods was strong (Kendall's W = 0·8771, n 15, P < 0·001). Concordance was greater between AV and capillary measures (W = 0·9696) than AGD and AV (W = 0·8770) or AGD and capillary measures (W = 0·8764).
Discussion
The main aim of the present study was to examine the relationships between the glucose profiles in response to an OGTT generated by AGD, AV and FP measurement methods in non-diabetic subjects. Three profiles were generated for each participant; interstitial glucose (AGD), glucose in arterialised blood (AV) and glucose in capillary blood (FP). There was good correspondence between the three curves and concordance measures indicated significant relationships between them. A strong correlation of a similar magnitude to the present study was reported between interstitial glucose measured by the same device and venous glucose in a study of seventy patients with either type 1 or type 2 diabetes(Reference Maran, Crepaldi and Tiengo1).
The three curves clearly shared some common characteristics of a baseline run-in, an initial rapid rise following the glucose intake and then a slower return to baseline. In order to compare these profile curves, it was necessary to match the timings of the initial rise in measured glucose between the three methods, intra-subject, to overcome any lag in glucose response between the measures. This lag (time to peak) is an interesting characteristic of the relationships between the measures, and so its intersubject variability was assessed for consistency. There was a good correspondence between AV and FP time to peak, but a lag of approximately 15 min was observed for the AGD. This is not surprising since the post loading rise of the interstitial glucose depends on time taken for glucose to move from the circulation into the interstitial fluid in the proximity of the sensing membrane in the subcutaneous tissue of the abdominal wall.
There is no direct method to sample interstitial glucose. Here, as in other studies, microdialysis was used to determine glucose levels. Manufacturer's guidelines suggest a 3-min adjustment, to allow for the time taken for the perfusion fluid to leave the patient and reach the biosensor, should be made when calibrating the Glucoday® against capillary glucose measures. This instrument delay takes into account the volume of the transported perfusion fluid, the flow rate and the time needed to receive the sensor signal(Reference Maran, Crepaldi and Tiengo1, Reference Poscia, Mascini and Moscone19), but does not appear to account for the time required for glucose to diffuse from blood in the capillaries through the interstitial space. The total lag, which is the sum of instrument lag and physiological lag, needs to be taken into account when assessing the effects of nutritional intake on glucose using interstitial measurement techniques. The present study suggests that the physiological lag is approximately 15 min and this reflects a number of processes. These include time taken for arterial blood to circulate to the capillary network, the movement of glucose from blood to interstitial fluid and its progress through the interstitial fluid. The lag may also be influenced by glucose uptake into cells and variation of regional blood flow into adipose tissue near the sensor(Reference Kulcu, Tamada and Reach20).
Previous studies in a variety of species and using a range of methods have suggested that lag can vary depending on whether the rise or fall in the glucose curve is considered. Overall, delays can be as much as 45 min(Reference Rebrin, Steil and Van Antwerp21). In the present study, there was good correspondence between the shape of the curves. In addition, glucose measured in capillary and AV blood did not differ in time to peak or in the elimination phase of the curves (time to 75 % and time to 50 %). This suggests that with appropriate correction for lag, interstitial glucose measures could feasibly be used to indicate delivery of glucose to the tissues and brain in non-diabetic people.
The response to glucose load results in a complex curve with a number of characteristics. From Fig. 1, it appears that not only did the AGD values peak later but also the peak appears slightly higher. Since the timing and maximum height of the peak vary between subjects, it is difficult to robustly test differences in the mean peak values. The higher peak noted on the AGD may relate to the method of calibration of the AGD i.e. against FP, such that AGD values are dependent on FP values.
Insulin resistance could be an important factor in explaining the amplitude of the peaks and troughs in the glucose profiles resulting from the oral glucose load. HOMA estimates of insulin resistance indicated that the overweight subjects recruited to the present study were relatively healthy and none showed evidence of clinically relevant insulin resistance i.e. mean HOMA was 0·82 (range 0·4–1·6), where 1 is considered normal insulin sensitivity in this age group. The subjects did not show evidence of impaired glucose tolerance. Only one subject had not returned to below 7·8 mmol/l at 2 h based on AV glucose measurement. Although a large proportion of the sample did not return to 50 % of maximum levels within the test period on the AGD and FP measures, all had returned to 50 % according to the AV measure. This could have implications for the diagnosis of impaired glucose tolerance using capillary or interstitial measures.
Having matched the profiles temporally, we employed Bland–Altman's methods to assess the difference and concordance of the three different glucose measurement techniques. The Bland–Altman plots of the profile differences demonstrated some discrepancies between the methods. If the measures were effectively giving the same information, we would expect these plots to be randomly scattered, with small deviation, about a mean of zero. In some circumstances, there were indications of non-randomness and the positive differences observed suggested that the greatest lack of concordance occurred at higher glucose concentrations. Nevertheless, over the course of the test period in response to the glucose load, this sample of overweight men, in whom we anticipated and observed glucose excursions of reasonable magnitude, showed good concordance between the three measures.
Previous studies, which aimed to validate the use of interstitial glucose monitors, have employed the continuous glucose–error grid analysis technique described by Kovatchev et al. (Reference Kovatchev, Gonder-Frederick and Cox23) to assess the consistency of the temporal, clinical accuracy of the measures. Although the continuous glucose–error grid analysis is a helpful clinical classification tool, it has predominantly been used to compare clinical accuracy in hypo- and hyperglycaemia(Reference Clarke, Anderson and Farhy24). In the euglycaemic range, continuous glucose–error grid analysis analyses of continuous glucose monitors have estimated accuracy to be 71–89 % from studies of patients with type 1 diabetes (Clarke error grid A zone)(Reference Clarke, Anderson and Farhy24, Reference Wienstein, Schwartz and Brazg25). These studies and others, which correlate two methods over a range of values, often report high correlations between the measures. However, under such circumstances, a high correlation is ‘almost guaranteed’(Reference Bland and Altman26).
In order to assess the utility of continuous interstitial glucose monitoring for research examining nutrition behaviour relationships, we wanted to select a sample in whom glucose excursions were likely to be accentuated, but who were not diabetic. The sample recruited was representative of the general (overweight and middle aged) population in whom these techniques might be employed to examine effects of nutritional intervention on health outcomes(Reference Brynes, Adamson and Dornhorst4). Frequent or sustained glycaemic excursions are associated with the development of impaired glucose tolerance, diabetes and macrovascular disease(Reference Jarrett, McCartney and Keen27). It could be argued that the results obtained on this sample have limited generalisability. However, this group is likely to be the target for intervention and not dissimilar in terms of BMI to average males in this age group in the UK. Our sample also showed a mean HOMA of 0·82, reflecting their normal insulin resistance(Reference Levy, Matthews and Hermans28, Reference Matthews, Hosker and Rudenski29). Further research could examine the concordance between the methods of glucose measurement described here in other samples.
AV glucose measurement is considered the gold standard method(Reference Liu, Moberg and Kollind7), and is related to glucose delivery to the brain with a similar delay but lower amplitude(Reference Nielson, Djurhuus and Gravholt22). Capillary measures are practicable but can only be performed relatively infrequently, and hence important alterations in circulating glucose, which can be detected by continuous interstitial monitoring, may be missed. However, accurate correction for the time lag and information on its variability is essential if we are to draw conclusions about the physiological profile of food ingested, subjective state or glucose delivery to the brain and any impact this might have on the activities such as hunger perception or cognitive function.
In conclusion, continuous ambulatory glucose measurement using the Glucoday® is a reasonable method to assess blood glucose, provided that adjustment is made for the not insubstantial physiological time lag observed.
Acknowledgements
We are grateful for the donation of AGD consumables from Menarini and for the performance of venous glucose and insulin assays by Unilever. There are no conflicts of interest on the part of any of the authors. The study was designed by L. D., C. L. and M. M., conducted by N. L. and L. M. with input from L. D. and M. M. F. C. designed the meals. D. T. and H. C. performed the assays and L. D. and R. S. performed the data analysis. The manuscript was written by L. D., C. L. and M. M.


