INTRODUCTION
Many studies have been performed to investigate the possible associations between climate and respiratory viruses, especially with respiratory syncytial virus (RSV) [Reference Reyes1–Reference Noyola and Mandeville11], severe acute respiratory syndrome (SARS) [Reference Tan12, Reference Yuan13], and influenza [Reference Urashima, Shindo and Okabe14–Reference Alonso16]. In particular, with influenza epidemics and pandemics, the effect of solar events, such as sunspots has also been explored [Reference Yeung17], together with a related factor, vitamin D deficiency, that may weaken human host immunity making people more susceptible to influenza infection [Reference Cannell18].
However, despite all of these studies, there is still no clear-cut relationship that can be applied, worldwide, between respiratory virus incidence and climate and it may be that the relationships do indeed differ between countries with different types of climate which in turn depends on the latitude of these countries (e.g. temperate, subtropical and tropical). Two examples using different respiratory viruses (RSV and influenza) will illustrate these problems more clearly.
Many studies from different countries have been performed on RSV, demonstrating varying and sometimes contrasting results [Reference Weber, Mulholland and Greenwood19, Reference Stensballe, Devasundaram and Simoes20]. For example, RSV incidence has been shown to increase with rising temperature in some studies, e.g. from Singapore [Reference Chew2], Hong Kong [Reference Chan3] and Indonesia [Reference Omer10], but with decreasing temperatures in others, e.g. from Malaysia [Reference Chan4], Argentina [Reference Viegas5], Spain [Reference Lapeña6] and Mexico [Reference Noyola and Mandeville11]. Other studies have found that RSV incidence peaked at two (low and high) temperatures, 2–6°C and 24–30°C (in various cities in USA, Mexico, India, Chile and Canada) [Reference Yusuf8, Reference Welliver9]. Other studies, for example, one from Sweden, found no relationship with temperature [Reference Reyes1]. From these multiple and diverse studies from different parts of the world, it seems that a positive correlation between increased RSV incidence and temperature seems to occur more commonly in subtropical/tropical climates like those in Hong Kong and Singapore, whereas the opposite correlation tends to be found in more temperate countries.
Similarly, the relationship between RSV incidence and relative humidity (RH) varies between studies, being positively correlated in some [Reference Chan3, Reference Viegas5, Reference Omer10], but negatively correlated in others [Reference Chew2, Reference Lapeña6, Reference Yusuf8, Reference Welliver9].
In contrast to RSV, there have been relatively few incidence-climate studies performed on influenza. One study from Singapore (using monthly data) found that there was no consistent relationship between influenza A outbreaks and the climate variables examined (rainfall, temperature, wind speed, solar radiation and RH), although influenza B incidence was positively correlated with rainfall [Reference Chew2]. A study from Japan found that weekly influenza incidence increased with colder weather (i.e. when there were fewer days with temperatures ⩾10°C) and with lower RH (i.e. when there were more days of RH <60%) [Reference Urashima, Shindo and Okabe14]. Yet, a study from Buenos Aires, Argentina (also a relatively temperate country), showed that influenza A incidence peaked in the coldest, dampest months, being negatively correlated with mean monthly temperature and solar UVB radiation, but positively correlated with mean monthly RH [Reference Viegas5].
In terms of methodology, statistical methods used to study the association of respiratory virus, including influenza and RSV, and climate have included correlation coefficients or liner regression techniques [Reference Reyes1, Reference Chan3, Reference Viegas5–Reference Urashima, Shindo and Okabe14] and time-series analysis [Reference Chew2, Reference Chan4]. Correlation coefficient or linear regression techniques require independent and identically distributed data. Time-series ARIMA (autoregressive integrated moving average) models, on the other hand, explicitly model the temporal dependence structure of a time series. ARIMA models have been shown to be more accurate than those obtained by the traditional regression methods [Reference Choi and Thacker21, Reference Choi and Thacker22]. Time-series analysis has been applied in epidemiological studies of respiratory tract infections [Reference Chew2, Reference Chan4, Reference Reichert23, Reference Antunes24], and other infectious diseases like dengue [Reference Wu25, Reference Luz26] and Ross River virus [Reference Hu27].
Different time intervals have been used previously for analyses, either monthly [Reference Reyes1–Reference Viegas5], weekly [Reference Lapeña6–Reference Welliver9, Reference Noyola and Mandeville11, Reference Urashima, Shindo and Okabe14] or daily [Reference Omer10, Reference Tan12, Reference Yuan13]. Daily and weekly data series tend to fluctuate whilst the aggregated monthly data in contrast tend to be less noisy, allowing the trend and seasonality of a time series to be more visible.
This study aims to examine and understand the effect of climate factors on the seasonal incidence of influenza A, B and RSV in the subtropical climate of Hong Kong. Respiratory virus incidence data from children hospitalized for respiratory illness was analysed with climate data obtained from the Hong Kong Observatory (HKO). The elucidation of any underlying relationship between seasonality and respiratory virus incidence may assist hospital services' planning for paediatric admissions.
MATERIALS AND METHODS
Source of data
The number of laboratory-confirmed influenza A and B and RSV paediatric respiratory infections occurring between May 2000 and December 2007 was obtained from positive viral culture or direct, specific immunofluorescent (IF) staining of the original clinical sample (nasopharyngeal aspirates; NPAs) obtained from patients admitted to paediatric or neonatal units of any hospital in the Hong Kong New Territories East Cluster (NTEC, comprising: the Prince of Wales, Alice Ho Ming Nethersole, North District, Sha Tin and Tai Po hospitals).
Paediatricians routinely test for various respiratory viruses when children are admitted with respiratory illness in these hospitals. On admission the children are usually screened using a panel of respiratory viruses (including each or all of influenza A, B and RSV as well as other viruses). They can request testing for individual viruses, as clinically indicated.
Paediatric data were used for several reasons. First, children hospitalized for respiratory virus illness in Hong Kong routinely have a respiratory sample (usually a NPA) taken for diagnostic testing to identify the causal agent. Therefore, such samples are available in abundance from the routine clinical management of such cases. In contrast, adults presenting with respiratory illness are less likely to have a respiratory sample taken for diagnostic testing. This is probably because respiratory virus infections in children, in the absence of any pre-existing immunity or previous exposure, are more likely to cause serious clinical illness than in adults who have had a much longer lifetime exposure to such pathogens and will have built up considerably more immunity/cross-immunity to such seasonal viral infections.
Another advantage of using samples from children is that (in contrast to adults) they are more likely to have acquired their infection locally, rather than from overseas, since most children in Hong Kong usually stay near their homes and do not travel long distances overseas where they may be infected by more foreign viral strains.
For influenza A, routine diagnostic testing does not distinguish between particular subtypes, although they were mainly H1N1 or H3N2 during this period. Serology testing is not routinely performed on paediatric patients admitted for respiratory illness at any of these hospitals.
The monthly Hong Kong climate data (temperature, RH, rainfall, % cloud cover and solar radiation) for this period (2000–2007) was obtained from the HKO's publicly available website (http://www.hko.gov.hk/wxinfo/pastwx/extract.htm).
It has been suggested recently that absolute (as oppose to relative) humidity measurements may correlate more closely with influenza virus transmission and survival in an experimental laboratory setting with an animal model for influenza infection [Reference Shaman and Kohn28]. This may also imply that absolute humidity may be a better correlate of seasonal influenza incidence in humans than RH. Hence, in this study, we have also examined the correlation between absolute humidity and incidences of seasonal human influenza A and B, and RSV infections.
As described in Shaman & Kohn [Reference Shaman and Kohn28], vapour pressure was used as the measure of absolute humidity for this analysis. Vapor pressure (e) can be calculated from temperature and RH using the following equations:
and
where e s(T 0)=saturation vapour pressure=6·11 mb at temperature T 0=273·15 K; L is the latent heat of evaporation for water=2·27 MJ/kg; R v is the gas constant for water vapour=461·5 J/(kg.K); T 0 is the reference temperature=273·15 K; T is temperature in K; and RH is relative humidity.
Data analysis
The monthly percentages of positive samples were analysed. Time-series plots of the monthly positive samples for all viruses were performed to examine the seasonality, trend and peaks of these viral infections. Monthly series was used in the study because it tends to be less noisy than the weekly series due to the increased incidence data density, allowing the associations between the influenza incidences and climate variables, if any, to become more easily detectable.
Multivariate time-series analysis was conducted to study the effect of meteorological factors (including vapour pressure) on the incidence of influenza A, influenza B and RSV (for 7 years of data collected during 2000–2007). Time-series analysis uses Box–Jenkins ARMA (autoregressive moving average) models which predict the value of the target variable with a linear function of lag values (autoregressive part) plus an effect from recent random shock values (moving average part). Time-series model requires stationary series data. If the mean or variance of a time series increases or decreases over time, the series may need to be transformed using differencing. A visual inspection of the time-series plot is the most useful approach [Reference Hu27].
For each respiratory virus, a time-series model of monthly positive percentages was developed following the Box–Jenkins method. The monthly climate factors were then included in the model as explanatory variables. The selection of the explanatory variables was performed based on a backward approach. The model selection was conducted with Akaike's Information Criterion (AIC). The lower the AIC, the better the model fit. All analyses were performed with SAS/ETS version 9 (SAS Institute, USA). A P value of <0·05 was considered to be significant.
RESULTS
The incidences of influenza A, B and RSV are shown in Table 1, demonstrating the increase in the number of respiratory samples received for testing after the 2003 SARS outbreaks. Prior to 2003, the number of samples tested for influenza A, B and RSV was relatively similar for each year. The ~30% increase in the number of samples tested for all of these viruses during 2002 may have been due to more severe respiratory disease being seen during the 2002 influenza season due to the emergence of the new Fuji/411/02-like viruses at that time that were less well matched to the contemporary influenza vaccine [Reference Ritzwoller29–Reference Tang33].
Table 1. Average number of samples received for testing per month for each year (proportionally, for May 2000–December 2007), showing an increasing number after the 2003 severe acute respiratory syndrome outbreaks in Hong Kong
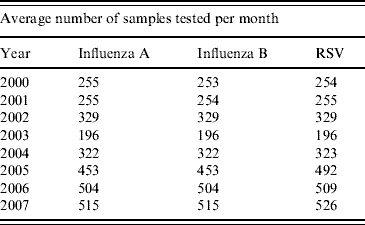
RSV, Respiratory syncytial virus.
A summary of the monthly statistics for the climate variables for Hong Kong (May 2000–December 2007) are given in Table 2. A plot of the monthly average of these climate variables over the study period is shown in Fig. 1. In Hong Kong, the average temperature is highest during July–August (average 30°C), whilst it is coldest during January (average 15–16°C). RH tends to be lower in winter (60–70%) and higher in spring and summer (80–90%). Absolute humidity, as measured by vapour pressure, seems to be closely associated with average temperature. Heavy rainfall occurs more often during the summer with typhoons being frequent in most years during this period also. Amount of cloud is highest in spring (average 75–80%) and lowest towards the end of the year (average 50–55%). Solar radiation is highest in July (average 17 MJ/m2) and lowest in January to March (average 10 MJ/m2).
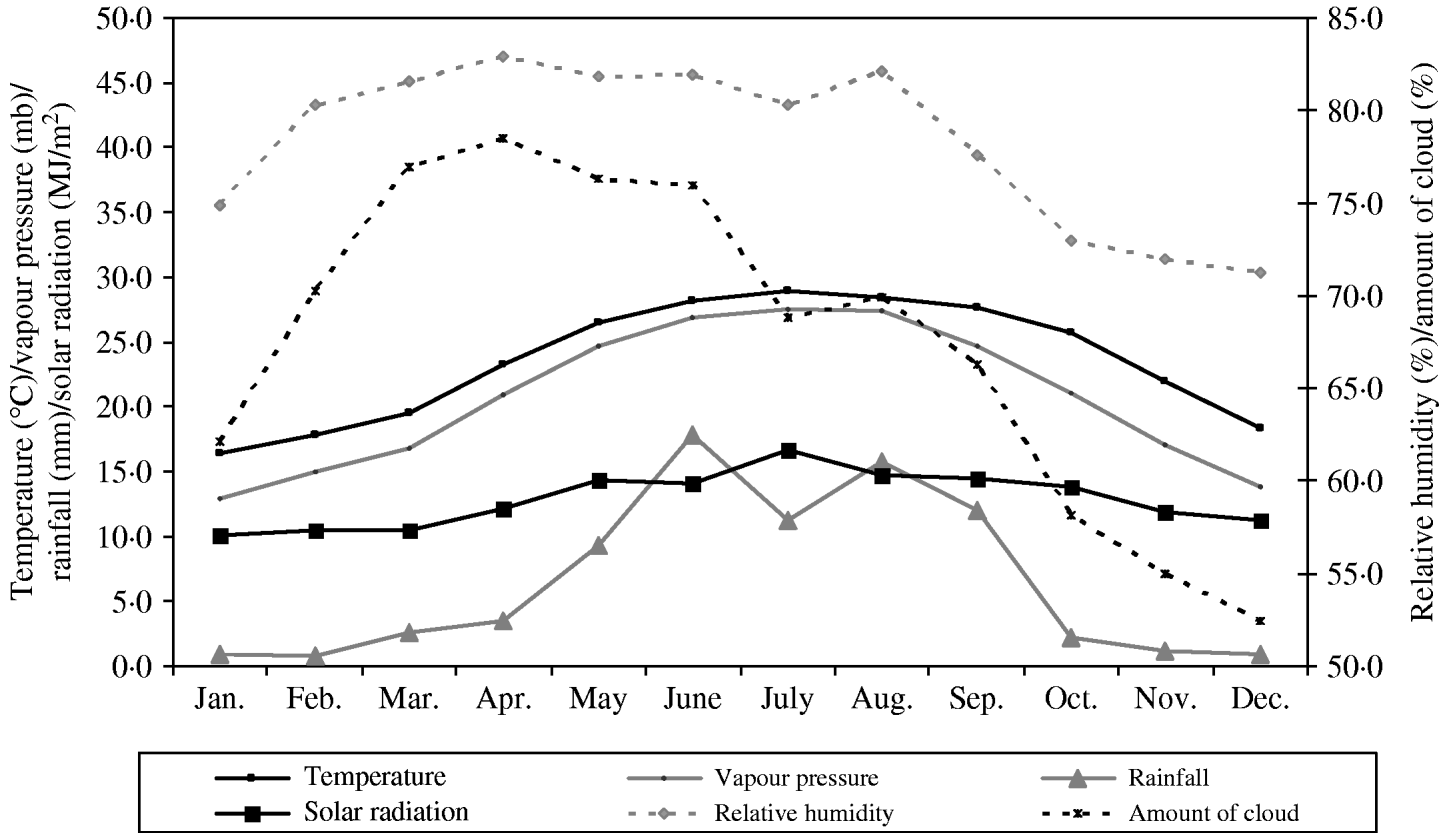
Fig. 1. Monthly average of various climate parameters: temperature, vapour pressure, rainfall and solar radiation (solid lines, left axis), and relative humidity and relative amount of cloud cover (dotted lines, right axis) in Hong Kong over the period of May 2000 and December 2007.
Table 2. Summary of monthly statistics for meteorological variables in Hong Kong during May 2000–December 2007

Time-series plots of the monthly percentages of positive samples for influenza A, B and RSV are shown in Figs 2–4. Visual inspection of the plot of these series showed no increasing or decreasing trends over years. There appeared to be annually recurring peaks for influenza A, B and RSV. The peaks of influenza A incidence are actually double peaks in many years, typically the first peak in February–April and the second peak in June–July. The incidence of influenza B in Hong Kong was generally low. The amplitude of the peaks were generally about ⩽5% of the total number of samples tested, although in one year 2006, it rose as high as 11%.
There was near zero incidence for most of 2003, some of this may have been due to the reallocation of resources to deal with the 2003 SARS outbreaks in Hong Kong, although testing for influenza A mostly continued during this period. Influenza B also exhibited double peaks like influenza A, with a first peak occurring during February–March and a second peak in July–August. The seasonality of RSV follows that of influenza A closely, with double peaks in most years occurring just after and overlapping with those of influenza A, in March–May and July–August. This pattern is seen particularly well during 2004–2007.
Visual inspection of the plot of the series show that the positivity of influenza and RSV and their variations do not increase or decrease significantly over many years, thus differencing of the series was not needed. The resultant time-series analysis models for influenza A, B and RSV are shown in Table 3.
Table 3. Multivariate time-series models for influenza A, B and respiratory syncytial virus (RSV) (May 2000–December 2007)
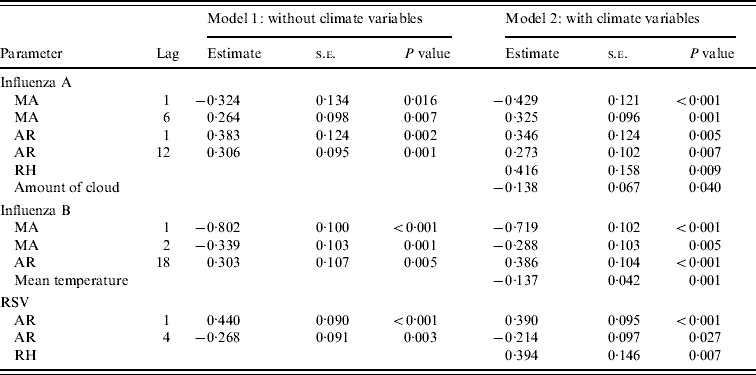
MA, Moving average; AR, autoregressive; RH, relative humidity; AIC, Akaike's Information Criterion.
Influenza A (model 1: AIC=565·6; model 2: AIC=562·4).
Influenza B (model 1: AIC=324·9; model 2: AIC=318·2).
RSV (model 1: AIC=599·7; model 2: AIC=595·0).
The time-series model shows that influenza A was found to be a time-series process with moving average (MA) terms at lags 1 and 6 and autoregressive (AR) terms at lags 1 and 12 with RH (P=0·009) significantly correlated with influenza A incidence (Fig. 2). By inspection, the peaks of influenza incidence can be seen to more or less follow the peaks of RH in Hong Kong.
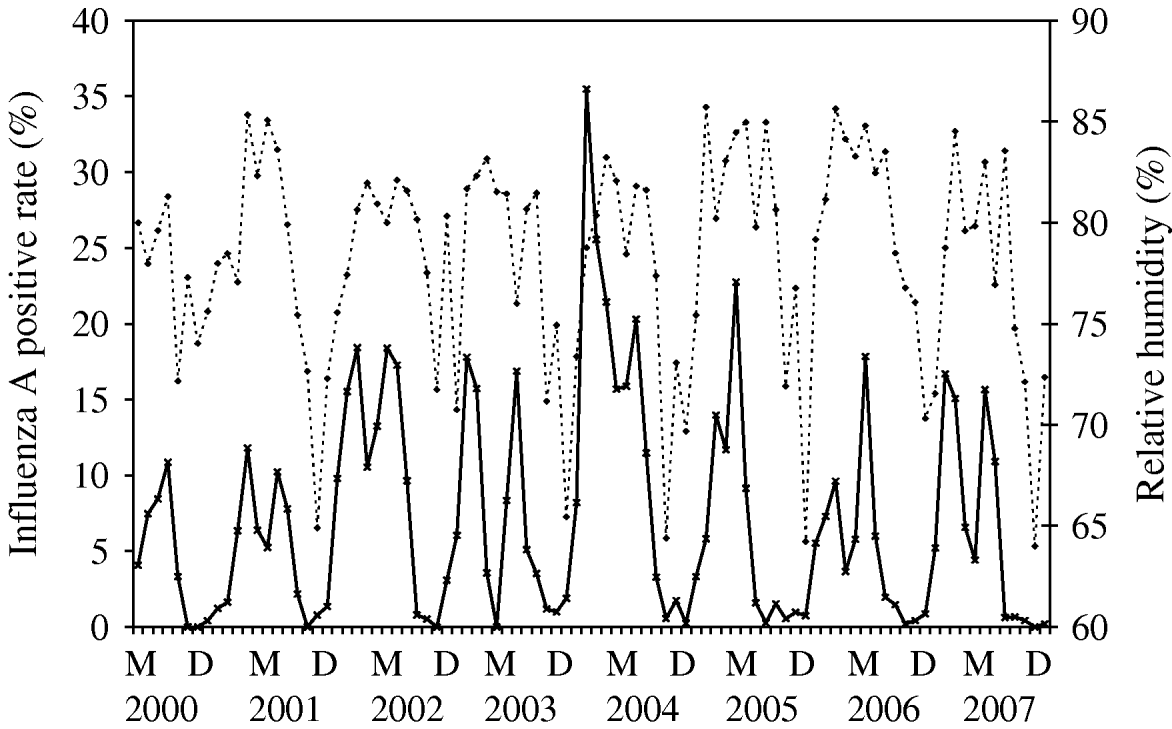
Fig. 2. Relative humidity (·····) against influenza A incidence (–––), showing the positive association between these two variables, as demonstrated by multivariate time-series analysis [May (M) 2000–December (D) 2007].
For influenza B, it can be modelled as a time-series process with MA terms at lags 1 and 2 and an AR term at lag 18 and the average temperature (P=0·001) was significantly negatively associated with influenza B incidence (Fig. 3). It can be seen that the temperature variation is remarkably cyclical throughout the year with a relatively constant period in Hong Kong. Influenza B peaks tend to follow the troughs of these temperature cycles, although this is less easy to discern by inspection alone.
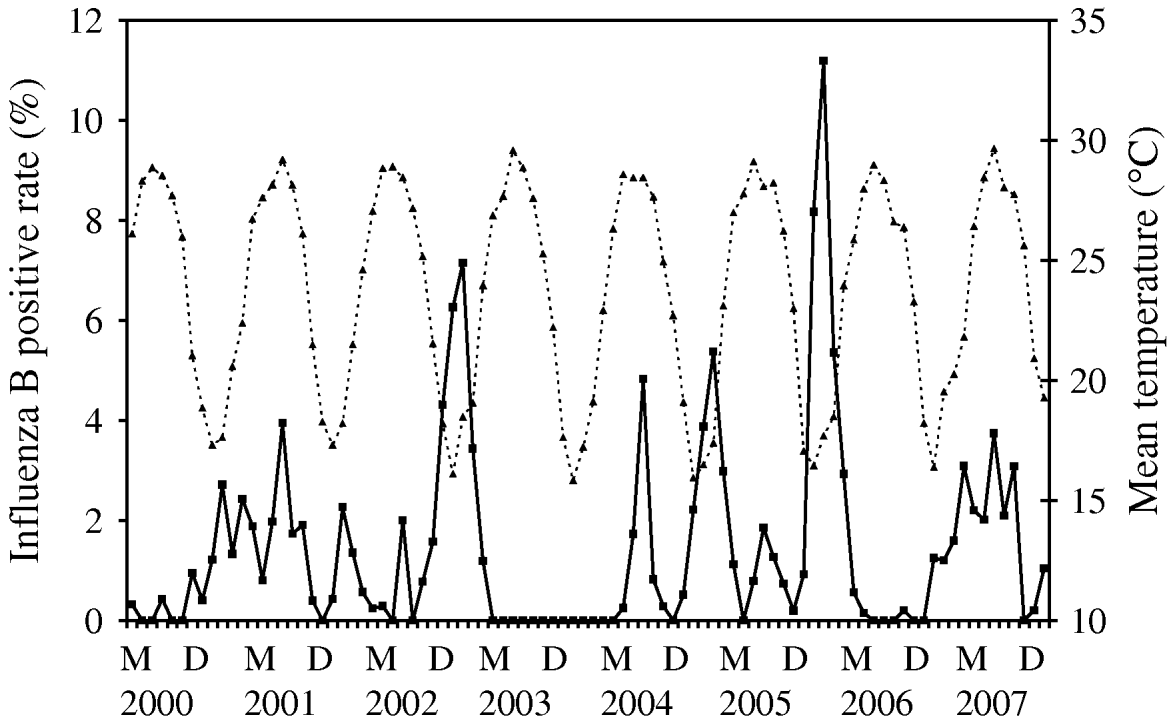
Fig. 3. Mean temperature (·····) against influenza B incidence (–––), showing the negative association between these two variables, as demonstrated by multivariate time-series analysis [May (M) 2000–December (D) 2007].
For RSV, it was a time-series process with AR terms at lags 1 and 4 with RH (P=0·007) significantly positively associated with RSV incidence (Fig. 4). The cycling of RH in Hong Kong is relatively predictable, although with more variation than temperature, both in periodicity and amplitude. The peaks of RSV incidence tend to coincide with the peaks in RH.
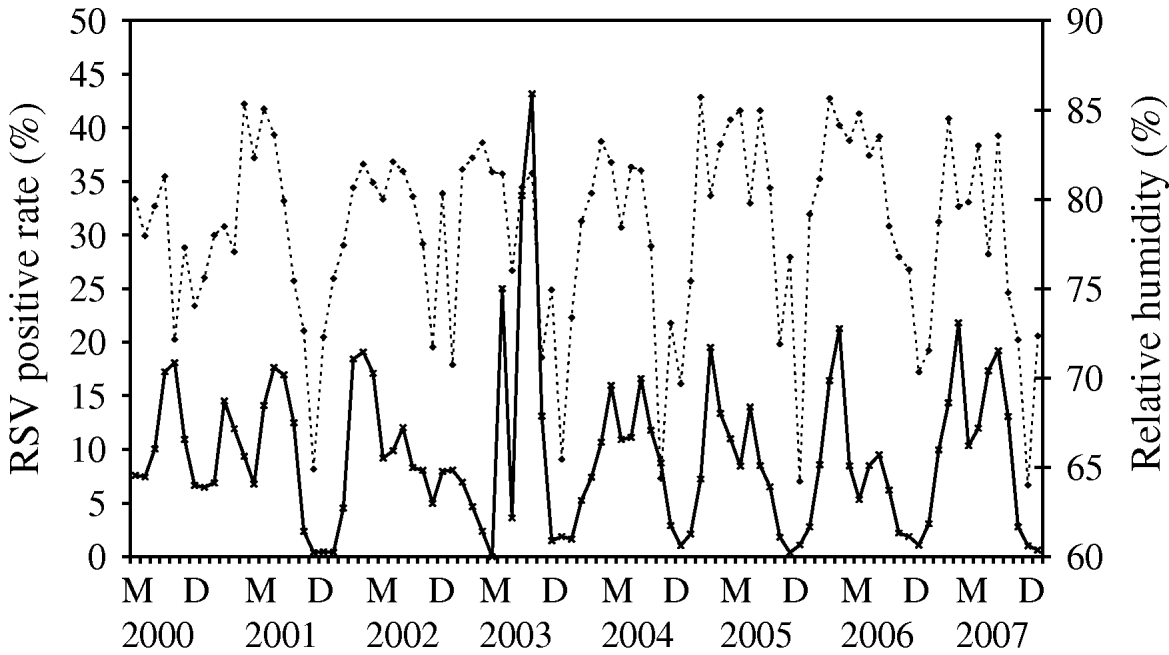
Fig. 4. Relative humidity (·····) against respiratory syncytial virus (RSV) incidence (–––), showing the positive association between these two variables, as demonstrated by multivariate time-series analysis [May (M) 2000–December (D) 2007].
For all these viruses, the addition of the climate variables into the model was justified by a smaller AIC. The model with the climate variable(s) was a better fit than the one without. The χ2 test showed that the autocorrelation of the residuals at each lag was not significant, indicating that error structure of the resultant models was white noise and thus, that these models were valid.
DISCUSSION
There have been relatively few studies on the association between respiratory virus incidence and climate from subtropical/tropical countries, and this study aims to contribute further to this field. Our study showed that RH was significantly positively correlated with the positivity of influenza A and RSV whilst temperature was negatively correlated with the positivity of influenza B in Hong Kong. Amount of cloud cover, solar radiation and rainfall were not significantly correlated with any virus incidence.
Respiratory infections are a significant burden in children, but they may also be the age group where such a burden has been best documented. With the current concerns about a possible influenza pandemic, the well-established, routine diagnostic testing for respiratory viruses in children may well prove to be invaluable in detecting the first cases of a new pandemic influenza virus strain. As explained earlier, respiratory sampling and diagnostic testing is more common for paediatric admissions, as demonstrated in the majority of the studies cited [Reference Reyes1, Reference Chan3–Reference Lapeña6, Reference Omer10, Reference Noyola and Mandeville11].
Some of the findings from this Hong Kong study are similar to others. For example, the increase in influenza A incidence with rising RH has been reported in at least one previous study from a more temperate country (Argentina) [Reference Viegas5]. Similarly, the increased incidence of RSV with rising RH has been found in other studies from both temperate (Argentina) and more tropical (Indonesia) countries [Reference Chan3, Reference Viegas5, Reference Omer10]. The rise in influenza B incidence in Hong Kong with lower temperatures has also been noted in a previous study from a temperate country (Japan) [Reference Urashima, Shindo and Okabe14]. Hence, within the subtropical climate of Hong Kong certain correlations between the incidence of influenza and RSV and some climate parameters are similar to those found in temperate and more tropical countries, elsewhere.
In this study the percentage positive, i.e.
for each particular respiratory virus was used in the analysis rather than just the absolute numbers of positive samples. The main reason for using the percentage incidence in this study was to adjust the data with respect to the increased sampling strategy applied since the SARS outbreaks of 2003 [Reference Lee34, Reference Tsang35]. As a result of those outbreaks, there was a huge increase in the number of diagnostic respiratory samples taken from patients of all age groups presenting with respiratory illness in Hong Kong. The number of such samples virtually doubled after 2004 (see Table 1). Thus, using absolute numbers of positive samples or cases may have significantly distorted the pattern of respiratory virus incidence after the 2003 SARS outbreaks. In this situation for this Hong Kong data covering this particular time span (which included the 2003 SARS outbreaks), this proportional-incidence data approach was felt to be appropriate, and a number of other studies have used this approach [Reference Chew2, Reference Chan4, Reference Yusuf8]. However, this approach relies on knowing the total number of samples tested as the denominator, which may not be available, for various reasons, in all studies.
Another limitation that is common to all studies like this one is that the analysis will be limited to the samples available for respiratory virus testing. Not every individual infected with seasonal influenza or RSV at any one time will present to hospitals for testing and be included in this seasonal incidence data. Yet, despite such limitations, previous studies suggest that the relationship between respiratory virus incidence and climate parameters do differ between countries with different climates. Studies from more subtropical/tropical climates [Reference Chew2, Reference Chan3, Reference Chan4, Reference Omer10] sometimes demonstrate contradictory relationships when compared to those from more temperate regions [Reference Weber, Mulholland and Greenwood19, Reference Stensballe, Devasundaram and Simoes20]. This study also shows some similar contrasting and inconsistent findings.
Possible reasons for the relationship between respiratory virus incidence and climate variables may include how these factors affect the survival of such viruses in the environment. Such factors may act on the virus as they are passing through the air or via inanimate objects (fomites), between hosts, either as large droplets (>5 μm) travelling short distances (<1 m), or as smaller droplet nuclei (<5 μm) travelling greater distances. Many environmental factors can affect the virus, which is usually covered in saliva and/or mucus, having been exhaled, coughed, sneezed, etc. from the mouth and/or nose of an infected host [Reference Papineni and Rosenthal36–Reference Tang41].
Previous animal and laboratory studies have demonstrated that lipid-enveloped viruses, such as RSV, influenza and parainfluenza virus, survive better in cooler, less humid environments [Reference Hemmes, Winkler and Kool42–Reference Lowen45]. This is in contrast to what is observed in incidence-climate studies on human influenza in subtropical/tropical countries, including this study, where some lipid-enveloped viruses appear to show increasing incidence with rising RH (e.g. RSV) [Reference Chan3, Reference Viegas5, Reference Omer10], and rising temperature [Reference Chew2, Reference Chan3, Reference Omer10]. Again, it appears that subtropical/tropical countries contradict the animal and laboratory findings for these lipid-enveloped viruses, which may not be entirely surprising given the differences between the human and animal hosts and their environments.
However, there may be one other possible explanation for these apparent contradictory findings. In many of these subtropical/tropical countries the availability and use of air-conditioning is widespread in homes, offices, shopping malls and other indoor areas where many people gather in high densities. Air-conditioning lowers both temperature and RH, making such indoor environments more favourable for the survival of lipid-enveloped viruses, such as influenza and RSV. This enhances their viability and transmissibility, thus increasing their potential for infecting and causing respiratory disease in secondary cases [Reference Tang41, Reference Tellier46]. Further studies on the transmission of such respiratory viruses in the indoor environment are warranted to clarify this issue.
In Hong Kong, the use of air-conditioning cannot be the whole explanation for the findings in our study. Generally, during the cooler months in Hong Kong (October–April) air-conditioning is not usually required [Reference Ji47]. The first peak of influenza (during February–April) in Hong Kong occurs during these cooler months so it is less likely that air-conditioning use in Hong Kong has a significant effect on this. However, the typical second peak of influenza in Hong Kong usually occurs between June–August, when air-conditioning is required as the weather becomes very hot and humid. For this second peak, air-conditioning may play some role, as all public places (including public transport vehicles) have air-conditioning during these summer months. Therefore, Hong Kong's unusual double peak of influenza incidence may be due to a combination of favourable climate parameters for the first peak followed by favourable indoor air-conditioned parameters for the second peak (June–August). Note that in colder temperatures, a high RH can be more common as colder air becomes more readily saturated with water vapour. This degree of water vapour saturation of air at a given temperature is given by the RH (%) value.
A recent paper suggested that absolute humidity effects influenza transmission and survival more significantly than RH based on the data obtained from a recent laboratory experiment with guinea-pigs in a completely controlled environment [Reference Shaman and Kohn28, Reference Lowen44]. In the current study, therefore, we also examined the relationship between absolute humidity, using vapour pressure as a surrogate measure, and the incidences of influenza. Our data showed that vapour pressure was not significantly correlated to influenza A incidence. For influenza B incidence, its correlation with vapour pressure was found to be significant and yet the inclusion of temperature in the model is more justified because of a lower resultant AIC. The model with temperature showed an AIC of 318·2, whilst that with vapour pressure showed a higher AIC of 321·4, indicating a poorer correlation.
Although vapour pressure as a measure of absolute humidity was not significantly correlated with any of the Hong Kong respiratory virus incidences examined here, it should be noted that Shaman & Kohn [Reference Shaman and Kohn28] applied their correlation calculations in a completely different situation (i.e. the correlation of absolute humidity with the survival of airborne influenza viruses produced from infected guinea-pigs in a well-controlled laboratory environment). Moreover, it is known that many other factors may contribute to the timing and amplitude of the seasonal peaks of influenza and RSV seen in this study, such as pre-existing immunity, social distancing (particularly the timing of school terms and holidays), as well as the movement and commuting of people and viruses between Hong Kong and China and elsewhere. This study has been limited to examining the possible influence of climate on the seasonality of influenza and RSV viruses in Hong Kong.
It would also be an interesting and important topic to develop forecast models of influenza and RSV, particularly based on past climate variables. The current model, which examines the contemporaneous relationship between influenza and RSV positivity and the climate variables, may be extended to build a forecast model using time-series transfer functions.
This study has specifically focused on hospitalized children, but this has direct consequences for working parents, who may need to take time off work to look after their sick children. They may then develop the same respiratory virus infection and illness a few days later, requiring more days absent from work. Thus, sickness in children may have a more significant impact than disease in adults alone, compounding economic losses in the workplace [Reference Rothberg48–Reference Hollinghurst50].
These findings may also have further implications for public health. If such air-conditioning and related ventilation systems are found to enhance respiratory virus survival, then measures may be put in place to filter such re-circulated air in large, indoor, public venues, such as shopping malls and entertainment complexes, using similar ventilation filtration systems that are used in passenger planes [Reference Gerard51–Reference Leder and Newman53].
If such seasonal, environmental relationships between respiratory virus infection and illness can be more strongly and reliably established, hospital resource planning can be adjusted to meet these needs in healthcare facilities in areas with contrasting climates.
DECLARATION OF INTEREST
None.


