CVD is strongly associated with obesity and there is evidence that sustained weight loss has positive effects on disease risk factors (Avenell et al. Reference Avenell, Broom, Brown, Poobalan, Aucott, Stearns, Smith, Jung, Campbell and Grant2004). In general, weight loss studies of 3–6 months will be focused on weight loss as a primary outcome while studies of 6–12 months or more focus on maintenance of the early weight loss. There are few studies of 6 months duration or more to establish whether weight loss is preferentially maintained on higher protein diets (Foster et al. Reference Foster, Wyatt, Hill, McGuckin, Brill, Mohammed, Szapary, Rader, Edman and Klein2003; Brinkworth et al. Reference Brinkworth, Noakes, Keogh, Luscombe, Wittert and Clifton2004a; Due et al. Reference Due, Toubro, Skov and Astrup2004; Stern et al. Reference Stern, Iqbal, Seshadri, Chicano, Daily, McGrory, Williams, Gracely and Samaha2004; Lejeune et al. Reference Lejeune, Kovacs and Westerterp-Plantenga2005). Lejeune et al. (Reference Lejeune, Kovacs and Westerterp-Plantenga2005) showed improved weight maintenance when protein was 18 % of energy compared to 15 % in a 6-month study. However, Due et al. (Reference Due, Toubro, Skov and Astrup2004) observed that while weight loss was greater after 6 months on a higher protein diet compared to a conventional low fat diet at 6 months, this difference was not sustained at 12 months. The high protein group had a greater abdominal fat loss suggesting a long-term metabolic advantage of the diet. In a study of weight maintenance from our group of either a high protein or high carbohydrate diet, fat loss of ∼3 kg was maintained as were improvements in CVD risk factors without any effect of diet (Brinkworth et al. Reference Brinkworth, Noakes, Keogh, Luscombe, Wittert and Clifton2004a). Foster et al. (Reference Foster, Wyatt, Hill, McGuckin, Brill, Mohammed, Szapary, Rader, Edman and Klein2003) reported greater weight loss at 6 months in subjects on a very low carbohydrate, high protein, high fat diet but there was no difference at 12 months. Stern et al. (Reference Stern, Iqbal, Seshadri, Chicano, Daily, McGrory, Williams, Gracely and Samaha2004) also found that weight loss at 1 year was not different in subjects advised to follow a low carbohydrate ( < 30 g/d) compared to a conventional diet. There were differential effects such that TAG decreased more and HDL-cholestrol decreased less on the low carbohydrate diet, suggesting there may be some long-term metabolic benefits of this dietary pattern. It is thought that a high fat intake per se will promote weight gain and low fat weight loss diets are the recommended option (Astrup et al. Reference Astrup, Grunwald, Melanson, Saris and Hill2000). However, a high MUFA diet is recommended for people with metabolic syndrome and diabetes in order to avoid the TAG-increasing and HDL-cholestrol-lowering effects of low fat diets (Garg et al. Reference Garg1998). Despite this, to our knowledge there are few, if any, studies of the long-term effect of a reduced carbohydrate, high monounsaturated fat diet. Therefore the aim of the present study was to evaluate the long-term effects of, and compliance to, carbohydrate-restricted diets high in either monounsaturated fat or protein, on weight loss, body composition and risk factors for CHD in a 52-week outpatient study. We hypothesised that in the long term a higher protein intake would have beneficial effects on maintenance of weight loss and markers of CVD risk. We also hypothesised that the blood pressure fall would be greater on the high protein diet. The present study was a follow-up of a previously published short-term weight loss study which was conducted under close supervision and we did not expect, nor find, a differential weight loss under those circumstances (Luscombe-Marsh et al. Reference Luscombe-Marsh, Noakes, Wittert, Keogh, Foster and Clifton2005).
Study design and methods
Obese hyperinsulinaemic subjects (20–65 years, BMI 27–40 kg/m2), recruited by public advertisement, were included if fasting serum insulin was greater than 15 mIU/l. They were excluded if they had diabetes mellitus (on history or fasting blood sugar >7 mmol/l at baseline), a history of liver, unstable cardiovascular, respiratory or gastrointestinal disease, malignancy, or were pregnant or lactating. The study protocol was approved by the Human Ethics Committees of the Commonwealth Scientific Industrial Research Organisation and the Royal Adelaide Hospital and subjects provided informed written consent. Seventy-three subjects were randomised and thirty-eight completed the 52-week study. Baseline characteristics for these subjects are presented in Table 1.
Table 1 Subject characteristics at baseline (Mean values and standard deviations)
HMF, high monounsaturated fat, standard protein diet; HP, high protein, moderate fat diet.
Experimental protocol
In an outpatient randomised parallel-designed study subjects were prescribed energy restricted (6000 kJ) diets that were either high monounsaturated fat (HMF), 50 % of energy as fat, 76 g/d and 20 % of energy as protein (67 g/d) or high protein (HP), 40 % of energy as protein, 136 g/d, carbohydrate was restricted to 30 % of energy (110 g/d) and saturated fat < 10 % of energy in both diets. Data from the 1995 Australian National Nutrition Survey (Australian Bureau of Statistics, 1997) indicates that the usual percentage energy from protein intake is 18 % for adults and the standard protein diet was consistent with this.
Following an intensive phase of 16 weeks with visits every 2 weeks, subjects were asked to continue the same diet and were seen every 12 weeks for dietary counselling, fasting blood samples and calculation of a 3 d weighed food record collected during the week before their visit. The weighed food records were analysed using Diet/1 Nutrient Calculation software (Xyris Software 1998, Highgate Hill, Australia). At weeks 0, 28, 40 and 52, weight and resting blood pressure were measured and fasting venous blood samples taken for glucose, insulin, lipids, serum creatinine and C-reactive protein (CRP), and analysed as previously described (Luscombe-Marsh et al. Reference Luscombe-Marsh, Noakes, Wittert, Keogh, Foster and Clifton2005). Those subjects with a CRP ≥ 10 mg/l at any time-point were excluded from the analysis. The Homeostasis Model Assessment index of insulin sensitivity was calculated (fasting insulin concentration (μU/ml) × fasting glucose concentration (mmol/l)/22·5) at the beginning and end of the study. A 24 h urine sample was collected for urea/creatinine ratio, calcium and sodium excretion, deoxy-pyridinoline/creatinine and pyridinoline/creatinine, and analysed as previously described (Luscombe-Marsh et al. Reference Luscombe-Marsh, Noakes, Wittert, Keogh, Foster and Clifton2005). The 24 h urine urinary urea and urea/creatinine ratio were used to assess compliance with the high or low protein intake.
Body weight and body composition
Body weight and body composition (dual-energy X-ray absorptiometry) were measured as previously described at weeks 0 and 52 (Luscombe-Marsh et al. Reference Luscombe-Marsh, Noakes, Wittert, Keogh, Foster and Clifton2005).
Statistical analyses
Statistical analysis was performed using SPSS for Windows version 10.0 software (SPSS Inc., Chicago, IL, USA). The effect of the diet intervention was assessed using repeated-measures ANOVA for each variable, with time as the within-subject factor and diet as the between-subject factor.
Power
The study had 80 % power (α 0·05) to detect differences between groups of 3·6 kg in body weight, 0·9 kg in lean mass, 3 mIU/l in fasting insulin and 0·2 mmol/l in LDL-cholesterol. Significance was set at P < 0·05. All data are presented as means and standard deviations unless otherwise stated.
Results
Weight
Weight loss from baseline for the thirty-eight subjects who completed the study was 6·2 (sd 7·3) kg (P < 0·01 for time with no diet effect, 7·6 (sd 8·1) v. 4·8 (sd 6·6) kg HMF v. HP, respectively). Weight regain from week 16 to week 52 was 3·8 (sd 4·5) kg (P < 0·001 for time with no diet effect, 2·6 (sd 4·4) v. 4·9 (sd 4·4) kg HMF v. HP). When an intention to treat analysis was performed with baseline weight carried forward for the dropouts, weight loss was 4·1 (sd 6·7) kg (P < 0·01 for time with no diet effect). Weight at weeks 28, 40 and 52 is presented in Table 2.
Table 2 Insulin, glucose, lipids, high sensitivity C-reactive protein (hsCRP) and weight before and after weight loss† (Mean values and standard deviations)

HMF, high monounsaturated fat, standard protein diet; HP, high protein, moderate fat diet; ND, no data.
Mean values were significantly different for week 52 compared with baseline: *P < 0·05; **P < 0·01.
† For details of procedures, see p. 406.
To assess whether there were differences in weight loss if protein intake remained high at the end of the study, the group was divided by the median reported protein intake into two groups with an average intake of 75 (sd 12) g (19 (sd 3) %) and 111 (sd 19) g (23 (sd 4) %) protein. Weight loss was 6·4 (sd 6·7) kg in the low protein reporters v. 7·0 (sd 8·1) kg in the high protein reporters (NS); macronutrient intake was confirmed by urea/creatinine excretion (27·6 (sd 7·4) v. 33·9 (sd 5·8), P < 0·05).
Body composition
Twenty-five subjects attended for body composition measurements, eleven HMF (three male) and fourteen HP (five male), by dual-energy X-ray absorptiometry, at the end of the study. These subjects had a mean weight loss of 8·1 (sd 6·9) kg with a fat to lean ratio of 2·5:1 (2·1 (sd 2·7) kg lean mass and 5·2 (sd 5·5) kg fat, P < 0·001 for time, with no effect of diet.
Reported dietary intake and dietary compliance
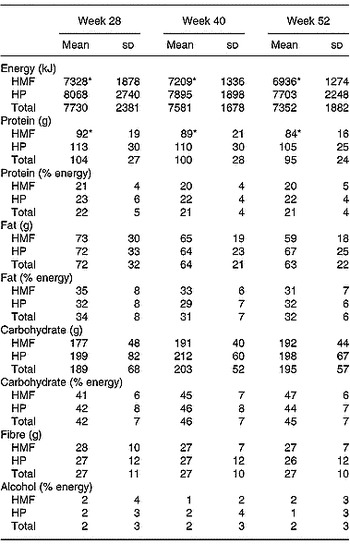
Thirty-five subjects (sixteen HMF, nineteen HP) completed 3 d weighed food records. There was no change in energy or nutrient intake with time during follow-up (Table 3). As expected, men had higher energy intakes than women throughout follow-up, 9271 (sd 2655) v. 6574 (sd 1292), 8575 (sd 1086) v. 6836 (sd 1127) and 8194 (sd 2493) v. 6721 (sd 883) kJ, men v. women at 28, 40 and 52 weeks (P < 0·001). Overall, HMF subjects reported lower energy intakes than HP at all time-points (P < 0·01) but this was a function of the higher energy intake in the men on the HP diet. Reported absolute protein intake was higher in men (117 (sd 25) v. 93 (sd 25), 113 (sd 28) v. 91 (sd 24) and 102 (sd 25) v. 90 (sd 21) g/d, men v. women at 28, 40 and 52 weeks (P < 0·001)) and remained higher overall in HP at all time-points (P < 0·001). However, there were no differences when the protein intake was expressed as a percentage of energy.
Table 3 Energy and nutrient intake of the subjects at weeks 28, 40 and 52† (Mean values and standard deviations)

HMF, high monounsaturated fat, standard protein diet; HP, high protein, moderate fat diet.
Mean values were significantly different from those of the HP group: *P < 0·01.
† For details of procedures, see p. 406.
At the end of the study saturated fat intake was 11 (sd 3) % in both groups, monounsaturated fat 12 (sd 5) HMF v. 13 (sd 3) % HP (NS) and polyunsaturated fat 5 (sd 2) % in both groups.
In those subjects in the upper half of reported protein intakes, reported energy intake was also higher (8039 (sd 2298) v. 6427 (sd 972) kJ, P = 0·01). However, despite this, weight loss was the same in both groups at the end of the study.
In a multivariate regression model predictors of weight loss at the end of the study were sex, age and reported percentage energy from protein (R 2 0·22, P < 0·05 for the whole model).
Urea/creatinine ratio
Overall, there was no difference in urea/creatine ratio between the groups at baseline (34 (sd 10) v. 42 (sd 11), HMF v. HP) or at the end of the study (28 (sd 6) v. 34 (sd 7), HMF v. HP).
Markers of bone turnover
The pyridinoline/creatinine ratio was decreased at the end of the study with no difference between groups (94·00 (sd 38·08) v. 61·45 (sd 18·84) nmol/mmol, baseline v. 52 weeks, P < 0·01). The deoxypyridinoline/creatinine ratio was also decreased (26·39 (sd 10·24) v. 16·48 (sd 6·87), P < 0·01 for time, no effect of diet).
The 24 h calcium excretion was not different at the end of the study (3·62 (sd 3·01) v. 3·80 (sd 2·74) mmol/l) with no differences between groups.
Blood pressure and urinary sodium
There was a trend for a reduction in systolic blood pressure at the end of the study (130 (sd 14) v. 127 (sd 13) mmHg, baseline v. 52 weeks, P = 0·08 for time, no effect of diet) but diastolic blood pressure was not different (73 (sd 10) v. 74 (sd 10) mmHg).
There was no difference in 24 h sodium excretion between the groups at baseline or 52 weeks (153 (sd 80) v. 177 (sd 59) mmol/24 h, baseline v. 52 weeks).
Insulin glucose and NEFA
Fasting plasma insulin was reduced at the end of the study (P < 0·01 for time, no effect of diet, 13·9 (sd 4·6) v. 10·2 (sd 5·2) mIU/l, baseline v. 52 weeks; Table 2). Fasting plasma glucose was not different (Table 2). NEFA were not different at the end of the study (332 (sd 136) v. 291 (sd 122) μmol/l, baseline v. 52 weeks). The calculated Homeostasis Model Assessment index (fasting insulin concentration (μU/ml) × fasting glucose concentration (mmol/l)/22·5) was 3·62 (sd 1·97) at baseline and fell to 2·52 (sd 1·34) at the end of the study (P < 0·01) with no difference between diets.
Lipids
At the end of the study HDL-cholestrol was higher overall with no effect of diet (1·04 (sd 0·29) v. 1·19 (sd 0·26) mmol/l, P < 0·001 for time). TAG was reduced at the end of the study (2·22 (sd 1·15) v. 1·85 (sd 1·23) mmol/l, P < 0·05 for time with no effect of diet), however, neither total cholesterol nor LDL-cholestrol were different after 52 weeks (Table 2). Lipids at 28 and 40 weeks are presented in Table 2.
C-reactive protein
There was a reduction in CRP at the end of the study with no difference between diets (3·97 (sd 2·84) v. 2·43 (sd 2·29) mg/l, P < 0·01). CRP at 28 and 40 weeks are presented in Table 2.
Discussion
The main finding of the present study was that although modest carbohydrate restriction was not maintained over the course of the study subjects maintained a 6 kg weight loss from baseline which was associated with improvements in the CVD risk markers, namely insulin, HDL-cholestrol, TAG and CRP, at the end of 52 weeks.
Maintenance of weight loss
Long-term maintenance of weight loss of similar modest amounts is associated with long-term health benefits, notably delaying the onset of type 2 diabetes (Knowler et al. Reference Knowler, Barrett-Connor, Fowler, Hamman, Lachin, Walker and Nathan2002; Lindstrom et al. Reference Lindstrom, Louheranta, Mannelin, Rastas, Salminen, Eriksson, Uusitupa and Tuomilehto2003). However, the regain of approximately 4 kg during the 9 months of follow-up suggests that the subjects had difficulty maintaining reduced energy intake following weight loss. It may be that the 3-monthly dietary counselling visits did not provide sufficient support to prevent weight regain. Longer-term studies where weight loss had been maintained include the Finnish Diabetes Prevention Study and the Diabetes Prevention Program (Knowler et al. Reference Knowler, Barrett-Connor, Fowler, Hamman, Lachin, Walker and Nathan2002; Lindstrom et al. Reference Lindstrom, Louheranta, Mannelin, Rastas, Salminen, Eriksson, Uusitupa and Tuomilehto2003). However, both of these studies had an exercise intervention and ongoing support both of which may have been beneficial in helping maintain weight loss.
High monounsaturated fat or high protein intakes were not maintained during the long-term follow-up. Due et al. (Reference Due, Toubro, Skov and Astrup2004) observed similar weight loss, 6 kg, after 12 months and maintenance of a high protein intake demonstrated by higher 24 h urinary nitrogen excretion. The groups received dietary counselling every 2 weeks despite which overall weight loss was similar to that seen in the present study. Weight after 2 years was available for a small number of subjects (n 17) in the earlier study for whom weight loss was approximately 5 kg. The authors report good dietary compliance judged by food records and urinary nitrogen excretion and a non-significant trend to greater weight loss in the high protein group. In the present study, subjects reporting higher protein intakes also reported higher energy intakes but there was no difference in weight loss when the group was divided by median reported protein intake which was confirmed by urinary urea/creatinine ratio. Lack of compliance to the dietary prescription may have been due to the diet being difficult to comply with, the length of the study or both. This has been observed previously in longer-term studies by our group and others (Foster et al. Reference Foster, Wyatt, Hill, McGuckin, Brill, Mohammed, Szapary, Rader, Edman and Klein2003; Brinkworth et al. Reference Brinkworth, Noakes, Keogh, Luscombe, Wittert and Clifton2004a, Reference Brinkworth, Noakes, Parker, Foster and Cliftonb; Due et al. Reference Due, Toubro, Skov and Astrup2004; Stern et al. Reference Stern, Iqbal, Seshadri, Chicano, Daily, McGrory, Williams, Gracely and Samaha2004). Lejeune et al. (Reference Lejeune, Kovacs and Westerterp-Plantenga2005) showed improved weight maintenance on a higher protein diet, however, the extra protein was taken in the form of a supplement which may have made compliance to the higher protein intake easier.
Body composition
Data on body composition were available only on a subset of twenty-five volunteers who attended for dual-energy X-ray absorptiometry measurement at the end of the study. Overall they had a slightly greater weight loss of approximately 8 kg because of a smaller weight regain of 1 kg, indicating that they were better able to maintain weight loss than the group as a whole.
CVD risk
We observed improvements in the CVD risk markers insulin, CRP, HDL-cholestrol and TAG, with weight loss with no different between diets. We also saw a trend for a decrease in systolic blood pressure of 7 mmHg from baseline at the end of the study. Population studies have shown a relationship between sustained reductions in systolic blood pressure of a similar amount seen in the present study (8·7 mmHg) and reduction in cardiovascular events (Froom & Goldbourt, Reference Froom and Goldbourt2004). While blood pressure in the range seen in the present study (the pre-hypertension range defined as 120–139 mm Hg systolic or 80–89 mm Hg diastolic blood pressure) is not independently associated with increased risk of CVD, however, if added to another risk factor, e.g. obesity, the risk of CVD increases (Mainous et al. Reference Mainous, Everett, Liszka, King and Egan2004).
Weight loss is associated with improvements in insulin sensitivity and markers of endothelial dysfunction in morbidly obese and moderately obese subjects (Brinkworth et al. Reference Brinkworth, Noakes, Keogh, Luscombe, Wittert and Clifton2004a, Reference Brinkworth, Noakes, Parker, Foster and Cliftonb; Vazquez et al. Reference Vazquez, Pazos, Berrazueta, Fernandez-Escalante, Garcia-Unzueta, Freijanes and Amado2005). In the present study, weight loss alone resulted in a reduction in fasting plasma insulin of 30 % and a lower Homeostasis Model Assessment index indicating that insulin sensitivity was improved by weight loss which in turn suggests an improvement in CVD risk. Lack of effect of diet type on insulin sensitivity and glucose levels during weight loss has also been reported by other workers supporting the view that weight loss per se is the strongest influence on insulin sensitivity (Johnston et al. Reference Johnston, Tjonn and Swan2004, Reference Johnston, Tjonn, Swan, White, Hutchins and Sears2006). However, Meckling et al. (Reference Meckling, O'Sullivan and Saari2004) observed improvements in insulin levels only in the low carbohydrate diet group despite weight loss of approximately 7 kg in both low fat and low carbohydrate dietary groups, suggesting that there is still some controversy in this area (Johnston et al. Reference Johnston, Tjonn and Swan2004, Reference Johnston, Tjonn, Swan, White, Hutchins and Sears2006; Meckling et al. Reference Meckling, O'Sullivan and Saari2004). At the end of the present study there was a net weight loss and reduction in insulin levels despite lack of compliance to the recommended diets. The inflammatory molecule high sensitivity C-reactive protein (hsCRP), which is an independent marker for CVD risk, was 40 % lower at the end of the study (Ridker et al. Reference Ridker, Hennekens, Buring and Rifai2000). It has been suggested that CRP should be routinely measured as part of CVD risk assessment as more than twenty prospective studies have shown that hsCRP independently predicts vascular risk and six cohort studies have reported that hsCRP adds prognostic information beyond that available previously (Ridker et al. Reference Ridker, Wilson and Grundy2004). It has also been reported that patients on statin treatment who have low CRP levels have better clinical outcomes than those with higher hsCRP levels, suggesting that reduction of hsCRP by weight loss will have a similar beneficial effect (Ridker et al. Reference Ridker, Cannon, Morrow, Rifai, Rose, McCabe, Pfeffer and Braunwald2005).
Lipids
HDL-cholestrol levels were 14 % higher at the end of the 52-week study with no effect of diet, a phenomenon we have reported previously (Brinkworth et al. Reference Brinkworth, Noakes, Keogh, Luscombe, Wittert and Clifton2004a). Increases in HDL-cholestrol are associated with reduction in cardiovascular events and a 1 % increase in HDL-cholestrol has been associated with a 3 % reduction in death or myocardial infarction (Boden, Reference Boden2000). Dattilo & Kris-Etherton (Reference Dattilo and Kris-Etherton1992) report that every kilogram of sustained weight loss is associated with a 0·009 mmol/l increase in HDL-cholestrol. By these calculations we should have seen a 0·054 mmol/l increase in HDL-cholestrol instead of which it was greater at approximately 0·15 mmol/l. The overall carbohydrate intake was moderate at approximately 45 % energy during follow-up which may have contributed to this effect (Garg, Reference Garg1998).
TAG levels remained reduced by 16 % at the end of the present study also with no effect of diet. Reduction in TAG with maintenance of weight loss has been reported in a meta-analysis of seventy studies (Dattilo & Kris-Etherton, Reference Dattilo and Kris-Etherton1992). High TAG is a risk factor for CVD independently of HDL-cholesterol but it is unclear whether lowering TAG decreases CVD risk (Hokanson & Austin, Reference Hokanson and Austin1996; Miller, Reference Miller2000).
Weighed food records
A limitation of the study was the reliance on 3 d weighed food records to capture dietary intake as it is well known that self-reporting of dietary intake leads to under-reporting of food intake and as duration increases so does the inaccuracy (Hill & Davies, Reference Hill and Davies2001). Reported energy was 8194 (sd 2493) kJ for the men (97 kg) and 6721 (sd 883) kJ for the women (85 kg). Energy requirements were likely to be closer to 11 000 kJ for men and 9000 kJ based on their weight and an activity factor of estimated BMR × 1·4 for a sedentary lifestyle. However, the data as reported provides some insight into the macronutrient profile of the dietary intake at the end of the study and any error could be expected to be equal across the group. Men in the high protein group reported higher energy intakes, however, this was a small number of men and weight loss was the same overall. This group of men may have reported their food intake more accurately. However, it was apparent that both groups had drifted away from the original dietary pattern as reflected by the higher carbohydrate intakes of approximately 45 % which had increased from the original 30 %. A serious limitation of the study was the high attrition rate although there was no difference in the number who withdrew or who were lost to follow-up by diet group. At the end of the study we observed weight loss which may potentially protect these subjects from the development of diabetes and improvements in CVD risk despite reporting a relatively high saturated fat intake (11 (sd 3) %). It is of interest that a relatively modest carbohydrate restriction was not maintained during the study.
In summary, sustained weight loss at 1 year was associated with reduction in CVD risk factors with potential long-term health benefits if maintained. However, limited compliance to the dietary patterns means that we cannot assess if either pattern is detrimental or beneficial in the long term.
Acknowledgements
We gratefully acknowledge the contribution of Anne McGuffin, Kathryn Bastiaans, Julia Weaver, Rosemary McArthur, Mark Mano, Cherie Keatch and Candita Sullivan to the conduct of the trial. The study was supported in part by a grant from the National Health and Medical Research Council of Australia.