Introduction
Over the last few decades there has been a growing awareness that the biodiversity extinction crisis is deepening, that funding for conservation is limited, and that conservation biologists and practitioners need to take a more systematic approach to conserving the world's biological resources (Groves et al., Reference Groves, Jensen, Valutis, Redford, Shaffer and Scott2002). The first efforts to plan systematically for the conservation of biodiversity were initiated in the 1970s, and by the 1990s conservation planning at global and regional scales had become a primary focus of the world's major conservation organizations (Olson & Dinserstein, Reference Olson and Dinerstein1998; Myers et al., Reference Myers, Mittermeier, Mittermeier, da Fonseca and Kent2000; Groves et al., Reference Groves, Jensen, Valutis, Redford, Shaffer and Scott2002; Sanderson et al., Reference Sanderson, Jaiteh, Levy, Redford, Wannebo and Woolmer2002).
Conservation planning attempts to address two fundamental questions: where should conservation action be taken, and how should conservation be accomplished (Redford et al., Reference Redford, Coppolillo, Sanderson, da Fonseca, Dinerstein and Groves2003)? The Nature Conservancy's approach, commonly referred to as Conservation by Design, provides a strategic and systematic approach that addresses both of these questions (The Nature Conservancy, 2006). It incorporates four basic components: setting goals and priorities, developing strategies, taking action, and measuring results. The first component of setting goals and geographical priorities is addressed through the development of ecoregional assessments (biodiversity plans aimed at identifying the most important areas within ecoregions that will conserve targeted species, ecosystems, and ecological processes), where ecoregions are defined as relatively large areas of land and water (typically covering tens of thousands to hundreds of thousands of km2) that contain geographically distinct assemblages of natural communities (Dinerstein et al., 1995; Groves, Reference Groves2003). Steps in these assessments include identifying conservation targets (ecological features we aim to conserve), setting goals for these targets (how much to conserve), evaluating existing conservation areas to determine which targets are already being effectively conserved, evaluating the ecological integrity of the region, and identifying new or additional conservation areas (Groves et al., Reference Groves, Jensen, Valutis, Redford, Shaffer and Scott2002).
Once conservation areas have been identified the question of how conservation should be accomplished is addressed through Conservation Action Planning, a strategic process that identifies and evaluates threats to conservation targets and develops and implements strategies to abate these threats (Poiani et al., Reference Poiani, Baumgartner, Buttrick, Green, Hopkins and Ivey1998; The Nature Conservancy, 2007). Although Conservation Action Planning can be employed at any spatial scale, it is increasingly being used to develop and implement a strategic plan for conservation areas at the scale of landscapes or seascapes, i.e areas within ecoregions that have geographical or ecological distinctiveness. This spatial scale is appropriate for conserving species with large area requirements, and for sustaining ecological processes, because it encompasses a large number of species and several populations of each species, thereby increasing the likelihood of viability (Groves, Reference Groves2003).
Here we demonstrate how these conservation planning processes were applied at the seascape scale in a case study of Kimbe Bay, Papua New Guinea. Conservation Action Planning was used to identify key threats and develop strategies to address these threats. In particular, we focus on how we used a systematic planning process, similar to that used for ecoregional assessments (see above), to establish a network of marine protected areas to be resilient to the threat of climate change.
A case study from Kimbe Bay, Papua New Guinea
Kimbe Bay is located on the north coast of New Britain Island in the Bismarck Sea, Papua New Guinea (Fig. 1). It is a large, well-defined bay (140 × 70 km in area) with distinct boundaries: Willaumez Peninsula to the west and Cape Torkoro to the east. The bay comprises a well-defined seascape, a logical unit within which to design a network of marine protected areas. It also contains a wide variety of shallow and deep water marine habitats of high conservation value (reviewed in Green et al., Reference Green, Lokani, Sheppard, Almany, Keu and Aitsi2007). Most of the bay is deep (> 500 m), with a narrow coastal shelf (< 200 m deep). Rapid ecological assessments have described healthy and diverse coral reefs, mangrove forests and seagrass beds, as well as important habitats for rare and threatened marine mammals, marine turtles and seabirds. Kimbe Bay is also part of a globally significant area for pelagic fishes and toothed whales in the eastern Bismarck Sea (WWF, 2003).
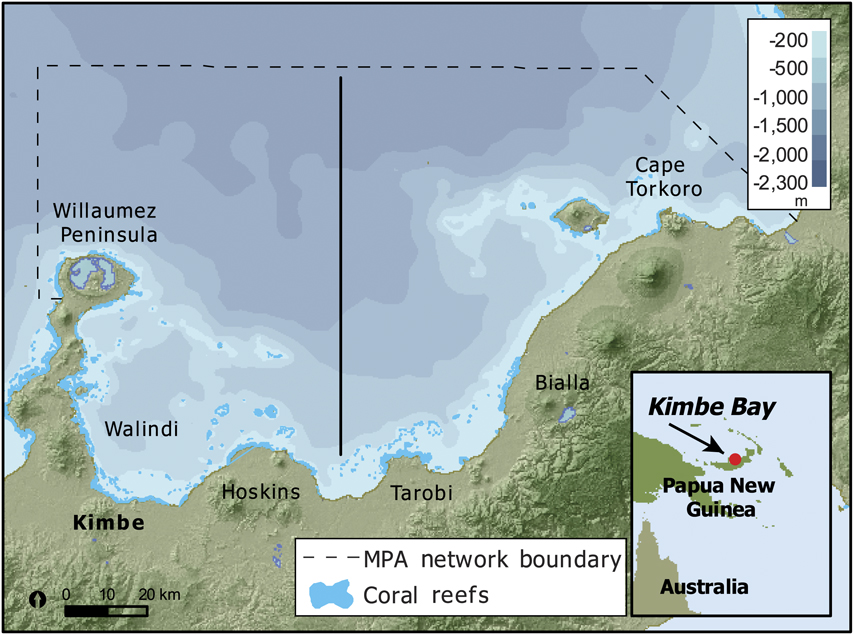
Fig. 1 Kimbe Bay, Papua New Guinea (with regional location in inset), showing bathymetry, coral reefs, marine protected area (MPA) network boundary and east and west stratification units (either side of solid line).
Coastal ecosystems in Kimbe Bay are facing increasing pressures from clearance of forests and mangroves, changes in land-use practices, and run-off of sediment and pollutants from industrial agriculture, forestry and subsistence agriculture (Jones et al., Reference Jones, McCormick, Srinivasan and Eagle2004; Munday, Reference Munday2004; Green et al., Reference Green, Lokani, Sheppard, Almany, Keu and Aitsi2007). Overfishing is not yet a serious problem, with the exception of commercially valuable invertebrates (Green et al., Reference Green, Lokani, Sheppard, Almany, Keu and Aitsi2007) that provide a source of income for local communities (Koczberski et al., Reference Koczberski, Curry, Warku and Kwam2006). Approximately 100,000 people live in the Kimbe Bay watershed (Green et al., Reference Green, Lokani, Sheppard, Almany, Keu and Aitsi2007) and coastal communities rely on both land and marine resources to meet their subsistence and cash income needs. Residents face several challenges to maintaining their livelihoods, including changing village socio-political systems, high population growth rates, poaching of marine resources, the use of destructive fishing methods, rising cash needs, and the loss of income sources such as cocoa and copra (Koczberski et al., Reference Koczberski, Curry, Warku and Kwam2006).
The Nature Conservancy has worked in Kimbe Bay since 1993 with a wide range of partners, including all levels of government, businesses, universities and other NGOs. Initial efforts focused on strengthening the capacity of a local marine conservation NGO (Mahonia na Dari), increasing community awareness and participation in conservation planning and actions, and piloting the establishment of locally managed marine areas, i.e. nearshore waters and coastal resources that are largely or wholly managed at a local level by the coastal communities who reside, or are based, in the immediate area (LMMA, 2009).
Designing a resilient network of marine protected areas
Climate change represents a serious and increasing threat to coral reefs and associated ecosystems (Hoegh-Guldberg, Reference Hoegh-Guldberg1999; Hoegh-Guldberg et al., Reference Hoegh-Guldberg, Mumby, Hooten, Steneck, Greenfield and Gomez2007), including Papua New Guinea. Major threats include rising sea temperatures leading to mass coral bleaching, rising sea levels that threaten coastal habitats (e.g. mangrove forests), and changes in ocean chemistry that affect the ability of calcifying organisms (e.g. corals) to deposit their calcium carbonate skeletons (Hoegh-Guldberg, Reference Hoegh-Guldberg1999; McLeod & Salm, Reference McLeod and Salm2006; Hoegh-Guldberg et al., Reference Hoegh-Guldberg, Mumby, Hooten, Steneck, Greenfield and Gomez2007; IPCC, 2007). These new and emerging threats are beyond the control of local managers, and need to be taken into account in the way in which we design and manage areas for marine conservation and management (West & Salm, Reference West and Salm2003).
Resilience is the ability of an ecosystem to absorb shocks, resist phase shifts and regenerate after natural and human-induced disturbances (Nyström et al., Reference Nyström, Folke and Moberg2000). In recent years, principles for designing and managing marine protected area networks that are resilient to the threat of climate change have been developed (West & Salm, Reference West and Salm2003; Grimsditch & Salm, Reference Grimsditch and Salm2006; McLeod & Salm, Reference McLeod and Salm2006). They include: addressing uncertainty by spreading the risk through representation and replication of major habitats; protecting critical habitats (e.g. turtle nesting areas, fish spawning aggregation sites), particularly those that may be more resilient to climate change; understanding and incorporating biological patterns of connectivity to ensure such areas function as mutually replenishing networks to facilitate recovery after disturbance; and reducing other threats (particularly unsustainable fishing practices and run-off from poor land use practices). In this study, we demonstrate how these principles can be applied to marine protected area network design via a five step planning process (described in detail by Green et al., Reference Green, Lokani, Sheppard, Almany, Keu and Aitsi2007).
1. Defining objectives, conservation targets, boundaries and design principles In 2004 we held a workshop in which we defined objectives, conservation targets, boundaries, and design principles for the marine protected area network. Participants included Conservancy staff and partners, biophysical and socio-economic scientists, and representatives of local industries and government agencies.
Marine protected area network objectives are twofold: to conserve marine biodiversity and natural resources of Kimbe Bay in perpetuity and to address local marine resource management needs. Conservation targets are based on those identified in the Conservation Action Planning process, including a range of shallow water, deep water and island habitats as well as species that are rare, vulnerable or threatened by human activities. Conservation of some of these targets will be addressed by the marine protected area network design, while other strategies, aimed at promoting sustainable land and marine resource use, will be used to conserve others (Table 1).
Table 1 Conservation targets, and strategies to conserve these targets, in Kimbe Bay (Fig. 1).
* marine protected area
The marine protected area network boundary is based on biophysical and socio-economic characteristics of the bay, and encompasses an area of > 13,000 km2. The outer boundary includes all of Kimbe Bay, offshore islands and reefs, and some of the globally significant area for oceanic species. The inner boundary coincides with the highest astronomic tide to include coastal targets (mangroves and estuaries). We included uninhabited islands within the marine protected area network boundary because of their importance as nesting habitat for marine species (particularly marine turtles and seabirds). Eastern and western boundaries take provincial and community boundaries into account (Green et al., Reference Green, Lokani, Sheppard, Almany, Keu and Aitsi2007).
The network design principles are also based on biophysical and socio-economic characteristics of the bay (Table 2). The biophysical design principles aim to maximize biological objectives by taking into account key biological and physical processes, including resilience to climate change. They were based on principles developed for the Great Barrier Reef Marine Park (Fernandes et al., Reference Fernandes, Day, Lewis, Slegers, Kerrigan, Breen and Cameron2005), adapted for local conditions and specifically to address the threat of climate change (West & Salm, Reference West and Salm2003; Green et al., Reference Green, Lokani, Sheppard, Almany, Keu and Aitsi2007). Socio-economic design principles aim to maximize benefits and minimize costs to local communities and sustainable industries.
Table 2 Biophysical and socio-economic design principles for the Kimbe Bay (Fig. 1) marine protected area network.

2. Identifying and conducting high priority research Following the workshop in 2004 we used the network design principles to identify high priority research required to provide a sound scientific basis for the design (Green et al., Reference Green, Lokani, Sheppard, Almany, Keu and Aitsi2007), and conducted this research over the next 2 years (2004–2006) including: (a) Biological field surveys to locate and classify shallow water habitat types (coral reefs, mangrove forests and seagrass beds) and special and unique areas (e.g. fish spawning aggregation sites, turtle nesting areas, and important nesting, wading and resting areas for birds). (b) A hydrodynamic study of the Bismarck Sea, including Kimbe Bay. (c) A detailed socio-economic survey of six communities to provide an understanding of the variety of socio-economic and cultural settings in the bay, including how local stakeholders use and value their marine resources, their traditional marine tenure systems and knowledge of marine ecosystems.
3. Data processing In early 2006 we processed the best available information to produce geographical information system (GIS) layers, where possible, for analysis. Primary data layers included conservation targets (Table 3) and socio-economic information (cost layers; Fig. 2). When processing was complete we held a second scientific workshop to review and refine the data layers and to identify and address additional information requirements. We also noted important information that could not be represented spatially so that it could be taken into account manually in the design process.
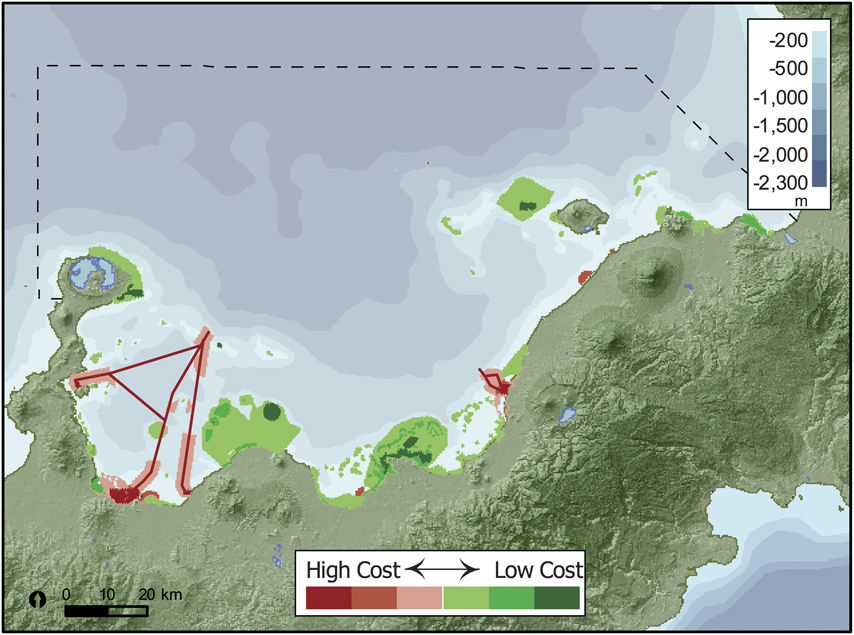
Fig. 2 Cost surface showing relative costs assigned to each layer. Layers with negative (low cost) and positive (high cost) values are considered to be positive and negative, respectively, for conservation.
Table 3 The total number of categories (and GIS layers) for each conservation target used in marine protected area network design in Kimbe Bay (Fig. 1), and the number of categories represented in each stratification unit (east and west).
4. Data analysis to identify priority areas We analysed the data (mid 2006) using the marine reserve design software MARXAN (Ball & Possingham, Reference Ball and Possingham2000; Possingham et al., Reference Possingham, Ball, Andelman, Ferson and Burgman2000). Planning units were the fundamental unit of selection, and planning required the consideration and comparison of a large number of potential planning units. Marine protected area network design required selecting a set of planning units that satisfy both ecological and socio-economic criteria (in this case our design principles, based on our goals for each target layer and a cost layer that incorporates socio-economic considerations). The selection process uses an objective function whereby any collection of planning units is given a score. MARXAN uses a simulated annealing algorithm to help find protected area networks that meet our biodiversity requirements for the lowest score (socio-economic cost). The scenarios produced aim to meet conservation goals whilst simultaneously having the least negative impact on socio-economic values. For a full description of MARXAN see Game & Grantham (Reference Game and Grantham2008).
Our planning unit layer consisted of 32,834 hexagons including shallow water habitats (≤ 200 m; Fig. 1) and adjacent areas. We did not include deep water habitats because we considered strategies to promote sustainable marine resource management more appropriate to protect these habitats than spatial closures in the marine protected area network (Table 1). We used hexagons because they share an equal boundary with all neighbouring planning units. This helps maximize the efficiency of reserve selection when using the boundary length modifier in MARXAN (see below). Hexagons were 10 hectares in size, which provided a fine enough scale to allow the development of refined areas while simultaneously keeping the number of planning units constrained for a manageable processing time in MARXAN.
We used 15 data layers to derive a total cost layer (all cost layers combined) for Kimbe Bay that would best define both opportunities for and threats to conservation success (Fig. 2). High cost areas were those in or adjacent to ports and shipping channels, major towns and large river mouths with industry (i.e. areas where it would be expensive to protect and manage an area). Low cost areas were places where there was strong community interest in conservation, areas that already receive some degree of protection (locally managed marine areas, areas adjacent to Pokili Conservation Area, cultural and dive sites), conservation areas recommended by rapid ecological assessments, and areas adjacent to villages that participated in a recent Rare Pride campaign (RARE, 2009). We also included fish spawning sites because local communities recognize the need to manage these critical areas, which provides the basis for establishing a broader marine protected area network.
We mapped each of these threats and opportunities spatially, and assigned a numerical value that represented their relative importance (Fig. 2). We assigned negative values (low cost) to those layers considered to be positive for conservation, and positive values (high cost) to those layers considered to be negative for conservation. MARXAN will tend to avoid negative areas and preferentially select positive areas. Values were summed across all cost layers to provide a total cost for each hexagon (Fig. 3). Economic costs commonly used in systematic conservation planning exercises (e.g. foregone revenue; Stewart & Possingham, Reference Stewart and Possingham2005) were not used because they were not available at the required resolution and we considered other factors to be more important indicators of conservation success.

Fig. 3 Total cost layer (all cost layers combined). Areas with low and high cost are considered to be positive and negative, respectively, for conservation. Other details are as Fig. 1.
To help ensure the selected network comprised a compact set of protected areas we utilized the boundary length modifier (BLM) function within MARXAN. Although a compact network required protecting a greater total area to meet our representation goals, the resulting protected areas are more likely to be successful than a highly fragmented and dispersed network. After testing a wide range of values we applied a BLM value of 1.5, which provided a network that satisfied our marine protected area design principles and suggested a series of protected areas of moderate size relative to the seascape. All conservation targets were considered to be equally important.
Once defined, we used the planning unit layer and the BLM to conduct a MARXAN analysis based on: (a) Marine protected area network design principles (Table 2). (b) Two stratification units (east and west sides of the bay; Fig. 1) because the best available information indicated that these areas are different in terms of their exposure to ocean currents and waves and their biological communities (Green et al., Reference Green, Lokani, Sheppard, Almany, Keu and Aitsi2007). (c) Fifty-one GIS layers of conservation targets (Table 3) that represented the spatial distribution of the major ecological features. (d) A goal of 20% for most targets and 100% for confirmed reef fish spawning aggregation sites. (e) The total cost layer that represented areas where the relative cost of conservation ranged from high to low (+100 to -100; Fig. 3).
To explore the influence of different constraints on the final reserve network we tested several scenarios in which different areas were either locked in or out of the reserve network. Locking areas into the reserve network influences the final network configuration because MARXAN will preferentially build on existing protected areas. The preferred scenario locked in special and unique areas because they were considered a high priority for inclusion in the network. We did not lock in existing locally managed marine areas because some were known to be in poor condition (Jones et al., Reference Jones, McCormick, Srinivasan and Eagle2004). Instead, we allocated a medium weighting to these areas in the cost layer to ensure that they were effectively considered (Fig. 2). Cultural sites were located in special and unique areas, with the exception of one cultural site that was included during the manual accounting process at the end of the analysis. We ran the preferred scenario 100 times, with each run consisting of 106 iterations.
The sum result of the analysis (Fig. 4) demonstrated there were many ways to design a marine protected area network that achieved our goals. Areas that were selected most of the time were a high priority for inclusion in the network because they were either locked in (selected 100% of the time) or were particularly efficient to include (selected > 80% of the time). In comparison, other areas were selected less frequently and were not as important to include. Therefore, while it was important to include the high priority areas in the marine protected area network, there was flexibility in selecting other areas.
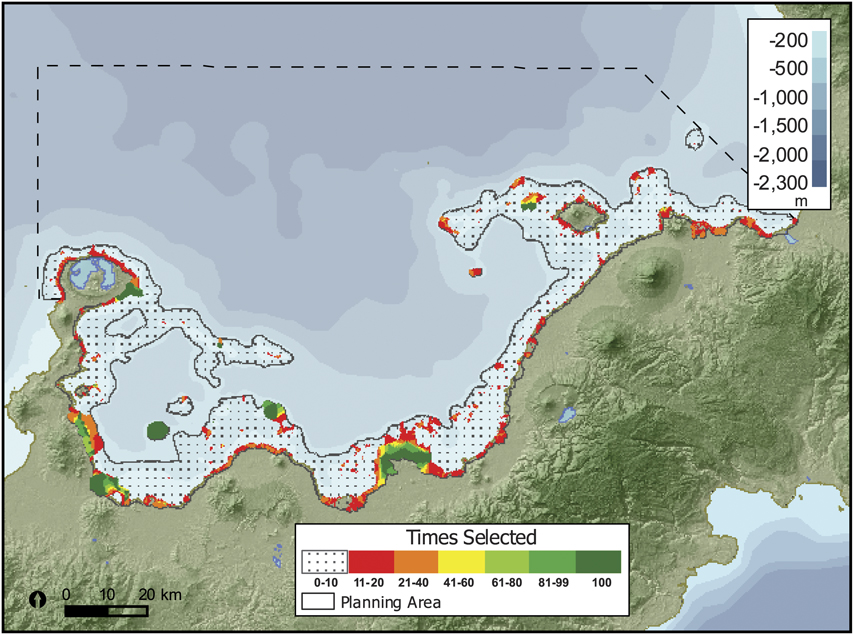
Fig. 4 MARXAN sum result representing the number of times each hexagon was included in a best solution in 100 runs. Areas selected > 80 times are high priorities for inclusion in the marine protected area network. Other details are as Fig. 1.
5. Finalizing the design We completed the scientific design of the marine protected area network at a third workshop in July 2006, with a multidisciplinary team of local staff and technical advisers. In Kimbe Bay local communities are the resource owners and decision makers. For that reason, we used the sum result of the analysis and the full range of our knowledge and experience in the bay to identify broad Areas of Interest that are considered good choices for biodiversity conservation. These areas provided a starting point for discussions with local communities regarding the development of protected and managed areas.
We selected Areas of Interest using high priority areas for inclusion as core areas, expanding into adjacent areas where local communities have demonstrated the strongest interest in conserving their marine resources. Once we selected the initial Areas of Interest we used the results of the MARXAN analysis as an accounting tool to ensure that the design principles and goals were met. This was an iterative process that required moving boundaries of the Areas of Interest, and including and removing areas, until the design principles and goals were met.
The result was a scientific design of a resilient network of marine protected areas for Kimbe Bay (Fig. 5). Manual accounting confirmed that if these areas are effectively conserved we will have successfully applied marine protected area network design principles and network objectives will be achieved. However, it is important to note that the results of this analysis represent the views of scientists as to those areas most likely to meet biodiversity targets and least likely to affect local communities and other stakeholders. These views still require direct input from local communities, local government and other stakeholders. These are now being obtained through the implementation process currently underway.
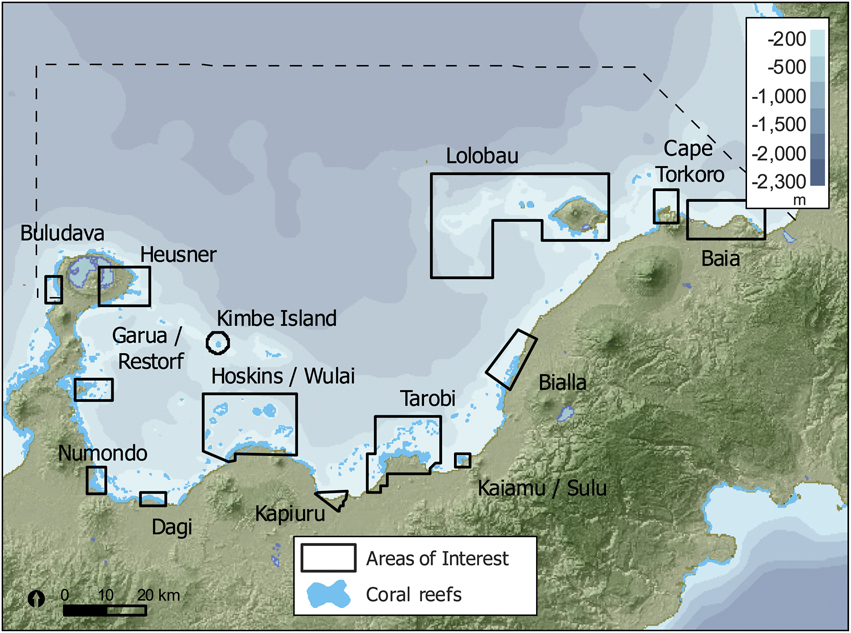
Fig. 5 Scientific design of a resilient network of marine protected areas for Kimbe Bay, Papua New Guinea. The design is based on an assessment of biodiversity and socio-economic values, and identifies 14 Areas of Interest that meet specific conservation goals (see text for further details). Other details are as Fig. 1.
Community engagement
For several reasons we engaged communities only after the scientific design was completed. Firstly, we were concerned that engaging all communities in the design process would raise expectations well beyond our capacity to support effective conservation in the bay. Secondly, there are over 100 culturally diverse communities in Kimbe Bay, all of which hold complex and often overlapping traditional rights to sea resources, and it was logistically unrealistic to capture all of these communities’ views and opinions in the scientific process. Thirdly, the design process was technical, and it was not practical for community members to participate. Therefore, we decided to identify priority areas for conservation through the scientific design process, and then work with communities that own and manage the marine resources within these areas through a detailed community-based planning process.
While we did not undertake formal community engagement during the scientific design process we did take several steps to understand and incorporate the needs and interests of communities. Firstly, field staff spoke informally with community members. Secondly, we gathered valuable background information through the socio-economic study and used this information to design the socio-economic principles. Finally, we discussed results with representatives from all levels of government (national, provincial and local), private businesses, local communities and resource owners in Kimbe on several occasions during 2004–2006. These consultations indicated broad support for the establishment of a marine protected area network in the bay.
Implementation
The scientific design of a resilient network of marine protected areas provides a framework for conservation in Kimbe Bay. Implementing the network of protected areas identified as Areas of Interest in the design process will require multiple strategies for working with local communities and government at a range of scales. Our primary implementation strategy is to help communities manage their marine resources through locally managed marine areas. This is a well-established strategy throughout the Pacific, and the most effective strategy for conserving nearshore areas in line of sight of local communities (McClanahan et al., Reference McClanahan, Marnane, Cinner and Kiene2006).
The marine protected area network design provided a starting point for discussions with local communities in Kimbe Bay, and we are now using a detailed community-based planning process to help communities develop management plans and agreements under the Papua New Guinea Organic Law for Provincial and Local Governments. These legally binding locally managed marine areas will provide effective long-term protection and management of marine resources by local communities.
The community-based planning process we developed for Kimbe Bay is a combination of Conservation Action Planning and the Locally Managed Marine Area Network process (Lipsett-Moore, Reference Lipsett-Moore2006). The process involves six steps: (1) community engagement, (2) community visioning, (3) participatory conservation planning, (4) community development of a locally managed marine area plan, (5) preparation of a draft plan and agreement, and (6) stakeholder consultation and finalization of the plan and agreement by the community (Lipsett-Moore, Reference Lipsett-Moore2006). Depending on community interests Areas of Interest may be either large-scale locally managed marine areas or a number of smaller locally managed areas within a broader area. Implementation is now underway. Two Plans of Management and Agreement have been signed and six others are in various stages of negotiation.
Although legally binding locally managed marine areas are the best strategy for nearshore areas in Kimbe Bay, other strategies will be required for offshore areas and to ensure the ecological integrity of nearshore areas. These may include protecting areas through partnerships with tourism, other industries, and the Provincial government. Broader scale strategies will also be required for the entire marine protected area network area, particularly regarding marine resource use and land use management. Implementation of the marine protected area network is likely to take 5 years to complete.
Discussion
This study demonstrates how The Nature Conservancy's approach to conservation planning can be applied at the seascape scale. In Kimbe Bay we used Conservation Action Planning to identify key threats and strategies, and systematic conservation planning (similar to that used for ecoregional assessments) to design a resilient network of marine protected areas. Because communities are the marine resource owners and decision makers, final decisions regarding the marine protected area network design will be at their discretion. Here we examine how successful we were at applying resilience principles for marine protected area network design and discuss other challenges and lessons learned.
Application of resilience principles for marine protected area network design
The scientific design of the Kimbe Bay marine protected area network represents one of the first attempts to design a marine protected area network by applying resilience principles to address the threat of climate change to coral reefs and associated ecosystems. While we applied some principles successfully in Kimbe Bay, others will require refinement over time as more information becomes available.
Some resilience principles were easy to apply because the required data layers were readily available, and the principles were straightforward to apply using MARXAN. They included: risk spreading through representation and replication (manual accounting confirmed that we achieved our goal of including at least 20% of each conservation target in the marine protected area network design for 50 of our 51 targets; and at least three examples of each habitat type for 40 of the 51 targets, where the number and spacing of targets allowed); protecting critical areas such as fish spawning aggregation sites and turtle nesting areas (special and unique areas were locked into the network); and incorporating patterns of connectivity among shallow water habitats (coral reefs, mangrove forests and seagrass beds) because adjacent habitats were automatically clustered as a function of the MARXAN analysis (Game & Grantham, Reference Game and Grantham2008).
Other principles were difficult to apply in detail because the information required was not available. They included: protecting some key sites, particularly areas that may be more resilient to climate change, and incorporating patterns of connectivity within habitat types (e.g. among coral reefs), taking into account small- and large-scale patterns of connectivity through adult movement and larval transport.
In the absence of detailed information to identify specific areas that may be more resilient to climate change, we addressed this threat using risk-spreading strategies (representation and replication of conservation targets) and best available information to: (1) address the threat of rising sea surface temperatures by stratifying the bay into two units (Fig. 1) because the west side of the bay appears more susceptible to coral bleaching than the east (Green et al., Reference Green, Lokani, Sheppard, Almany, Keu and Aitsi2007), and by protecting a range of habitat types because inshore reefs appear more vulnerable to bleaching than offshore reefs (Green et al., Reference Green, Lokani, Sheppard, Almany, Keu and Aitsi2007); and (2) address the threat of sea level rise to coastal targets (specifically mangrove forests and turtle nesting areas) by selecting areas, where possible, with gently sloping natural backdrops that are likely to accommodate change more effectively as sea levels rise than areas with steep topography or intensive land use (McLeod & Salm, Reference McLeod and Salm2006).
To incorporate biological patterns of connectivity within habitat types (e.g. coral reefs), we relied on risk-spreading strategies (representation and replication of conservation targets) based on two stratification units (because the east and west sides of the bay differ in terms of their biophysical characteristics). We also used rules of thumb for marine protected area network configuration that take into account the longest and shortest dispersal distances of targets. They included a minimum size of 10 km2 per marine protected area (10–20 km in diameter) and a maximum spacing distance of 15 km between protected areas (Mora et al., Reference Mora, Andrefouet, Costello, Kranenburg, Rollo and Veron2006). We were largely successful in applying these rules of thumb because only one Area of Interest was less than the recommended size (Kiamu/Sulu) or separated from the others by > 15 km (Garua/Restorf; Fig. 5). Targeted research is now required to improve our understanding of biological patterns of connectivity and areas that may be naturally more resilient to climate change, and to test and refine rules of thumb for marine protected area network design both in Kimbe Bay and elsewhere around the world.
Other challenges
Now that the scientific design has been completed our biggest challenges include: (1) implementing the marine protected area network through the community-based planning process for nearshore areas; (2) working with communities, industry and all levels of government to develop and implement a process for offshore areas; (3) working with the Provincial government and industry to establish an overarching management committee and sustainable financing plan for the long-term management of the area; (4) designing and implementing a comprehensive monitoring programme to measure success; and (5) developing and implementing a land-use strategy to abate land-based threats and an ecosystem-based fisheries management strategy to ensure the sustainable use of marine resources, particularly highly mobile species that move outside reserve boundaries.
Lessons learned
The lessons learned during the processes described here include: (1) Have a clear plan for the design and a process for achieving it. The most useful step was the first workshop where we defined the objectives, conservation targets, boundaries and design principles. This provided a guiding framework for the marine protected area network design. (2) Take implementation into account in the way in which marine protected area networks are designed, and identify the most effective strategy for engaging stakeholders in the process. In Kimbe Bay we recognized that local communities are the resource owners who will decide where and how to protect their resources, so we identified broad Areas of Interest as starting points for discussion with local communities as part of a community-based planning process. (3) MARXAN is an excellent decision support tool for processing the large amounts of information required for marine protected area network design. However, final decisions should be made by local managers and other stakeholders based on their full range of knowledge and experience of the area, including the results of the analysis. (4) The minimum amount of information required to complete a marine protected area network design is the location of conservation targets (habitats, key species, special and unique areas), key threats (fishing, run-off, shipping, tourism and climate change) and opportunities (where local communities and governments support conservation). (5) A multidisciplinary team is required, including a marine scientist, a GIS specialist, scientific advisers, marine protected area managers, and representatives who can contribute local knowledge and an understanding of the culture, needs and interests of communities and other stakeholders (or the stakeholders themselves, depending on the situation). (6) The scientific design process is technical and time consuming, and takes 1–2 years to complete depending on available data. Primary research takes time, so it is important to identify research priorities early in the process. Implementation and consultation is a labour-intensive process that also takes time, and the minimum time for establishment of a marine protected area network for Pacific islands is likely to be 3–5 years. (7) Costs can be relatively low where the minimum amount of information required by managers and stakeholders is low. Total cost for the scientific design process in Kimbe Bay (excluding community engagement and implementation) was c. USD 400,000, primarily for scientific research (54%), staff time (35%) and workshops (10%).
These lessons learned in Kimbe Bay are now being used to help design marine protected area networks throughout much of South-east Asia, the Pacific Islands, the Mesoamerican Reef, the Caribbean and the Western Indian Ocean.
Acknowledgements
We thank local communities and staff (Stephen Keu, Joseph Warku Karvon, Annisah Sapul, Freda Paiva, George Ulae, Walain Ulaiwi, Christina Kwam-Muge and Sebastian Kautu), partners (Walindi Plantation Resort, Mahonia na Dari, the Locally Managed Marine Area Network, and University of Papua New Guinea) and Local Level, Provincial, and National Governments for sharing local knowledge and supporting the marine protected area network. We are also grateful for technical advice provided by Eddie Game, Maria Beger, Craig Steinberg, Leanne Fernandes, Glenn Almany, Geoff Jones, Emre Turak, Benjamin Kahn, Maya Srinivasan, Rod Salm, Peter Mous, Andrew Smith, Shannon Seeto, Marcus Sheaves, Serge Andrefouet, Gina Koczberski, George Curry and Josh Cinner. This work would not have been possible without the generous support of the American people through the United States Agency for International Development (USAID), the David and Lucile Packard Foundation, Charles Brown, Wayne and Colleen Minami, and Rare. The contents are the responsibility of the authors and do not necessarily reflect the views of USAID or the United States Government.
Biographical sketches
The authors work for The Nature Conservancy in Papua New Guinea, Australia, Indonesia, and the United States. They are part of many programs and regions across the Conservancy, including the Asia Pacific Conservation Region, the Coral Triangle Program, the Melanesia Program and the Kimbe Bay Project, Conservation Science, and the Global Marine Program. They include specialists in marine science and management, conservation planning, tools and methods, GIS, communication, and international policy.