


INTRODUCTION
In the United Kingdom, laboratory and clinical data form the basis of community surveillance of infectious diseases [Reference Noah and O'Mahony1, Reference Hawker, Begg, Blair, Reintjes and Weinberg2]. Since the winter of 1999/2000 NHS Direct derived call data have been used to monitor community levels of syndromes which may be related to infection [Reference Baker, Smith and Cooper3, Reference Cooper, Smith and Hollyoak4]. NHS Direct is a 24-hour nurse-led helpline covering the whole of England and Wales [5]. Nurses use the NHS Clinical Assessment System (NHS CAS) which is based around 200 clinical algorithms. Initially work focused on the use of NHS Direct data for the surveillance of influenza-like-illness, but was expanded in November 2001 as a response to the terrorist and anthrax attacks in the United States. National call data relating to 10 key symptoms/syndromes (algorithms) are collected from all 23 NHS Direct sites and analysed on a daily basis by a surveillance team. The aim is to identify increases in syndromes which may represent the prodromal stages of disease caused by a bio-terrorist attack, or more likely a rise in common infections.
To date no bio-terrorist attack has been detected in the United Kingdom, or elsewhere in the world [Reference Ackelsberg, Balter and Bornschelgel6–Reference Osaka, Takahashi and Ohyama9], using syndromic surveillance systems. Our surveillance system has, therefore, never been subjected to this challenge. Although it has been possible to identify rises in calls for certain syndromes, we need to gain an understanding of what disease outbreaks we are likely to detect. Therefore, we have superimposed data from a real outbreak of cryptosporidiosis onto the current NHS Direct surveillance system. Cryptosporidium is considered a good example to use due to the relatively long incubation period, which may lead to an insidious rise in cases in the community [Reference Noah and O'Mahony1]. We aimed to determine whether a historical cryptosporidiosis outbreak would have been detected using the current NHS Direct surveillance system and, if so, at what point during the outbreak it would have been detected.
METHODS
Case data were obtained from a cryptosporidiosis outbreak that occurred during the spring of 1997 in North London and Hertfordshire [Reference Willocks, Crampin and Milne10]. The dates of onset of the 345 laboratory-confirmed cases varied between 1 February and 9 April and peaked on 1 March (Fig. 1). The outbreak was first notified on 25 February. Drinking unboiled tap water from a treatment works was the cause of the outbreak.
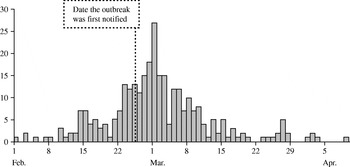
Fig. 1. Epidemic curve of cryptosporidiosis cases (![]() ) from the London outbreak (February–April 1997).
) from the London outbreak (February–April 1997).
We assumed that cases of Cryptosporidium would report diarrhoea. Data on total daily calls and calls where the diarrhoea algorithm was used were obtained from NHS Direct North Central London (approximate population 1·6 million) for 22 October 2001 to 14 April 2003. Observed diarrhoea calls, as a proportion of total calls, are displayed in Figure 2. A baseline number of daily NHS Direct diarrhoea calls was estimated, assuming a Poisson distribution, incorporating a bank holiday factor, seasonal factor and day factor (weekday, Saturday or Sunday) (Fig. 2). Within our surveillance system we use two methods to calculate upper prediction limits for the proportion of diarrhoea calls. The first method, termed the ‘control chart method’, uses the estimated baseline number of diarrhoea calls to calculate a daily 99·5% upper prediction limit for the proportion of diarrhoea calls (Fig. 2). The second method, termed the ‘confidence interval method’, calculates 99·5% upper confidence intervals derived from standard formula for proportions [Reference Armitage and Berry11]. Both these methods are described in the Appendix.
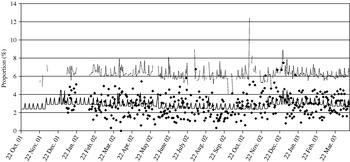
Fig. 2. Control chart showing (in the absence of the added outbreak data) the observed proportion of diarrhoea calls (✦); the simulated baseline number of diarrhoea calls (–––, expressed as a proportion of total calls); and the simulated 99·5% upper prediction limit (· · · · ).
The fraction of cryptosporidiosis cases who would have telephoned NHS Direct is unknown. It was, therefore, estimated by first taking the known number of cryptosporidiosis cases which were microbiologically confirmed (n). We know from a national infectious intestinal disease study [12] that approximately half of the cases of cryptosporidiosis seen by the GP will be reported to a laboratory, and therefore, estimate that 2n cases will have been seen by their own GP. The total call rate to NHS Direct is approximately one-fortieth of the consultation rate of GPs, this proportion being derived from comparing the NHS Direct total call rate to the consultation rate for all diseases and conditions reported to GPs [13, 14]. We have, therefore, assumed that the fraction of community cases of cryptosporidiosis that telephone NHS Direct is about one-fortieth of the GP cases. For this outbreak this would be 2n/40=n/20. Thus, taking the laboratory-confirmed cryptosporidiosis cases in this outbreak (n), we estimate that 1/20 (one-twentieth) of these cases would have telephoned NHS Direct. (Due to the uncertainty of this fraction we also modelled one-hundredth, one-fiftieth, one-tenth, three-tenths, six-tenths and nine-tenths of cases telephoning NHS Direct.) We assumed that cases would telephone NHS Direct on the first day of their symptoms.
We simulated a daily number of diarrhoea calls from our estimated baseline (see Appendix). An outbreak observation of diarrhoea calls (‘cryptosporidiosis’) was then generated from a Poisson distribution with the mean given by the fraction of cryptosporidiosis cases telephoning NHS Direct. The outbreak number of diarrhoea calls was added to the simulated daily number of diarrhoea calls. The total number of calls on each day was also increased by these additional calls. When the proportion of diarrhoea calls (simulated plus outbreak calls) exceeded the upper 99·5% control chart limit or upper 99·5% confidence interval this was termed an ‘exceedance’. There were 10 000 such simulations conducted. Days with no outbreak cases or where NHS Direct data were unavailable were omitted from the analysis. For the simulations, we assumed that the cryptosporidiosis outbreak occurred in the same period in 2003 (February to April).
The median and maximum proportion of exceedances in the absence of the cryptosporidiosis outbreak were calculated for both methods.
For both methods (control chart method and confidence interval method) we calculated the maximum and median number of single-day exceedances (out of 10 000) for each day, for the range of fractions modelled. The maximum percentage excess above the upper prediction limits on each day and the number of occasions where an exceedance on one day was followed by an exceedance the next day (a pair of exceedances) were calculated. Time-series graphs were plotted showing the likelihood of detecting a single-day exceedance on any given day, for the range of fractions of cases ringing NHS Direct. The results for the one-hundredth, one-fiftieth and one-tenth fractions are not presented in this report due to their similarity to the results for the one-twentieth fraction.
RESULTS
Between 22 October 2001 and 14 April 2003 North Central London NHS Direct handled 24 516 calls of which 738 were classified as diarrhoea calls (3% of the total). The range of daily total calls and daily diarrhoea calls was 206–508 and 3–22 respectively. The range of daily diarrhoea calls as a proportion of total calls was 1·1–4·6% with a median of 3%.
Model accuracy
Using the 99·5% control chart limit the median proportion of exceedances, in the absence of outbreak data, was 0·48% and the maximum 0·74%. This is close to the expected figure of 0·5%. For the 99·5% confidence interval method (second method used) the median error rate was 2·1% and the maximum 5·7%, both much higher than the expected 0·5% (due to ignoring factors such as bank holidays and over-dispersion of the call data).
Control chart method
Number and size of exceedances
When the outbreak data were added to the model, for the control chart method the maximum number of exceedances out of 10 000 simulations ranged from 102 (1%) when one-twentieth of cryptosporidiosis cases telephoned NHS Direct to 9651 (97%) when nine-tenths of cases telephoned (Table). The maximum number of exceedances occurred on 1 March for all fractions of cases telephoning NHS Direct. The median percentage excess from 10 000 simulations ranged from 32% when one-twentieth of cases telephoned to 51% when nine-tenths of cases telephoned (Table).
Table. Median, maximum, and date of maximum numbers of single-day exceedances out of 10 000 simulations; median, maximum, and date of maximum percentage excess above the upper prediction limit from 10 000 simulations; date of first successive (two-day) exceedance, maximum successive exceedances, and date of maximum successive exceedances out of 10 000 simulations; for all fractions of Cryptosporidium cases telephoning NHS Direct (one-twentieth, three-tenths, six-tenths, nine-tenths)

Likelihood of observing an exceedance
The likelihood of observing a single-day exceedance remained below 20% (for all fractions of cases phoning NHS Direct) until 23 February. The likelihood then began to rise, peaking on 1 of March (Fig. 3). A smaller early peak in the likelihood of observing an exceedance occurred on 14 February, caused by a small early peak in cryptosporidiosis cases on the same date. On the date the outbreak was first notified (25 February), our model predicted a 1% (if one-twentieth of cases telephoned NHS Direct) to 47% chance (if nine-tenths of cases telephoned NHS Direct) of detecting the outbreak.
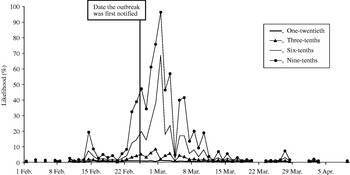
Fig. 3. Likelihood of detecting a single-day exceedance on a given day during the outbreak (control chart method). Each curve represents an estimate of the fraction of cryptosporidiosis cases who telephoned NHS Direct.
Successive (two-day) exceedances
The first successive exceedances, for the range of cases phoning NHS Direct, occurred between 8 and 15 February, prior to the date the outbreak was first notified (25 February).
Confidence interval method
Number and size of exceedances
For the upper confidence interval method, the maximum number of exceedances out of 10 000 ranged from 729 (7%) when one-twentieth of cryptosporidiosis cases telephoned NHS Direct to 9908 (99%) when nine-tenths of cases telephoned (Table). The maximum number of exceedances occurred on 14 February for the one-twentieth fraction of cases, and on 1 March for all other fractions. The median percentage excess from 10 000 simulations ranged from 54% when one-twentieth of cases telephoned to 72% when nine-tenths telephoned.
Likelihood of observing an exceedance
A similar pattern to the control chart method was observed (Fig. 4), although the likelihood of observing exceedances was higher throughout the study period. When the outbreak was first notified (25 February), our model predicted a 4% (if one-twentieth of cases telephoned) to 72% chance (if nine-tenths of cases telephoned) of detecting the outbreak.
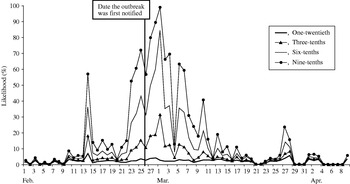
Fig. 4. Likelihood of detecting a single-day exceedance on a given day (confidence interval method). Each curve represents an estimate of the fraction of cryptosporidiosis cases who telephoned NHS Direct.
Successive (two-day) exceedances
The first successive exceedances, for the range of cases telephoning NHS Direct, occurred on 8 February, again prior to the date the outbreak was first notified.
DISCUSSION
The NHS Direct syndromic surveillance system is currently unlikely to provide early detection of an event similar to the cryptosporidiosis outbreak modelled here. The system may be most suited to detecting widespread generalized rises in syndromes in the community. This has been previously demonstrated [Reference Baker, Smith and Cooper3, Reference Cooper, Smith and Hollyoak4]. However, our model has shown that as the fraction of cryptosporidiosis cases telephoning NHS Direct increases, the chance of detecting the outbreak increases. When nine-tenths of cases telephoned NHS Direct (using the confidence interval method) there was a one in two chance of detection prior to the date officials were notified of this outbreak. Successive day exceedances may currently be of little practical use as they occur infrequently, unless we assume that a very high fraction of cases telephone NHS Direct (nine-tenths). In practice the surveillance team also uses other factors in deciding whether to fully investigate an exceedance, such as seasonality, other surveillance data, call activity at neighbouring NHS Direct sites and the severity of call outcomes.
The median daily excess above the prediction limits when one-twentieth of cases telephone NHS Direct (our current estimate), was 32% for the control chart method and 54% for the confidence interval method. This is a positive result as both these levels of excess are likely to trigger further investigation of the exceedance by the surveillance team. More detailed call information would be obtained (e.g. geographical location of calls), possibly leading to a timely intervention by local health protection teams. Of the two methods of detecting exceedances described here (control chart and confidence interval methods), the confidence interval method produces more exceedances throughout the outbreak period but also more false-positives. This is mainly due to over-dispersion of the data, which is accounted for within the more rigorous control chart method.
Various assumptions have been made for this work. To test our surveillance system we have used a single outbreak of cryptosporidiosis, modelled using a single proxy syndrome (diarrhoea), at a single NHS Direct site. We do not know what fraction of Cryptosporidium cases would have telephoned NHS Direct. Our conservative estimate of outbreak-related diarrhoea calls (17 for the one-twentieth estimate), has been superimposed on a relatively high total of diarrhoea calls (738 during the outbreak period). The most commonly reported symptoms for this outbreak were diarrhoea, abdominal pain, fever and vomiting [Reference Willocks, Crampin and Milne10]. We assumed that all cryptosporidiosis cases would have been dealt with using the NHS Direct diarrhoea algorithm whereas some may have been dealt with using other algorithms. This would have diluted a rise in calls between two or more algorithms, possibly resulting in no exceedances for any single algorithm. NHS Direct uses call networking (transfer of calls between sites) to manage national demand for the service. We also assumed that no call networking, either in or out of North Central London NHS Direct, occurred during our study period.
The prediction limits used here may be too high for the current system to detect outbreaks of this kind. Strict criteria, 99·5% limits, have been used as opposed to the more commonly used 95% limits. When using the control chart method, exceedances early in the outbreak were rare. There is, therefore, an argument for lowering the control chart prediction limits (e.g. to 95% or 98%), in an attempt to increase the likelihood of early detection. This would increase the number of exceedances whilst maintaining the scientific validity of using control charts (i.e. incorporating important factors in the model). Lowering exceedance limits will need to be balanced against an acceptable increase in false-positives (‘naturally occurring exceedances’). City-wide syndromic surveillance systems used in the United States [Reference Micheal, Pavlin and Mansfield8] and Japan [Reference Osaka, Takahashi and Ohyama9] have reported using 95% significance limits. These studies did not report an excess amount of false-positives although it is not clear from the reports whether these data also exhibited over-dispersion. ‘Multiple models’ have been suggested as a means of improving the sensitivity of syndromic surveillance data for outbreak detection [Reference Reis and Mandl15]. These models have the advantage of adjusting for naturally occurring outbreaks (e.g. influenza) in an attempt to detect simultaneously occurring unnatural outbreaks (e.g. resulting from a bio-terrorist attack). ‘Multiday temporal filters’ [Reference Reis, Pagano and Mandl16], as opposed to the one- and two-day exceedances modelled here, have also improved detection sensitivity under simulated outbreak conditions.
We do not yet know if the full potential for the system to act as an early warning system has been reached. Assuming a high proportion of cryptosporidiosis cases will telephone NHS Direct may be unrealistic given current NHS Direct call rates. However, a recent government paper has outlined plans for expanding NHS Direct, with a threefold increase in calls predicted by 2007 [17]. A corresponding increase in the number of outbreak cases telephoning NHS Direct should improve our surveillance tool for outbreak detection. It is worth noting that syndromic surveillance is a relatively new field. There is as yet no consensus of opinion, originating from the different systems around the world, as to the best outbreak detection methods and what type of outbreaks syndromic surveillance will or will not detect. Individual systems are likely to become more targeted at specific types of events [Reference Wagner, Data and Dowling18] (either naturally occurring or due to a deliberate release) as the body of evaluation work increases. Due to its national population coverage, and an emphasis on prodromal illness (health calls), further evaluation of the NHS Direct surveillance system should enhance this body of work.
In conclusion, given our present assumptions, the NHS Direct surveillance system is currently unlikely to detect an event similar to this cryptosporidiosis outbreak. Significant daily rises in NHS Direct diarrhoea calls did occur early in the outbreak but were low in number. We know that the system detects national rises in syndromes which coincide with rises detected by other surveillance systems (e.g. influenza). The full potential of the surveillance system for detecting local outbreaks is likely to be reached only after a substantial rise in call rates. This work has provided useful information about the nature and volume of syndromic data required to trigger ‘exceedances’ (signals). Work now needs to focus on defining a statistical threshold that will maximize the detection of true rises in syndromes, whilst avoiding naturally occurring fluctuations. Further modelling work is also required to determine the size and nature of outbreaks that this surveillance system is most likely to detect.
ACKNOWLEDGEMENTS
We thank NHS Direct North Central London for call data; the Outbreak Investigation Team and Communicable Disease Surveillance Centre (CDSC) for use of the laboratory outbreak data; and Dr Andrew Grant (CDSC) and Jon Hannah from the Department of Health for scientific advice during this work.
APPENDIX
Control chart method
The model for estimating the baseline incorporated a bank holiday factor, seasonal factor and day factor (weekday, Saturday or Sunday). The estimated baseline number of diarrhoea calls, as a proportion of total calls, is displayed in Figure 2. Using this estimated baseline we calculated a daily 99·5% upper prediction limit for the proportion of diarrhoea calls (Fig. 2).
Confidence interval method
Within the NHS Direct syndromic surveillance system, there are NHS Direct sites and algorithms for which, due to resource constraints, 99·5% control chart limits are not calculated [Reference Baker, Smith and Cooper3]. For these algorithms/sites, we calculate a seasonal 99·5% upper confidence interval, derived from standard formula for proportions [Reference Armitage and Berry11]. The upper confidence interval was based on a seasonal baseline proportion of diarrhoea calls and remained constant throughout each season (i.e. not incorporating the bank holiday or day factor).
Simulation
The estimated baseline number of daily NHS Direct diarrhoea calls was generated from a Poisson distribution (θ) using the Gamma distribution (α, β) to account for over-dispersion (i.e. more variation than would be expected) [Reference Johnson, Kotz and Balakrishnan19].
α=estimated baseline/(scale−1),
β=scale−1.
The scale parameter was calculated as (model deviance)/(model degrees of freedom), where the model was that used to calculate the baseline (expected value) from the control chart methodology. For the confidence interval method, the same scale parameter as derived from the control chart method was used. The statistical package stata, version 8 (StataCorp, College Station, TX, USA) was used for this work.


