


Urbanisation is one of the most outstanding features of the century. Technological advances are centred on cities and as a result they can encourage economic growth. However, cities are also sources of poverty, inequality and environmental health hazards(Reference McMichael1). Africa is urbanising at an unprecedented rate; by 2025, >50 % of the population of West Africa is expected to be urban(Reference Njoh2). The rapid urbanisation of West African cities has led to major environmental and sociodemographic changes. Cities are heterogeneous areas where population densities create new conditions for disease transmission and adoption of new behaviours (changes in diet, reduction of activity and risk-taking behaviours). The health consequences have not yet been fully described but it can be advanced that such heterogeneity may result in health disparities.
The obesity patterns determined by various national surveys indicate that the nutrition transition is an important challenge that many lower-income countries face, particularly their urban populations(Reference Popkin3). Studies in sub-Saharan urban adults in Nigeria, The Gambia, Ghana, Senegal, Cameroon and South Africa reported prevalence of obesity between 5 and 7 % in men and between 19 and 50 % in women depending on the age category of the studied population(Reference Afolabi, Addo and Sonibare4–Reference Puoane, Steyn, Bradshaw, Laubscher, Fourie, Vicki and Mbananga12). In the foreseeable future, the prevalence of obesity is expected to continue to rise in lower-income countries(Reference Prentice13). Many changes in health are accompanying the nutrition transition. Co-morbidities of obesity such as CVD (hypertension, dyslipidaemia and arteriosclerosis), and type 2 diabetes are documented as increasing rapidly(Reference Pokin14, Reference Reddy15). The health system of the developing countries so far focusing on infectious disease is not fully prepared to face this rising burden of chronic diseases.
The nutrition transition in lower-income countries displays two major features. On the one hand, it is more likely to occur in urban areas(Reference Popkin16–Reference Maire and Delpeuch18). On the other hand, it is marked by the coexistence of both underweight and overweight(Reference Doak, Adair, Bentley, Fengying and Popkin19–Reference Garrett and Ruel21). This leads to a complex situation and illustrates the need for public health programmes that are able to address both underweight and overweight simultaneously. Another issue that has to be considered is the heterogeneity in cities, due to the particularity of urbanisation, and that can make the situation even more complex. The primary prevention of obesity appears as to be privileged. It is thus crucial to understand the distribution of obesity in the population, as well as the distribution of the factors that influence it.
The immediate causes of obesity are excess energy intake, combined with lack of physical activity. It is useful to consider demographics and economics as factors underlying the nutrition transition(Reference Popkin16). Urban populations have generally a better access to energy-dense foods such as sugar and fatty products. They are also exposed to the increasing mediatised commercial communication (publicity, marketing) and to an evolution towards a sedentary way of life due to mechanisation of transport, technicality of work and modification of leisure (television, cinema)(Reference Maire and Delpeuch18). There are some risk-taking behaviours that can influence the obesity patterns. Indeed, the consumption of coffee/tea and alcohol, and smoking/nicotine are associated with lower energy intake and/or higher energy expenditure(Reference Perkins22–Reference Klesges, Mealer and Klesges26).
The research project, entitled ‘Urban environment and health transition in West Africa’, was aimed at analysing the health transition, taking into account the particular urbanisation pattern of Ouagadougou, the capital city of Burkina Faso (West Africa). We hypothesised that obesity is subject to socio-spatial variations due to an unequal distribution of its causes in this heterogeneous population. The purpose of this paper was to: (i) document the prevalence of obesity in the adult population; (ii) analyse the socio-spatial variations of obesity among adults; and (iii) identify individual and household characteristics, lifestyles and dietary practices contributing to obesity and its socio-spatial distribution.
Subjects and methods
Setting
Burkina Faso is a lower-income country; it is classified 174th of 177 countries in the world, with a Human Development Index of 0·342(27). The yearly gross income does not exceed US $300 per capita, and about 46·4 % of the population live below the poverty line(28). The population, estimated to be about 12 million in 2003, is very young; >50 % is <18 years old. The present study was conducted in Ouagadougou, a city characterised by a significant population and spatial growth. The population doubled at each decade, increasing from 282 000 inhabitants in 1985 to 709 000 inhabitants in 1996 and 1 060 000 inhabitants in 2006. The city size, which was about 100 km2 in 1980, has now reached 200 km2, 70 % of which includes structured areas. Structured areas are those that were allotted by the township authority (cadastral services), with public services such as tap water and sanitation, electricity and telephone, and where parcels of land are allocated to inhabitants; unstructured areas refer to those developed with no cadastral organisation and without public services.
Stratification
The city was stratified so as to identify and select different ecological and environmental situations that would be representative of the urbanisation process. The first stratification criterion was the allotment status: structured areas compared to unstructured areas. This criterion was chosen as representing the notion of vulnerability of the population who resides in the city margin. The second stratification criterion was the building density that represents the notion of risk of infectious disease transmission. Although infectious diseases transmission is not directly related to the main topic of our paper (i.e. obesity), it was among the objectives of the entire study to deal with all aspects of the health transition. Also, building density may contribute to lowest physical activity (less far to walk to shops, commerce and facilities) and therefore may be directly of concern in the topic of obesity.
This stratification was carried out using a SPOT 5 satellite panchromatic image obtained in November 2002 with a resolution of 2·5 m, as well as aerial photographs of Ouagadougou and cadastral data from the Ministry of Urbanization of Burkina Faso. These data were verified and validated by field observations. The ERDAS® software for the analysis of satellite images and the ArcView® software to compute the density level were used for stratification. In this way, four strata were determined: unstructured and low building-density (ULBD), unstructured and high building-density (UHBD), structured and low building-density (SLBD) and structured and high building-density (SHBD) areas. In each stratum, two districts were selected for the study; thus, a total of eight districts were studied. The selection of the districts was based on their age (old or new) and position (central or peripheral). The age of the districts was determined by our previous geographical analysis of the urbanisation history of Ouagadougou since the beginning of the 20th century (unpublished data).
Sampling
In structured areas, parcels were randomly selected using cadastral data and a generated set of random numbers. In unstructured areas, starting points were selected using aerial photographs of Ouagadougou and pairs of generated random numbers, which corresponded to Global Positioning System (GPS) data points. Each data pair was located on the photographs; if the data pair corresponded to a household, this household served as a starting household, and the next three eligible households were included in the study. Eligible households were those whose heads were aged more than 35 years and had resided in Ouagadougou for at least 5 years. All adults aged 35 years or older in an eligible household were invited to attend a mobile health post. To assess obesity, a sample size of 384 individuals for each stratum was calculated to be adequate for measuring the prevalence of obesity, assuming an expected prevalence of 10 % with a precision of 3 %.
Data collection
A cross-sectional survey was implemented in two rounds (in April and October 2004), to take into account the health seasonal variations; data were pooled for the present analysis that focuses on obesity. A mobile health post was established in each area at the time of the survey; the health post team involved two sociologists who interviewed the participants, and a nutritionist who obtained anthropometric measurements, i.e. weight and height.
The questionnaire data were classified as follows: (i) household and individual characteristics (household equipment, age, gender, educational level, duration of residence in Ouagadougou); (ii) lifestyles (physical activity, social integration through involvement in a social network, risk-taking behaviours such as smoking, chewing tobacco and cola-nut, and drinking coffee and alcohol); and (iii) dietary practices (usual place where meals were taken, consumption practices with respect to a list of food groups). To assess physical activity, five variables were considered to take into account the domestic and professional tasks, as well as the leisure-time activities: use of motor vehicles or walking/bicycling, usual daily total walk time in the neighbourhood, participation in sports at least one time per week, water fetching, main professional occupation. Social integration is a way to manage the stress of urban living; it is also a way by which urban lifestyles are adopted; it was assessed during an interview dealing with the respondent’s active involvement in non-profit social groups or associations. To assess dietary practices, the respondents were merely interviewed regarding their consumption of a list of food items: cereals, tubers (yam, potato), legumes (bean, chickpea and lentil), vegetables, fruits, meat, fish, sugar-based drinks, cakes and sweetened products. Sugar-based drinks were defined as commercially produced juices or sodas and traditional drinks. These food groups were cited and the respondent was asked to answer whether the food item was consumed one or more times per day, one or more times per week or rarely/never; these answers were coded 2, 1 or 0, respectively.
Anthropometric measurements were performed using SECA® instruments, in accordance with the WHO recommendations(29).
Data analysis
Data were entered into a Microsoft Access 2000 database (Palisade Corp., Newfield, NY, USA), and analysed using SPSS 12.0 for Windows (SPSS Inc., Chicago, IL, USA). Obesity was defined as BMI ≥30 kg/m2. The main professional occupation was classified by the investigators after the interview as being physically active or not. In addition to education, an equipment index was created as another proxy of the socio-economic status, using the household possession of assets. Principal Components Analysis showed that the presence of telephone (mobile or not), television, refrigerator, ventilator, bed, living room and motorcycle loaded on the same component. Thus, these items were used to compute the equipment index. Cut-off points for the equipment index were chosen to create three approximately equal groups: high, medium and low equipment index. The dietary practice variables were also used to create three indices, which were categorised by taking into account their distribution shape: micronutrient-rich food consumption index (vegetables, fruits, meat and fish), sugar-rich food consumption index (sugar-based drinks, cakes and sweetened products) and protein-rich food consumption index (legumes, meat and fish). These indices were created by adding up the scores given to the frequencies of consumption of the considered food items.
The results are presented as weighted prevalence of obesity, thus taking into account the stratified design of the study. The weighting coefficient was calculated using population data obtained from the National Institute of Statistics and Demography for structured areas, and from our previous census in unstructured areas. To identify variables associated with obesity, we first performed a bivariate comparison of the prevalence of obesity using the χ 2 test. Variables associated with obesity with a P < 0·10 on bivariate analysis were then considered for logistic regression that was performed in two steps. First, three separate models were established with (i) household and individual characteristics, (ii) lifestyles and (iii) dietary practices. Second, a final model was established, including variables associated with obesity with a P < 0·05 in each separate model. In this final model, the interactions between area of residence and the other variables in the model were tested; none of these interactions was associated with obesity with P < 0·10. Odds ratios with 95 % confidence intervals were obtained from the final model and tested using Wald’s χ 2 test.
Results
A total of 2022 adults (76 % of those who were invited) from 1570 households were included: 482, 484, 579 and 477 from ULBD, UHBD, SLBD and SHBD areas, respectively.
The prevalence of obesity was 14·7 % but it was variable according to individual and household characteristics (Table 1). The prevalence of obesity was higher in females (21·9 %) in comparison to males (5·5 %), in adults with high household equipment index (24·3 %) in comparison to those with low household equipment index (6·1 %). The SHBD areas were associated with a higher prevalence of obesity (21·8 %), as compared to the SLBD (11·0 %), UHBD (8·7 %) and ULBD areas (5·8 %).
Table 1 Prevalence of obesity by individual and household characteristics

The prevalence of obesity varied according to lifestyles (Table 2). It was higher in adults using motor vehicle (21·1 %) in comparison to those who do not use (11·0 %), in adults who were not physically active (16·3 %) than in those who were physically active (2·6 %). Current risk-taking behaviours such as smoking, and chewing tobacco and cola-nut were associated with lower prevalence of obesity.
Table 2 Prevalence of obesity by lifestyles

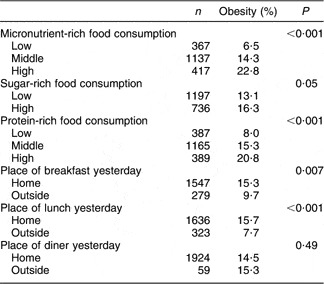
The prevalence of obesity differed according to dietary practices such as micronutrient- and protein-rich food consumption and to the place of meals (Table 3). Adults with high micronutrient-rich food consumption had higher prevalence of obesity (22·8 %) than those with low micronutrient-rich food consumption (6·5 %). Adults with high protein-rich food consumption had higher prevalence of obesity (20·8 %) than those with low micronutrient-rich food consumption (8·0 %).
Table 3 Prevalence of obesity by dietary practices
From adjusted analyses we found that age was an independent predictor of obesity; adults aged 65-years-old or more were less likely to be obese than 35–44-year-olds (Table 4). Gender was also associated with obesity: females were more likely to be obese than males (OR = 6·11; 95 % CI 4·17, 8·97). Other contributing factors to obesity were a middle (OR = 2·20; 95 % CI 1·44, 3·38) or a high (OR = 2·67; 95 % CI 1·70, 4·17) equipment index compared to a low equipment index, a middle (OR = 1·63; 95 % CI 1·01, 2·64) or a high (OR = 2·10; 95 % CI 1·25, 3·52) micronutrient-rich food consumption in comparison to a low micronutrient-rich food consumption, and usual transport with motor vehicles (OR = 1·96; 95 % CI 1·42, 2·71). Obesity was inversely associated with smoking, and chewing tobacco. Independent of factors such as age, gender, equipment index, usual transport with motor vehicle, smoking and chewing tobacco, obesity was associated with the area of residence. Individuals from SHBD areas were more likely to be obese than those from ULBD areas, but there was no significant difference in the prevalence of obesity between the SHBD areas and the SLBD or UHBD areas.
Table 4 Odds ratios of association of obesity with individual and household characteristics, lifestyles and dietary practices

Results of logistic regression.
The obesity-associated factors such as female gender, high equipment index, usual transport with a motor vehicle and high micronutrient-rich food consumption were more frequently observed in the SHBD areas than in the others areas (Table 5).
Table 5 Distribution of the obesity factors by area of residence

Discussion
The prevalence of obesity among the adult population of Ouagadougou calls for more consideration. The prevalence of obesity of 14·7 % is approximately half of the prevalence reported in developed countries. In countries where nutrition transition is fully advanced, such as the European Union and the USA, about one-third of adults are obese(30, Reference Baskin, Ard, Franklin and Allison31). The prevalence of obesity is similar to that in urban Ghana and Cameroon where about one woman out of five is obese(Reference Amoah7, Reference Fezeu, Minkoulou, Balkau, Kengne, Awah, Unwin, Alberti and Mbanya9–Reference Kamadjeu, Edwards, Atanga, Kiawi, Unwin and Mbanya11); it is lower than in urban Nigeria, Gambia and South Africa(Reference Afolabi, Addo and Sonibare4, Reference Siervo, Grey, Nyan and Prentice5, Reference Puoane, Steyn, Bradshaw, Laubscher, Fourie, Vicki and Mbananga12). Obesity is of particular importance among women (21·9 %). Although there were also underweight women (data not shown), there were more obesity cases than underweight among women. Mendez et al. previously reported a similar observation in many developing countries(Reference Mendez, Monteiro and Popkin32).
More concerning is the rapid evolution of obesity in urban Burkina Faso, given previous data. In 1992, obesity affected only 3·5 % of urban women aged 15–49 years in Burkina Faso(Reference Martorell, Kettel Khan, Hughes and Grummer-Strawn33). In 2000, the prevalence of obesity among individuals living in Ouagadougou who were more than 18 years of age was 7·3 %(Reference Zagre, Nebie and Niakara34). Despite methodological differences related to the setting (Ouagadougou or all urban areas of Burkina Faso) and the age category, these results strongly suggest a rapid increase in the prevalence of obesity in Ouagadougou. A rapid increase in obesity has already been described among women living in Dakar, another West African capital(Reference Holdsworth, Gartner, Landais, Maire and Delpeuch8). The likely increasing prevalence of obesity over the last years calls for intervention. This need to deal with obesity underscores Unwin’s assertion according to which ‘improved surveillance of all diseases within sub-Saharan Africa is needed in order to place non-communicable diseases properly within the context of the overall burden of disease’(Reference Unwin, Setel, Rashid, Mugusi, Mbanya, Kitange, Hayes, Edwards, Aspray and Alberti35).
Obesity was associated with the equipment index, which is a proxy of the socio-economic status. In countries with fully advanced nutrition transition, such as Europe, the risk of obesity is higher among low socio-economic-class individuals(30). In Ouagadougou, individuals from households with a middle or a high equipment index were more likely to be obese than those from households with a low equipment index. This result is consistent with other studies that indicated higher prevalence of obesity among high socio-economic-class residents in Accra (Ghana) and that the prevalence of obesity increased with quartiles of household amenities in Yaounde (Cameroon)(Reference Amoah7, Reference Fezeu, Minkoulou, Balkau, Kengne, Awah, Unwin, Alberti and Mbanya9). This reflects a beginning or an ongoing nutrition transition.
As far as dietary practices are concerned, in bivariate analyses obesity was associated, not surprisingly, with a more frequent consumption of micronutrient-rich or protein-rich foods. The association with sugar-rich food consumption was only at the limit of the statistical significance. This is probably due, at least in part, to the fact that the index only considered the frequency of consumption and not the quantity consumed (in terms of sugar content and the quantity of the product consumed at each meal), and to some difficulties in determining a cut-point to distinguish low or high consumers in this matter. In the final model, only micronutrient-rich food consumption remained statistically associated with obesity. We could argue that there is probably some colinearity between food consumption indices, because they were quite rough estimates of the real food consumption and people who usually eat more frequently ‘rich foods’ often eat more frequently several types of rich food.
Risk factors of obesity such as female gender, high equipment index, usual transport with motor vehicle and high micronutrient-rich food consumption, which were more frequent in SHBD areas, may have determined higher prevalence of obesity in this area. Obesity remained associated with the area of residence, independently of gender, equipment index, usual transport with motor vehicle and micronutrient-rich food consumption: residents in SHBD areas were more likely to be obese than those in ULBD areas. This may be due to that the adjustment factors were either not fully considered or they are not exhaustive. Other factors related to obesity may be present in an environment that promotes obesity. An obesogenic environment is one that promotes excessive food intake and discourages physical activity(Reference Hill and Peters36). It is a key concept in development in many countries, and it is related to the societal aspect of obesity. As Kushi said, ‘although epidemiology may continue to refine the potential role of factors of obesity, the research of effective measures for obesity prevention will need to consider the broader societal context in which obesity occurs’(Reference Kushi37). It is likely that the components of such an environment may vary from one context to another. Factors that contribute to the obesogenic environment in the SHBD areas in Ouagadougou would include availability of electricity, better access to public transportation (buses and taxis) and better access to publicity through media or posters.
The spatial distribution of age and gender of the studied areas reflects that of the whole population of Ouagadougou. This is consistent with data from the last national census, which indicated that young adults reside in the city periphery while old people reside in the centre, and that female gender is predominant in the centre.
The limitations of the study could be discussed as follows: although we were aware about the importance of the fat/oil consumption, the respondents were not asked for this because it was not easy according to the study design. As fat/oils are most often included in a preparation (sauces, fried products, etc.) and not consumed as such, it was more difficult to identify them as ‘food items’ in a list and also to quantify their frequency of consumption. This may represent a drawback of our study. Our definition of obesity was solely based on weight and height measurements while other definitions (i.e. based on waist circumference or waist-to-hip ratio) would have improved the estimates of obesity in the population. Water fetching is a very rough proxy for household physical activities. As the questionnaire for the entire study was rather long, we omitted some domestic tasks such as crushing or washing cloths that can represent hard physical activity.
In conclusion, these findings underline the fact that obesity is a preoccupant problem in Ouagadougou and calls for more consideration. The distribution of sociodemographic factors, such as age, gender, household equipment, transport with motor vehicles and dietary practices, led to part of the between-area differences in the prevalence of obesity. Furthermore, environmental factors might have contributed to this disparity as the area of residence is an independent risk factor. This supports the assumption that, in terms of health issues, cities are not homogeneous entities. There are ‘cities’ within the city, and mean values may hide important health disparities between city dwellers(Reference Salem38). Thorough investigation is needed to identify the environmental factors that are responsible for the higher frequency of obesity in the structured areas of the city.
Acknowledgements
Conflicts of interest:No conflict of interest is declared.
Source of funding:This study was financially supported by the Institut de Recherche pour le Développement (IRD, France) and also received a grant from the Ministry of Research, France.
Authors’ contribution:H.Z.O. was involved in the study design, fieldwork, data analysis, paper drafting and correction. F.F. was involved in the study design, fieldwork, data analysis and paper correction. Y.M.P. contributed to the data analysis and paper correction. J.G. contributed to the study design, fieldwork and data analysis. M.C.H. contributed to the study design, fieldwork and paper correction. G.S. was involved in the study design and paper correction.


