Introduction
Poverty alleviation has been a priority of governments for over a century and, since the Second World War, a priority of wealthier nations. The most recent manifestation of this priority is that poverty alleviation is first in the list of the UN Millennium Development Goals (2008), which were endorsed by over 150 heads of state. This recent surge of support has enlisted not only governments but also multilateral organizations, NGOs, private individuals and celebrities.
As poverty alleviation has reassumed pre-eminence on the international agenda it has created complex dynamics with an issue that used to be of global priority: biodiversity conservation (Roe, Reference Roe2008). Nowhere is this more obvious than in areas little affected by recent human impact (Agrawal & Redford, Reference Agrawal and Redford2006). There has been a strong push from some sectors and organizations for conservation organizations to become involved in poverty alleviation efforts, with some even stating that their agenda of conservation should be overwritten by an agenda of poverty alleviation (Sanderson, Reference Sanderson2004; Roe, Reference Roe2008). But this discussion has taken place largely in the absence of carefully reasoned or empirical examination of the thematic or spatial relationships between these two powerful societal goals.
Complicating the comparison between efforts to achieve conservation results and poverty alleviation is the lack of common metrics that would enable practitioners of poverty alleviation and practitioners of conservation to identify ways and places where both of their objectives can be met simultaneously. Despite this fact, there has been broad proclaiming of a set of conclusions claiming synergies between conservation and poverty alleviation that are empirical in nature but have not been tested (IUCN, 2002, 2005). In this paper we examine a set of these and ask what the results mean for conservation organizations concerned about poverty alleviation but working primarily in areas little affected by recent human activities.
Definitions of poverty vary, as do estimates and methods of measurement, but the World Bank (2001) has stated that 1.2 billion people are living on < USD 1 per day and 2.8 billion live on < USD 2 per day. Such statistics, and discussions of poverty, most often occur either at the global or nation-state level, with global data often necessarily broad and vague and national-level data much more specific. There is little discussion or data about where poor people live that is not aggregated at the level of the nation-state or region.
A new dimension in the analysis of the distribution of poor people has recently emerged: one that examines the spatial distribution of poverty across the urban-rural divide but focuses on the global scale. The World Bank (2001) has stated that of the 2.8 billion people living on < USD 2 per day, 70% of them are rural inhabitants, whereas IFAD (2001) estimates the number at 75% (a percentage reiterated by Ravallion et al., Reference Ravallion, Chen and Sangraula2007), and WRI (2005) states ‘the great majority’. The World Bank report Reaching the Rural Poor (2003) argued that in the future most population growth will occur in urban areas, with many of the rural poor moving to cities. Despite this, the Bank called for a renewed strategy for rural development, classifying the rural poor into: the landless, those with a low asset base or smallholders, pastoralists, rural women, and ethnic minorities and indigenous populations (World Bank, 2003).
Poverty has been elucidated in a number of different ways, and it has often been stated that many of those classified as poor live in rural settings. A new term (chronic poverty) distinguishes poverty by its extended duration. The chronically poor are said to be concentrated in areas characterized by a variety of factors, including remoteness and weak integration into the rest of society (Chronic Poverty Research Centre, 2005; Sunderlin et al., Reference Sunderlin, Angelsen, Belcher, Burgers, Nasi and Santoso2005). Remoteness has been also signalled as an important factor determining chronic poverty in sub-Saharan Africa (Woodhouse, Reference Woodhouse2002) and Bird et al. (Reference Bird, Hulme, Moore and Shepherd2002) argued that remote areas account for a substantial proportion of the chronically poor. As the Millennium Development Goal for poverty also specifies reduction of the number of people who are hungry Scherr et al. (Reference Scherr, White and Kaimowitz2003) examined the number and distribution of the world's hungry, finding that 50% of the hungry are in farm households, mainly in higher-risk production environments, and that 8% of the hungry are herders, fishers and forest-dependent households, in all > 100 million people worldwide.
Conservation and poverty alleviation
Important conservation objectives exist in all parts of the world, ranging from urban parks to agricultural landscapes and large forested areas. However, our focus here is conservation in areas largely untouched by recent human activity. These putatively rural settings that are of growing interest for poverty alleviation schemes are potentially the same less disturbed areas of interest to conservationists. However, as we discuss later, the condition of being rural is rarely defined, making analysis of poor people in non-urban settings difficult or impossible. Despite this, claims have been made about the spatial correlation between biodiversity and rural poverty (Naughton-Treves et al., Reference Naughton-Treves, Holland and Brandon2005; UNDP et al., 2005a) although, as is often the case, neither poverty nor biodiversity is adequately defined, making assessment of this claim impossible (Agrawal & Redford, Reference Agrawal and Redford2006). This purported relationship has caused some in recent years to insist that conservation should play a major role in poverty alleviation (Fisher et al., Reference Fisher, Maginnis, Jackson, Barrow and Jeanrenaud2005; Roe et al., Reference Roe, Hutton, Elliott, Saruchera and Chitepo2003), with even IUCN (2002) suggesting that conservation be put ‘to work for the poor’ or, in its more recent iteration, ‘conservation for poverty reduction’ (IUCN, 2006). Most of these arguments are based on ethical or value-based positions, rather than broad-scale, empirical analyses. Others have countered with similar value-based arguments (Sanderson, Reference Sanderson2004; Sanderson & Redford, Reference Sanderson and Redford2003, Reference Sanderson and Redford2004). What has been lacking is an empirical way to address the general question of the broad-scale spatial relationship between poverty occurrence and areas of interest to those seeking conservation of large, relatively wild areas.
Here we attempt an analysis of the question: What are the global spatial relationships between poor people and areas less impacted by recent human activity? To answer this general question we ask three specific questions: (1) What is the spatial relationship between human population and ecological intactness? (2) How does the relationship between poverty and ecological intactness vary by biome? (3) How does the relationship between poverty and ecological intactness vary by geographical region? We then use the results of the analysis to ask what role, if any, conservation organizations should play in poverty alleviation.
We position our approach within the larger discourse concerning poverty and the environment (cf. Agrawal & Redford, Reference Agrawal and Redford2006). We are interested in investigating the global patterns in recent human impact and the spatial distribution of poor people, and use proxies for both dimensions. The issue of defining poverty is one that has occupied many people, including the poor themselves (cf. Narayan, Reference Narayan2000), and comprehensive dimensions have been promulgated by many. The World Bank (2001) uses a definition with multiple dimensions encompassing not only low income and consumption but also low achievement in education, health and nutrition, and including powerlessness, voicelessness, vulnerability and fear. Despite the broad recognition of this multidimensionality all quantitative analyses use proxies, most often daily income or, in our case, infant mortality rate, an approach used by others (cf. Storeygard et al., in press). We carefully use the term ‘wild’, modifying it with ‘extremely’ and ‘somewhat’ to describe those areas least impacted by modern humans as measured by the Human Footprint (see below). As such, this is a term deriving from our quantitative analysis. Our analysis is a snapshot of current conditions and does not attempt to explain why poor people are located where they are or how the patterns of human impact have occurred. We also do not examine whether conservation organizations have been responsible for some of the poverty in areas where they work (cf. Brockington & Igoe, Reference Brockington and Igoe2006; Redford & Fearn, Reference Redford and Fearn2007). Although important, these are topics for other analyses.
Methods
Poverty
Infant mortality rates serve as a useful proxy for overall poverty levels because they are highly correlated with poverty-related metrics such as income, education levels and health status of the population (Dasgupta, Reference Dasgupta1993; Balk et al., Reference Balk, Deane, Levy, Storeygard and Ahamed2006). Infant mortality rates measure the number of deaths of infants < 1 year of age per 1,000 live births in a given year. Globally, national-level infant mortality rates range from a low of 3 to > 150 in countries suffering chronic food deficits or conflict. A global gridded infant mortality rate map at 0.25 degree resolution, baselined to the year 2000 and based on 10,370 reporting units, was compiled by CIESIN (2005; Fig. 1a). Previous studies have used this database to explore poverty rates by ecosystem type (Levy et al., Reference Levy, Babu, Hamilton, Hassan, Scholes and Ash2005) and around protected areas (de Sherbinin, Reference de Sherbinin2008).
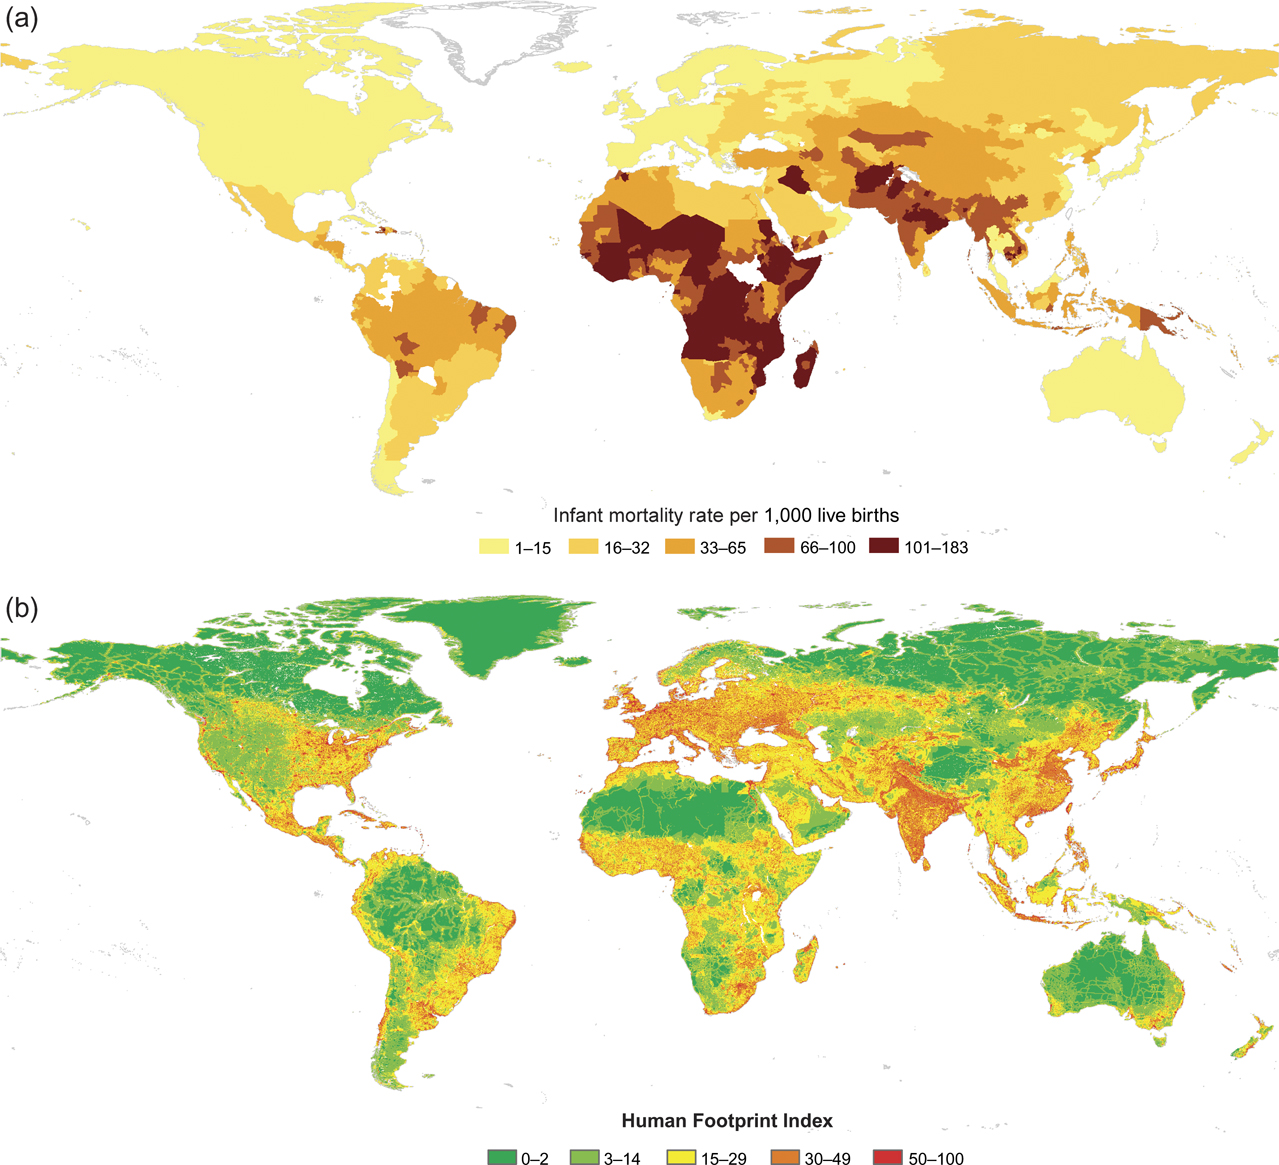
Fig. 1 (a) Global infant mortality rates for the year 2000, in deaths per 1,000 live births (Storeygard et al., in press). The data are based on infant mortality rate estimates for 10,370 reporting units, and are categorized here according to the poverty groupings used in this analysis (Table 1). Although most of the units are sub-national, there are many (mainly small countries) that are not. (b) Human Footprint Index, which is a composite quantitative evaluation of recent anthropogenic influence on land, based on geographical data describing human population density, land use, transportation, and power infrastructure, normalized across a 0–100 scale and then divided into quintiles of human impact (Table 1). For further details see Sanderson et al., Reference Sanderson, Jaiteh, Levy, Redford, Wannebo and Woolmer2002.
The infant mortality rate data are at a relatively coarse scale, with some countries having no sub-national reporting units, and many having only 2–5 sub-national units. The finest resolution infant mortality rate data are available for Brazil, Mexico and China, with 4,407, 2,409 and 2,367 sub-national units, respectively. Of the 199 countries included, the average number of sub-national units for all countries is 52.5 but 119 countries have only 1 unit (including some large developing countries such as the Democratic Republic of Congo, Iraq and Malaysia) and another 12 have < 5 units. Thus, this analysis is limited by the spatial resolution of the available infant mortality rate data.
We used CIESIN's (2005) global sub-national infant mortality rate database to assign quarter-degree grids to poverty rate groupings. These were divided into quintiles of infant mortality rate (Table 1). These groupings were then used to assign poverty levels to populations based on Gridded Population of the World, v. 3 (CIESIN & CIAT, 2005). The result was a grid of population by poverty level at a quarter-degree resolution.
Table 1 Categories used in determining the spatial relationship between human population and ecological intactness. Infant mortality rates measure the number of deaths of infants under 1 year of age per 1,000 live births in a given year and are from CIESIN (2005), divided into quintiles of infant mortality rate. Human impact categories are from the global Human Footprint data (Sanderson et al., Reference Sanderson, Jaiteh, Levy, Redford, Wannebo and Woolmer2002), divided into quintiles of human impact.
We compared national-level infant mortality rate with estimates of USD 1 per day and USD 2 per day poverty rates. At a national level, infant mortality rate is significantly correlated with both income-based poverty measures (USD 1 per day: R=0.752, P < 0.01; USD 2 per day: R = 0.793, P < 0.01) using 2000 data. These high correlations enable us to use infant mortality rate as a useful proxy for poverty that, unlike income-based measures, can be portrayed on a global sub-national map.
Human influence
The best global measure of recent human influence is the Human Footprint (Sanderson et al., Reference Sanderson, Jaiteh, Levy, Redford, Wannebo and Woolmer2002), derived from analysis of four main factors: human population density, land use and settlement patterns, access from roads, rivers and coast, and power infrastructure (Fig. 1b). The Human Footprint has been used as a measure of recent human impact on the Earth's natural resources; for example, as a measure of ecosystem domestication (Kareiva et al., Reference Kareiva, Watts, McDonald and Boucher2007) and of threat (Burgess et al., Reference Burgess, Balmford, Cordeiro, Fjeldså, Küper and Rahbek2007), and as a conservation planning tool to find wild places less affected by human activities (Brooks et al., Reference Brooks, Mittermeier, da Fonseca, Gerlach, Hoffmann and Lamoreux2006; Sanderson et al., Reference Sanderson, Jaiteh, Levy, Redford, Wannebo and Woolmer2002).
Using the Human Footprint data (Sanderson et al., Reference Sanderson, Jaiteh, Levy, Redford, Wannebo and Woolmer2002) we divided the world into quintiles of human impact (Table 1). Although the dividing lines between these categories are somewhat arbitrary, they break the gradient into identifiable classes. For example, all intensely developed urban areas in the world have Human Footprint scores > 49, and the extremely wild areas are associated with the least developed and most remote parts of the Amazon rainforest, Sahara desert and Russian taiga.
The Human Footprint analysis used data for 1990–2000 at 1 km2 resolution, which is not an exact temporal match to the infant mortality rate data at a resolution of 0.25 degrees. We therefore calculated average Human Footprint values at 0.25 degrees to create a harmonized data set. As a measure of landscape transformation, the Human Footprint is limited in the factors it includes; e.g. it does not include effects of climate change or pollution.
Biomes and regions
To examine the distribution of poor people according to ecology and geography we conducted analyses based on a biome map of the world (Olson et al., Reference Olson, Dinerstein, Wikramanayake, Burgess, Powell and Underwood2001) and a geographical region map.
Results
What is the spatial relationship between human population and ecological intactness?
The results of this analysis are depicted in Fig. 2. Several conclusions emerge: (1) The majority of people (85%) live in very and extremely transformed areas. Only 1.2% live in extremely and somewhat wild areas. (2) The very poor and extremely poor (henceforth ‘most poor’) make up 28.1% of the global population. (3) The largest number of the most poor are found in very transformed areas (70% or 1,195 million), not in extremely transformed areas (9.3% or 160 million). (4) Very few of the most poor live in regions that are classified as somewhat (14.5 million or 0.2%) or extremely wild (1.8 million or 0.03%). The total number of very poor found in somewhat and extremely wild areas is 16.3 million (0.95% of the most poor and 0.27% of the world's total population). These results demonstrate that, relatively speaking, the vast majority of the most poor are found in or near urban areas. Only 0.25% are found in extremely or somewhat wild areas.
Fig. 2 Population (millions) by poverty and wilderness categories (Table 1).
Because the Human Footprint is in part based on the spatial map of human population density, it may not be surprising that there are more poor people in the most human-influenced areas. We found, however, that observed distribution of poverty for the Human Footprint categories is different from an assumed even distribution (extremely transformed, χ2 = 1075.8, P < 0.01; very transformed, χ2 = 267.3, P < 0.01; not wild, χ2 = 76.3, P < 0.01; somewhat wild, χ2 = 10.3, P < 0.05). Only in the extremely wild category is the statistical distribution of poverty the same as an even distribution, probably because there are so few people in such areas. In other words, the distribution of poverty with respect to the Human Footprint is not only a result of the definition of the Human Footprint map: there are more poor people in developed areas than would be expected.
How does the relationship between poverty and ecological intactness vary by biome?
The greatest number of the most poor (661 million) are found in the tropical and subtropical moist broadleaf forest biome (Table 2). The second-ranking biome is desert and xeric shrubland (329 million), followed by tropical and subtropical grasslands, savannahs and shrublands (323 million), and tropical and subtropical dry broadleaf forest (224 million). Together these four biomes contain 90% of the world's most poor. The seven forest biomes (excluding Mediterranean but including mangroves) contain 57% of the most poor, with tropical and subtropical moist forest representing the vast majority of the forest group and 39% of the overall total of the most poor.
Table 2 Number (millions of people) of the most poor (very poor and extremely poor; Table 1) by biome, ordered by total from most to least. Entries of 0.0 reflect populations too small to be included.
Within each biome the distribution of the most poor in relation to the two wildest categories of the Human Footprint (Table 3) shows that the greatest number of the most poor live in tropical and subtropical grasslands, savannahs and shrublands (7.3 million). Second and third are tropical and subtropical moist broadleaf forest and desert and xeric shrublands (3.3 million each), and fourth is montane grasslands and shrublands (1.2 million). When looking only at the extremely wild category, desert and xeric shrubland have the highest number of the most poor (0.7 million), followed by tropical and subtropical grasslands, savannahs and shrublands (0.6 million), and tropical and subtropical moist broadleaf forests (0.3 million).

How is the relationship between poverty and ecological intactness affected by geographical region?
Examination of the distribution of the most poor in the most wild areas by developing country region (Table 4) shows that the highest total number are found in Central and Eastern Africa (49% of the total). In total, Africa contains 69.7% of the most poor in the most wild areas, followed by Asia with 25%. Note that regions such as Central America and the Caribbean are missing because they either did not have any remaining most wild areas in the biomes that prevail in those regions, or there were no most poor people residing within the wild areas that do exist.
Table 4 Number (millions of people) of the most poor (very and extremely poor; Table 1) that live in the most wild areas (somewhat and extremely wild; Table 1), by geographical region, ordered from most to least.
The 25 groupings by region and biome that together encompass 90% of the world's extremely poor populations (Table 5) show that most of these people are found in the tropical grassland and forest biomes of sub-Saharan Africa and Asia, the majority in areas with very or extremely transformed Human Footprints. The cumulative percentages show that 62% of the extremely poor are in very transformed areas, and that 72% of the extremely poor people in very transformed areas are in Africa.
Discussion
There is a large literature on poverty alleviation but relatively little that addresses the distribution of poor people in relation to ecology and degree of human impact. Recent work on poverty mapping has begun to change this, although most of this work addresses a scale ranging from the site to the country and focuses on spatial representations of poverty per se, noting the potential power of using this mapping to make comparisons with biophysical features (Henninger & Snell, Reference Henninger and Snell2002; WRI et al., 2007; Poverty Mapping, 2008). To our knowledge our analysis is the first attempt to explicitly examine the global relationship between the geographical distribution of the world's poor and the most ecologically intact areas. We have chosen to focus on these areas least affected by humans as they are of particular interest to much of the world's international conservation community (Redford et al., Reference Redford, Coppolillo, Sanderson, Da Fonseca, Dinerstein and Groves2003), although we acknowledge that conservation work is important in all parts of the world and at all scales of human impact.
There are some caveats to our analysis. Our comparison is limited by the quality and nature of the available data. Infant mortality rate is only a proxy for poverty levels and, although it tracks poverty levels well, it is also affected by access to health facilities and overall environmental sanitation conditions, which are not always directly related to poverty. Other metrics of poverty include unsatisfied basic needs, family income in relation to poverty lines, household assets, and outcome measures such as malnutrition, but data for these are not widely available at sub-national levels nor are they as directly comparable across countries as infant mortality rate. Our approach is a representational one that values biodiversity throughout the world and does not place a greater value on areas of particular species diversity or ecosystem type. As discussed below, our analysis does not equate biodiversity value with lack of recent human impact. However, our approach does place value on the conservation of areas of relatively little human impact, a position reflecting the priorities of the Wildlife Conservation Society. A final caveat is that the Olson et al. (Reference Olson, Dinerstein, Wikramanayake, Burgess, Powell and Underwood2001) map is of potential, not actual biomes. Land transformations for agriculture, infrastructure and urban areas have significantly altered the actual biomes found in any given location. Clearly the biomes are more likely to reflect actual vegetation in those regions with the lowest human influence indices.
The results of our analysis are not surprising in showing that the majority of the world's people live in areas that are transformed by human activity. Worldwide there is a movement of poor people from rural areas into urban zones (UNFPA, 2007) and predictions are that poverty will continue to be more urban over time (Ravallion et al., Reference Ravallion, Chen and Sangraula2007). Whereas the majority of the world's poor live in extremely and very transformed (peri-urban) areas, most live in the latter (1.24 billion) rather than the former (233 million). In other words, the greatest concentrations of the poor are on the edges of cities. Perhaps more surprising is that only 0.25% of the world's poorest are found in areas that are somewhat or extremely wild. This finding has important implications.
The definition of rural
Use of the term rural is most often colloquial, being used to describe a general landscape appearance that contains people and agricultural systems. There appear to be no operational definitions for rural that would allow quantitative analysis. Despite this, the term remains a powerful component of writings on the spatial patterns of poverty. A 2003 World Bank report (World Bank, 2003) states that the boundaries between urban and rural are constantly shifting, and Salvatore et al. (Reference Salvatore, Pozzi, Ataman, Huddleston and Bloise2005) concluded that there are no global standards for even defining what is rural and urban. Demographers have also discussed the issue of the urban-rural dichotomy, recognizing that the transition from high to low population densities is a continuum (Hugo et al., Reference Hugo, Champion and Lattes2003; Montgomery, Reference Montgomery2008). Despite these complexities, development agencies are promoting a re-emphasis on rural poverty alleviation. For example, the World Bank's Reaching the Rural Poor: A Renewed Strategy for Rural Development (2003) proposes to revitalize the Bank's activities in rural areas, with an emphasis on the rural poor. The reason for this focus is that some of the poor people, and often the poorest, live in settings that would qualitatively be called rural (Okidegbe, Reference Okidegbe2001). The focus on rural poor meets the growing emphasis on addressing hunger, which provides a different set of ways to classify rural populations (Scherr et al., Reference Scherr, White and Kaimowitz2003).
Our results demonstrate where poor people live in relation to areas of the world less affected by humans, according to the Human Footprint, and facilitates a qualitative examination of how this pattern compares with claims about the spatial distribution of poor people as predominantly rural. Our results show that rural is not equivalent to wild as defined by the Human Footprint. Rather, rural includes many people in categories that we map as not wild and somewhat transformed, as opposed to the wildest areas, where there are actually few people. Acknowledging this difference is key in the discussion of possible synergies between poverty alleviation groups and conservation groups working across the gradient of human influence. Definitive resolution requires a definition of rural that will allow explicit, global-scale mapping and analysis.
Another term that has been used in associated discussions is remoteness, which is usually defined in terms related to market integration, low agricultural potential, lack of infrastructure and political marginalization (IFAD, 2001; Chronic Poverty Research Centre, 2005; Sunderlin et al., Reference Sunderlin, Angelsen, Belcher, Burgers, Nasi and Santoso2005). Given the underlying variables used in calculating the Human Footprint, particularly roads, power infrastructure and land-use change, our designations of extremely wild and somewhat wild probably accord well with the general definitions of remoteness. From the perspective of poverty alleviation, the main focus should be in peri-urban areas, where the majority of poor people live. People living on the edge of large cities have problems such as lack of access to water and natural resources, violent environments and air pollution (Baharoglu & Kessides, Reference Baharoglu, Kessides and Klugman2002). Meeting these needs is outside the expertise of conservation organizations but directly within the mandate of many development organizations.
Ecogeography of poverty
Claims are commonly made that the poor are distributed in areas of high biodiversity. This claim is made in a variety of ways, including the coincidence of poor countries and ‘the majority of the world's biodiversity’ in the Southern hemisphere (Roe & Elliot, Reference Roe and Elliot2005). Some mapping exercises have made claims about the relationship between biodiversity and poverty. For example, such exercises reveal ‘areas of poverty coinciding with high levels of biodiversity, indicating a potential for increased well-being from natural wealth’ (UNDP et al., 2005b). This claim of coincidence is used to justify conservation work in areas of high poverty, an assertion rarely empirically tested.
None of these claims are explicit about their definitions of biodiversity (Redford & Richter, Reference Redford and Richter1999) or its distribution. The extensive literature on this topic demonstrates that (1) biodiversity is more than species richness, and includes ecosystems and genetic diversity (Redford & Richter, Reference Redford and Richter1999), (2) species richness of all groups is not coincident, and not always highest in tropical areas, in forests, in the Southern hemisphere or in areas of lowest human density (Balmford et al., Reference Balmford, Moore, Brooks, Burgess, Hansen and Williams2001; Ceballos & Ehrlich, Reference Ceballos and Ehrlich2006), and (3) conserving representative samples of biodiversity requires working in all biomes. Therefore, the posited simple overlapping relationships between biodiversity and poverty are much more complicated than simple statements suggest.
There is biodiversity of value almost everywhere, even if the values are local rather than global, and therefore conservation is required almost everywhere. However, the distribution of wildness and the distribution of biodiversity (in its different definitions) are not the same; rather they reflect two different ways of framing priorities for biodiversity conservation (Brooks et al., Reference Brooks, Mittermeier, da Fonseca, Gerlach, Hoffmann and Lamoreux2006). An emphasis on conserving wild places focuses on saving places that are the least threatened, where the ecosystem services and biodiversity are likely to be most intact and have the least conflict with people (Sanderson et al., Reference Sanderson, Jaiteh, Levy, Redford, Wannebo and Woolmer2002). What remains as wild today is a result of human history, population growth and economic and technological development. Biodiversity is distributed with respect to factors related to latitude, climate, ecosystem type and biogeographical history (Huston, Reference Huston1994; Gaston & Spicer, Reference Gaston and Spicer2004). Because wildness and biodiversity are not always coincident, there is an opportunity to build conservation efforts that take advantage of both sets of factors, i.e. to conserve the wildest remaining examples of the world's biological diversity, the ‘last of the wild’ (Sanderson et al., Reference Sanderson, Jaiteh, Levy, Redford, Wannebo and Woolmer2002).
However, to what extent are the results of our analysis that focus on wilder areas indicative of overall conservation concern? Such work focuses on protecting large, relatively undisturbed natural areas with a full complement of species, interacting in ecologically significant ways, and can only be pursued in areas with relatively little recent human impact. To gain a better understanding of what portion of conservation work this might entail, we examined how protected areas were distributed in relationship to the least disturbed areas of the terrestrial surface. We calculated that 72.4% of the land in the world's protected areas (from the World Database on Protected Areas; WPDA, 2008) found in the more restrictive categories 1a (Strict Nature Reserve), 1b (Wilderness Area) and 2 (Ecosystem Conservation and Protection) coincides with the extremely wild and somewhat wild categories of the Human Footprint. Although we do not have measures of conservation investment per se, this high percentage shows that the results of our analysis of conservation and poverty coincidence are relevant across a significant portion of the conservation landscape.
We use a classification of the world's biomes to represent the potential distribution of biodiversity (Olson et al., Reference Olson, Dinerstein, Wikramanayake, Burgess, Powell and Underwood2001), reflecting 14 roughly equivalent categories of ecological system types, from desert through grassland to forest, on all continents. The seven forest biomes contain 57% of the most poor, mostly in the tropical and subtropical moist forests. Because of the number of poor people living in forest biomes it has been said that addressing poverty means working in forests (cf. World Bank Group, 2002; Vedeld et al., Reference Vedeld, Angelsen, Sjaastad and Kobugabe Berg2004). Sunderlin et al. (Reference Sunderlin, Angelsen, Belcher, Burgers, Nasi and Santoso2005) lay out this case, although they admit there is scant documentation and conclude that chronic rural poverty and natural forests overlap because of an interweaving of remoteness, forest dependent economies, immigration, forests as refuges and the open-access nature of many forest settings. Scherr et al. (Reference Scherr, White and Kaimowitz2003) estimate that 90% of the poorest people depend on forest resources for their livelihood security. However, Chomitz (Reference Chomitz2007) shows that highly forested areas are not always areas of high poverty, and Geist & Lambin (Reference Geist and Lambin2003) find that poverty generally is not a driver of tropical deforestation. The relationship between forests and poverty is more complicated than previously supposed.
For example, our analysis shows that, when combined, the greatest number of people in the most poor category in wild places live in forested wild places. However, the data also show that a large percentage of the poorest people are found in non-forest biomes, particularly grassland and shrubland. When considering only the most wild places, tropical and subtropical grasslands, savannahs and shrublands are host to the largest number of most poor people. The bias towards tropical forest biomes that has typified much conservation and development work has begun to shift, as reflected in recent interest in grassland conservation and the plight of pastoralists (cf. World Initiative for Sustainable Pastoralism, 2008). Our results reinforce the points made above that although forests are of importance, grassland areas are also of great importance when looking for areas where poor people and largely intact natural systems co-occur.
Africa has the largest number of most poor people, with the largest number in Central Africa (4.3 million) followed by East Africa (3.8 million). All other regions contain less than half of these totals.
Conservation organizations and poverty alleviation
In the last two decades poverty alleviation has largely superseded biodiversity conservation as a global issue (Sanderson & Redford, Reference Sanderson and Redford2003). Although much has been written about the relationship between these two, many of the claims have not been based on careful examination of the data (Agrawal & Redford, Reference Agrawal and Redford2006). Some have advocated that conservation organizations should retool their activities to assume the tasks of poverty alleviation (IUCN, 2002; Roe et al., Reference Roe, Hutton, Elliott, Saruchera and Chitepo2003). This has been based on one of two convictions: either that poverty alleviation is a more important activity than biodiversity conservation, or that poverty is a driver of threats to biodiversity. Discussion of the first of these convictions is a value-based proposition that cannot be informed by science. The second conviction is strategic and amenable to analysis.
The belief that conservation organizations must engage in poverty alleviation is based on the following claims: The dominant claim is that biodiversity is equivalent to ‘the environment’, with environment being defined as a set of characteristics that are all of direct importance to human well-being (cf. World Bank, 2001). If this were true then conservation organizations would need to work in places, and on issues, that are of importance to people. Because it assumes that activities of the poor threaten the environment, conservation organizations should focus on the poor. This logic has already been embraced by some and resulted in initiatives such as the ‘poverty-environment partnership’ (UNDP et al., 2005a) and the effort for ‘sustaining the environment to fight poverty and achieve the MDGs [Millennium Development Goals]’ (UNDP et al., 2005b).
A second claim for why conservation organizations should work on poverty alleviation is the assertion that there is a moral imperative for international conservation groups from wealthier countries to tackle human needs in the areas in which they work. This might be termed the ‘pro-poor conservation agenda’, as exemplified by the work of Roe et al. (Reference Roe, Hutton, Elliott, Saruchera and Chitepo2003) and Roe (undated). A final more recent claim, and a version of the first, is based on choosing one of the dimensions of biodiversity (ecosystem function; Redford & Richter, Reference Redford and Richter1999), relabelling it as ‘ecosystem services’, and urging conservation organizations to protect these as a means of alleviating poverty (cf. Pagiola et al., Reference Pagiola, Arcenas and Platais2005; IUCN, 2006; Ash & Jenkins, Reference Ash and Jenkins2007). To some conservation organizations these arguments are compelling. For example, a recent report from WWF-UK (2005) was entitled Making the Environment Work for the Poor.
There is a recent surge in this insistent call for conservation organizations to take up the cause of poverty alleviation (Kaimowitz & Sheil, Reference Kaimowitz and Sheil2007), with some heeding this call (Kareiva & Marvier, Reference Kareiva and Marvier2007). But underlying many of these arguments is an unrecognized legerdemain that could result in conservation organizations moving from their conservation mission and inexorably becoming development/poverty alleviation organizations, focusing only on those parts of the natural world of direct value to the greatest number of people. There are a plethora of organizations devoted to relieving poverty and they should be actively encouraged to extend their traditional approach to incorporate the environmental dimensions of their work. In some cases (e.g. CARE in Africa) this is taking place. Poverty alleviation is a vital strategy for achieving conservation goals but great care must be taken before conservation organizations assume the explicit goal of alleviating poverty. The challenge of alleviating poverty is enormous, and poverty alleviation organizations have not resolved it despite decades of work and billions of dollars. Conservation organizations themselves have an enormous challenge in working to save the full spectrum of nature on which all of humanity depends. Both groups should work with the poor, identifying how they can be effective actors in both development and conservation. Finally, with < 1% of the world's most poor found in extremely and somewhat wild areas, if conservation organizations working in these areas were to convert their work to poverty alleviation they would be contributing insubstantially to global poverty alleviation goals.
Conservation organizations and poverty alleviation in remote settings
What is the relationship between people living in remote settings and conservation implementation? Many organizations link the two, stating: ‘First and foremost, poor people must be seen as part of the solution rather than part of the problem’ (DFID et al., 2002). Conservation organizations must determine ways to remain true to their missions while still contributing to the vital task of helping to alleviate poverty. They must do so in ways that do not simply relive the mistakes of a decade of integrated conservation and development projects (Wells et al., Reference Wells, McShane, Dublin, O'Connor, Redford, McShane and Wells2004), an approach uninformed by the specific forces of institutional ecology, development and history.
Part of the answer to this question may lie in the fact that the areas of interest to some conservation organizations are those with the least amount of recent human modification: the most wild areas. From a human population perspective these areas are often the most remote, risk-prone, marginal and lacking in infrastructure. These areas have been called ‘spatial poverty traps’ (Scott, Reference Scott2006) because they have the lowest human population density, which, combined with the lack of access, makes them less attractive as areas for delivery of development assistance or for work by development organizations. Conservation programmes with long-term commitments to sites or species in remote, wild areas may be able to facilitate partnerships with development and health care organizations to provide assistance to remote and marginalized poor people, helping to spring them from these poverty traps (Cincotta & Engelman, Reference Cincotta and Engelman2000; Sanderson & Redford, Reference Sanderson and Redford2003).
Poor people in remote locations are also often disadvantaged by lack of stable tenure or access rights to resources (Scherr et al., Reference Scherr, White and Kaimowitz2003). Even though establishment of conservation areas has often been blamed for extinguishing the rights of such disadvantaged people, many conservation activities seek to stabilize tenure rights for the purposes of conservation, activities that can help the poor. There is increasing interest among the conservation community in addressing the need for stable resource rights (Redford & Fearn, Reference Redford and Fearn2007) and working with a variety of stakeholders to establish protected areas of the full range of categories under a broad range of management types (Borrini-Feyerabrand et al., Reference Borrini-Feyerabend, Kothari and Oviedo2004).
Conservation organizations are recognizing the importance of stable land use systems surrounding protected areas and working to establish ‘sustainable landscapes’ that incorporate parks and agricultural, forestry, fishing and grazing areas in configurations that maximize the conservation of all components of biodiversity within and outside the parks (sensu Redford, Reference Redford, Petersen and Huntley2005; WCS, 2006). This framework means that conservation organizations can work with partners in remote areas to ensure sustainable rural livelihoods that jointly address poverty and conservation objectives (Scherr, Reference Scherr2000) and reduce environmental health risks (Bass et al., Reference Bass, Reid, Satterthwaite, Steele, Bass, Reid, Satterthwaite and Steele2005; Osofsky, Reference Osofsky2005). Working towards sustainable rural livelihoods could include economic incentives for poor people in and near protected areas to engage in good environmental management (WRI, 2005).
Of particular interest are the herders, fishers and forest-dependent households representing 8% of the world population suffering from hunger (Scherr et al., Reference Scherr, White and Kaimowitz2003). Scherr et al. suggest that the greatest return to hunger alleviation efforts would be achieved by helping forest dwellers in the Himalayas, Amazonia, Mesoamerica and South-east Asia, herders in Africa and central Asia, and fishers in South-east Asia. Many of these people are characterized by Chomitz (Reference Chomitz2007) as part of the ‘poverty-forest syndrome’: those living in relatively undisturbed forest at population densities of 1–2 per km2. Many of these people are indigenous (Molnar et al., Reference Molnar, Scherr and Khare2004), live in remote areas and directly rely on natural resources, making it important for conservation organizations to work with them.
But it is vital to use caution when contemplating the synergies between conservation and poverty alleviation. The present decade's ambitions are often restated development goals that were missed in previous decades (Roe & Elliot, Reference Roe and Elliot2005). Poverty alleviation is the responsibility of the nation-state and well beyond the capabilities of individual conservation organizations (Sanderson, Reference Sanderson2004). There may be areas and circumstances where this synergy is present, but it will not be everywhere (Fisher et al., Reference Fisher, Maginnis, Jackson, Barrow and Jeanrenaud2005). As Bird et al. (Reference Bird, Hulme, Moore and Shepherd2002) argue, ‘place matters’, and identity, opportunity, history and ecology all vary with place. Limited analyses comparing countries reinforces this caution (Dasgupta et al., Reference Dasgupta, Deichmann, Meisner and Wheeler2005). Broad-brush solutions, so popular in the policy arenas, have not produced results and promise only more externally formulated projects with expansive aspirations and vague generalities that founder on the particularities of place and the short attention span of donors. Conservation engagement with poverty alleviation must be nuanced by the drivers of ecology, geography, politics and history and be prepared for long-term, responsive and adaptive commitment.
Some have begun to call for more careful approaches to the complicated interdigitation of poverty and conservation (Adams et al., Reference Adams, Aveling, Brockington, Dickson, Elliot and Hutton2004). Chomitz (Reference Chomitz2007) has suggested experimenting with new means of providing services and infrastructure to low density populations, something that conservation organizations working in remote areas are in a position to do (Sanderson & Redford, Reference Sanderson and Redford2003). It is imperative for conservation organizations to demonstrate that they are socially responsible, with a keen sense of the need to improve the lot of some of the world's poorest people, while not straying from their responsibility towards the conservation of biodiversity.
Conclusion
Our analysis shows that priority areas for conservation of relatively wild nature coincide with areas inhabited by relatively few of the world's poorest people (< 0.5%). As a result, substantially retooling conservation organizations to deliver poverty alleviation goals would produce only marginal gains at the global scale and would severely compromise conservation missions. Many of the policy pronouncements linking poverty alleviation and conservation currently being proposed do not recognize this fact.
However, although the relative percentage of poor people is small, there are still c. 16 million poor people living in the world's remotest regions. They are orphans of the major development assistance programmes because of their remoteness and low population densities. These same factors draw conservation organizations to the areas where they live, giving potential to an unusual synergy between conservation and poverty alleviation goals. Adams et al. (Reference Adams, Aveling, Brockington, Dickson, Elliot and Hutton2004) have pointed out that although achieving the goals of both poverty alleviation and conservation is difficult, there may be specific institutional, ecological and developmental circumstances under which this is possible. Wild areas present opportunities to test such circumstances. Impoverishment of both nature and people can serve as a rallying cry for a new socially responsible, long-term approach to conservation of the world's wildlife and wild places.
Acknowledgements
We have had assistance from reviewers and numerous colleagues. We would like to single out Catherine Grippo for her patience and unflagging assistance.
Biographical sketches
Kent Redford's expertise lies in conservation strategies, park-based conservation, traditional resource use, poverty alleviation and conservation, subsistence wildlife use and South American mammals. Marc Levy leads work on water-conflict linkages, anthropogenic drivers of emerging infectious diseases, climate vulnerability and other projects seeking to understand human-environment interactions in a context of global change. Eric W. Sanderson is a landscape ecologist, conservation planner, and cartographer. His interests are in developing sustainable relationships between humanity and the rest of nature at all scales. Alex de Sherbinin's research focuses on human-environment interactions, with an emphasis on human population dynamics and the environment, social aspects of conservation, remote sensing applications relevant to environmental treaties, and environmental sustainability indicators.