


Vitamin D is essential for the regulation of serum calcium, phosphate and alkaline phosphatase, and thus helps to produce and maintain bone(Reference Bischoff-Ferrari, Giovannucci, Willett, Dietrich and Dawson-Hughes1–Reference Hashemipour, Larijani and Adibi3). It has also been associated with the prevention of certain cancers, diabetes mellitus, autoimmune disorders, CVD and osteoporosis(Reference Bischoff-Ferrari, Giovannucci, Willett, Dietrich and Dawson-Hughes1, Reference Holick4). Different studies have observed that there is an inverse correlation between vitamin D and BMI and fat mass(Reference Zemel, Shi, Greer, Dirienzo and Zemel5, Reference Parikh, Edelman, Uwaifo, Freedman, Semega-Janneh, Reynolds and Yanovski6). It could be explained because an adequated vitamin D status results in lower blood parathyroid hormone, diminishing calcium influx into the adipocytes and increasing lipolysis(Reference Zemel, Shi, Greer, Dirienzo and Zemel5). An improvement of vitamin D status, especially when trying to lose weight, may contribute to regulating the accumulation of fat(Reference Hashemipour, Larijani and Adibi3–Reference Teegarden, White and Zemel7).
The aim of the present work was to analyse the repercussion of vitamin D status on the loss of body fat in young overweight/obese women group following two slightly hypocaloric diets.
Materials and methods
Study subjects
The study subjects were sixty women aged 20–35 years. According to the requirements of the Ethics Committee of the Faculty of Pharmacy, all subjects signed a witnessed form of consent to be included.
The study was performed during the winter (November to March).
Interventions
The experimental diets to which the subjects were randomly assigned were designed to provide a mean of approximately 20 % less than their theoretical energy requirements. Theoretical energy expenditure was established by taking into account the age, body weight and physical activity(Reference Ortega, Requejo, López-Sobaler, Requejo and Ortega8) of all subjects, using equations proposed by the WHO(9). Both diets were structured with the idea of approximating them to the theoretical ideal by increasing the relative consumption of either vegetables or cereals; earlier studies have shown that these foods are those with the greatest differences between their observed and recommended intakes(Reference Ortega, Requejo and López-Sobaler10, Reference Navia, Ortega, Requejo, Mena, Perea and López-Sobaler11).
The weight control measures were based on restricting the consumption of energy-rich foods and increasing the consumption of cereals (Diet C) or vegetables (Diet V).
Diet C
Enriched-breakfast cereals and cereal bars were particularly recommended (a minimum of three times/d) since, apart from carbohydrate, they also provide fibre, minerals and vitamins (particularly vitamin D). However, the subjects were also advised to eat other cereals, e.g. bread, rice and pasta.
Diet V
Increasing the intake of vegetables (minimum three times/d) was recommended.
The women were allowed to create their own menus following the established rules. The full characteristics of the diets followed and other methodological details are described elsewhere(Reference Ortega, Rodríguez-Rodríguez, Aparicio, Marín-Arias and López-Sobaler12).
Methods
The following data were collected from all subjects during the pre-intervention stage and again at 2 weeks.
Anthropometric information
Weight and height were determined using a Seca Alpha digital electronic balance (range 0·1–150 kg) and a Harpenden digital stadiometer (range 70–205 cm), respectively. A pair of Holtain skinfold calipers was used to measure the biceps, triceps, subscapular and suprailiac skinfold thickness. For these measurements, subjects were barefoot and wore only underwear. All data were collected by trained personnel following norms set out by the WHO(13).
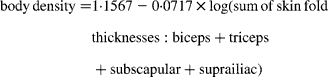
Subject BMI was calculated as weight (kg)/height2 (m2). The percentage of body fat (%BF) was determined from the body density using the equation of Siri(Reference Siri, Lawrence and Tobias14) : %BF = (495/body density) − 450. Body density was calculated from the formulae of Durnin & Womersley(Reference Durnin and Womersley15):
Using the value for %BF and subject body weight, the following were calculated:
Dietetic study
A ‘food and drink record’ was used to register all intakes for 3 d, including a Sunday(Reference Ortega, Requejo, López-Sobaler, Requejo and Ortega16). The aim was to have as true a record as possible; subjects were asked to record all intakes, even though they broke the ‘rules’ of their diet.
The energy and nutrient contents of these foods were then calculated using food composition tables(Reference Ortega, López-Sobaler, Requejo and Andrés17). Special attention was paid to the intake of energy and vitamin D. DIAL software (Alce Ingeniería, 2004) was used to process all data(Reference Ortega, López-Sobaler, Andrés, Requejo and Molinero18).
Serum analysis
25-Hydroxyvitamin D (25(OH)D) levels were measured by RIA using the IDS RIA kit (IDS Ltd, UK) (CV 7·4 %)(Reference Hollis19). The limit established by Gordon et al. (Reference Gordon, DePeter, Feldman, Grace and Emans20) (50 nmol/l) was used in the present study to consider mild vitamin D deficiency.
Statistical analysis
Means and standard deviations were calculated for all variables. Student's t test for paired samples was used to analyse the change in variables over time in each diet group. The comparison of group C and group V results was performed using the Student's t test (or the Mann–Whitney test if the distribution of results was not homogeneous). Linear correlation coefficients were calculated using the Pearson test. Comparisons between proportions were performed using the χ2 test. Logistic regression analysis was used to identify risk or protection factors that might modify any variables. Significance was set at P < 0·05.
Results
Tables 1 and 2 show the initial results and those recorded at 2 weeks for the women who followed the C and V diets, and with respect to whether they had initial serum 25(OH)D concentrations of < 50 nmol/l (LD) or ≥ 50 nmol/l (HD).
Table 1 Changes in food composition, energy and vitamin D intake over the dietary intervention period: differences depending on initial serum 25-hydroxyvitamin D (25(OH)D) concentrations

Diet C, increased consumption of breakfast cereals; Diet V, increased consumption of vegetables.
Mean values were significantly different from those of the baseline (pre-intervention): *P < 0·05.
Mean values were significantly different from those of the Diet V group: †P < 0·05.
Mean values were significantly different from those of the women with an initial serum 25(OH)D concentration < 50 nmol/l: ‡P < 0·05.
Table 2 Changes in anthropometric and biochemical data over the dietary intervention period: differences depending on initial serum 25-hydroxyvitamin D (25(OH)D) concentrations
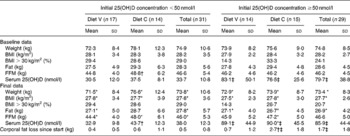
Diet C, increased consumption of breakfast cereals; Diet V, increased consumption of vegetables, FFM, fat-free mass.
Mean values were significantly different from those of the baseline (pre-intervention): *P < 0.05·
Mean values were significantly different from those of the Diet V group: †P < 0·05
Mean values were significantly different from those of the women with an initial serum 25(OH)D concentration < 50 nmol/l: ‡P < 0·05.
The C subjects came to have a higher cereal intake than the V subjects, and the V subjects to have a higher vegetable intake than they showed at the beginning of the experiment. The intake of fruits increased and the consumption of meat, fish and eggs fell over the study period (Table 1).
Vitamin D intake and 25(OH)D levels improved in the C women – both those of the LD and HD subgroups. It is reasonable that serum 25(OH)D levels should rise with vitamin D intake (Table 2).
The body weight and BMI of the subjects in all the subgroups fell since the diets reduced the energy intake. Body fat was reduced in three of the four subgroups. This reduction was significantly greater among HD women, and especially among those who followed Diet C; these subjects also enjoyed a significant increase in their fat-free mass (Table 2).
Taking all subjects together, the HD women showed greater losses of body fat at 2 weeks than LD women (1·7 (sd 1·8) kg compared to 0·5 (sd 0·8) kg). It would therefore appear that having better vitamin D status aids in the loss of body fat (OR 0·462; CI 0·271, 0·785; P < 0·001). However, when the same analyses were performed for V and C subjects separately, only in HD–C subjects was the aid maintained (OR 0·300; CI 0·121, 0·748; P < 0·001).
Discussion
Bearing in mind that the initial intake of cereals/legumes, vegetables/greens and fruits was lower than recommended in all subjects(Reference Ortega, Requejo and López-Sobaler10–Reference Ortega, Rodríguez-Rodríguez, Aparicio, Marín-Arias and López-Sobaler12), the design of the two slightly hypocaloric intervention diets, based on approximating the intakes of cereals or vegetables to the theoretical ideal, is justified. One of the interventions, the V diet, was more conventional, while the other, the C diet, was more unusual, allowing the differences in the effect of extra vitamin D intake to be examined.
The initial vitamin D intake and serum 25(OH)D levels of the subjects were similar to those recorded in other studies(Reference Lamberg-Allardt, Outila, Karkkainen, Rita and Valsta21, Reference Hill, O'Brien, Cashman, Flynn and Kiely22), and, like these, showed that many women have an inadequate vitamin D status(Reference Bischoff-Ferrari, Giovannucci, Willett, Dietrich and Dawson-Hughes1, Reference Lamberg-Allardt, Outila, Karkkainen, Rita and Valsta21, Reference Hill, O'Brien, Cashman, Flynn and Kiely22) (Table 2).
The diets followed led to a reduction in energy intake, body weight, BMI and body fat (Tables 1 and 2), which agrees with results reported in other studies(Reference Ortega, Rodríguez-Rodríguez, Aparicio, Marín-Arias and López-Sobaler12, Reference Ortega, Requejo, Quintas, Andrés, Redondo and López-Sobaler23). The C diet led to an increase in vitamin D intake and an increase in serum 25(OH)D (Tables 1 and 2), and a correlation was found at the end of the study between cereals and vitamin D intake (r 0·502). No such correlation was seen at the beginning of the study.
The importance of vitamin D in weight control(Reference Hashemipour, Larijani and Adibi3, Reference Zemel, Shi, Greer, Dirienzo and Zemel5, Reference Parikh, Edelman, Uwaifo, Freedman, Semega-Janneh, Reynolds and Yanovski6, Reference Arunabh, Pollack, Yeh and Aloia24, Reference Looker25) is shown in the greater loss of body fat in the HD women. Vitamin D therefore appears to aid in the loss of body fat.
The reduction in energy intake in HD women (2912 (sd 2043) kJ) was no different to that seen in the LD women (2871 (sd 2379) kJ). Therefore, it cannot be the cause of their greater body weight and fat losses (Table 2). Similarly, the HD women following the C diet lost more body fat than their LD counterparts yet there was no significant difference in the reduction of their energy intakes (3776 (sd 2144) kJ in HD–C subjects; 3088 (sd 2444) kJ in LD–C subjects).
Recent evidence suggests that vitamin D intakes above current recommendations may be associated with better health(Reference Bischoff-Ferrari, Giovannucci, Willett, Dietrich and Dawson-Hughes1, Reference Holick4), and that the vitamin D status of the general population could be improved(Reference Lamberg-Allardt, Outila, Karkkainen, Rita and Valsta21, Reference Hill, O'Brien, Cashman, Flynn and Kiely22). Strategies to increase vitamin D intake, including the fortification of food, should be investigated(Reference Hill, O'Brien, Cashman, Flynn and Kiely22, Reference Laaksi, Ruohola and Ylikomi26). Further, since vitamin D deficiency may have a negative effect on weight control(Reference Hashemipour, Larijani and Adibi3, Reference Parikh, Edelman, Uwaifo, Freedman, Semega-Janneh, Reynolds and Yanovski6, Reference Arunabh, Pollack, Yeh and Aloia24, Reference Looker25), it might be important that a satisfactory vitamin D status be maintained by people trying to lose weight.
The present results, although they have been obtained in a small sample size and in a short period of time, suggest that women with a better vitamin D status respond more positively to hypocaloric diets and lose more body fat; this was particularly clear in the C subjects who had a greater vitamin D supply during the experimental period.
Acknowledgements
This work was financed by Kellogg España via the Universidad-Empresa project 362/2003.
None of the authors had any personal or financial conflict of interest. R. M. O., A. M. L.-S. and P. A. contributed to the study design, A. A., L. M. B., E. R.-R. and J. M. P. performed the data collection; R. M. O., A. M. L.-S., A. A., E. R.-R., J. M. P. and B. R.-R. were involved in data analysis and interpretation of results; and R. M. O., A. M. L.-S., B. R.-R. and P. A. contributed to writing the manuscript.


