


Although CVD was earlier more prevalent in developed countries, its burden is now higher in developing countriesReference Reddy and Yusuf1. According to recent projections, by the year 2020, 6·4 million deaths due to CVD could occur in developing countries in the age group of 30–69 yearsReference Reddy and Katan2. Asian Indians are known to have a greater susceptibility to type 2 diabetes and premature coronary artery disease compared with EuropeansReference Reddy and Yusuf1, Reference Enas, Yusuf and Mehta3, Reference Mohan, Deepa, Shanthirani and Premalatha4. Like other developing countries in transition, increased life expectancy, urbanisation, changes in dietary patterns from ‘traditional’ to ‘Western’ and physical inactivity due to increased affluence are some of the important contributors to the rapidly rising prevalence of cardiovascular risk factors in urban IndiansReference Prabhakaran, Shah, Chaturvedi, Ramakrishnan, Manhapra and Reddy5.
Diet has long been linked to the development of obesity, diabetes and CVDReference Bazzano6 and dietary modification is one of the cornerstones of chronic disease prevention. Examination of single nutrients in relation to CVD risk may ignore the biochemical complexity of whole foods. In addition, dietary advice becomes easier to understand and follow if provided in terms of whole foods. The beneficial effect of diets rich in fruits and vegetables has been well recognised for the prevention of chronic diseases, especially CVD, as they contain substantial amounts of nutrients such as folate, antioxidant vitamins, K and dietary fibreReference Khaw and Barrett-Connor7–Reference Rimm, Ascherio, Giovannucci, Spiegelman, Stamfer and Willett9.
The World Health Report10 estimates that low fruit and vegetable intake contributes to approximately 2·7 million deaths (4·9 %) per year from chronic diseases and causes about 31 % IHD and 11 % stroke worldwide. Indeed low fruit and vegetable intake is ranked as the seventh main risk factor among causes of disability-adjusted life-years in developing countries with low mortality.
Several studies in the West have reported on the beneficial effect of fruit and vegetable consumption with respect to CVD riskReference Dauchet, Amouyel, Hercberg and Dallongeville11–Reference Rimm, Ascherio, Giovannucci, Stampfer and Willett13. There is an urgent need for such data from India where rapid nutritional transition is ongoing due to urbanisation and globalisation leading to increasing levels of potentially reversible CVD risk factorsReference Reddy and Yusuf1. Furthermore, a clear understanding of the relationship between fruit and vegetable intake and CVD risk could also provide a more direct scientific basis for practical dietary guidelines for the prevention of CVD. Therefore, in the present cross-sectional study, we sought to evaluate the association of fruit and vegetable intake with cardiovascular risk factors such as obesity, hypertension, fasting plasma glucose and dyslipidaemia in urban Asian Indians in southern India.
Materials and methods
Sampling
Study subjects were recruited from the Chennai Urban Rural Epidemiology Study (CURES), an ongoing epidemiological study conducted on a representative population of Chennai city (formerly Madras) in southern India with a population of about 5 million individuals. The methodology of the study has been published elsewhereReference Deepa, Pradeepa, Rema, Anjana, Deepa, Shanthirani and Mohan14. Our website http://www.drmohansdiabetes.com (under the link ‘publications’) provides details of the sampling frame. Briefly, the city of Chennai is divided into 155 corporation wards representing a socio-economically diverse group. In Phase 1 of CURES, individuals from fourty-six corporation wards were screened by a systematic sampling technique. The sample distribution in each ward within these zones is based on the proportion of their population in that particular zone. A probabilistic proportionate sampling was adopted to select the number of individuals seen in each ward. Furthermore, within each ward, every third lane or road, following the right-hand rule, was surveyed. A total of 26 001 individuals aged ≥ 20 years were screened.
Phase 2 of CURES deals with studies on the prevalence of microvascular and macrovascular complications of diabetes. Phases 1 and 2 are not discussed further in the present article.
In phase 3 of CURES, every tenth subject recruited in phase 1 (n 2600) was invited to our centre for detailed anthropometric measurements and biochemical tests and every alternate individual from the group (n 1300) was invited for detailed dietary studies. Of these, 1143 subjects participated in the present study (response rate 87·9 % (1143 out of 1300 individuals)). This sample is thus representative of the Chennai population. Subjects with self-reported history of diabetes or hypertension or CVD or on drug therapy for dyslipidaemia were excluded (n 160). The remaining 983 subjects were included in the present study.
All study subjects underwent an oral glucose tolerance test using a glucose load of 75 g, except self-reported diabetic subjects, for whom fasting venous plasma glucose was measured. The fasting blood sample was taken after ensuring 8 h overnight fasting, for estimation of plasma glucose and serum lipids using a Hitachi 912 Autoanalyser (Roche Diagnostics GmbH, Mannheim, Germany) utilising kits supplied by Boehringer Mannheim (Mannheim, Germany). Anthropometric measurements including weight, height, waist and hip measurements were obtained using standardised techniquesReference Deepa, Pradeepa, Rema, Anjana, Deepa, Shanthirani and Mohan14. Blood pressure was recorded in the right upper limb in sitting position to the nearest 2 mmHg using an Hg sphygmomanometer (Diamond Deluxe BP apparatus; Industrial Electronic & Allied Products, Pune, India). Two readings were taken 5 min apart, and the mean of two was taken as the blood pressure. Demographic and socio-economic characteristics, medical history, medications, family history of diseases, smoking status (current smokers: yes or no) and alcohol consumption (current drinker: yes or no) were also obtainedReference Deepa, Pradeepa, Rema, Anjana, Deepa, Shanthirani and Mohan14. The institutional ethical committee approval was obtained and informed consent was obtained from all study subjects.
Definitions
Newly diagnosed diabetes
Diagnosis of ‘newly detected diabetic subjects’ was based on WHO consulting group criteria, i.e. fasting plasma glucose ≥ 1260 mg/l (7 mmol/l) and/or 2 h post-load plasma glucose ≥ 2000 mg/l ( ≥ 11·1 mmol/l)Reference Alberti and Zimmet15.
Newly diagnosed hypertension
Hypertension was diagnosed based on systolic blood pressure ≥ 130 mmHg or diastolic blood pressure of ≥ 85 mmHgReference Chobanian, Bakris and Black16.
Dyslipidaemia
This was defined using National Cholesterol Education Program Adult Treatment Panel17 guidelines as follows.
Hypercholesterolaemia was diagnosed if serum cholesterol levels were ≥ 2000 mg/l ( ≥ 5·2 mmol/l).
Hypertriacylglycerolaemia was diagnosed if serum TAG levels were ≥ 1500 mg/l ( ≥ 1·7 mmol/l).
Low high-density-lipoprotein-cholesterol was diagnosed if HDL-cholesterol levels were < 400 mg/l for men and < 500 mg/l for women.
High low-density-lipoprotein-cholesterol was diagnosed if LDL-cholesterol levels were ≥ 1300 mg/l.
Dietary assessment
Usual dietary intake was assessed by using a validated interviewer-administered semi-quantitative FFQ (meal-based)Reference Sudha, Radhika, Sathya, Ganesan and Mohan18. The nutritionists responsible for the data collection were well trained in the methodology to be used before fieldwork was started. Data were collected by one-to-one interview after obtaining informed consent. The FFQ took about 20–30 min to complete. This FFQ contains 222 items that included commonly available and eaten fruits (twenty fruits including both citrus and non-citrus variety) and twenty-five vegetables in the form of both raw and cooked foods including cruciferous (cabbage, broccoli, cauliflower), dark yellow (excluded tubers), green leafy vegetables (amaranth, spinach, palak, drumstick leaves (Moringa oleifera), mint, coriander) and other vegetables (egg plant, mixed vegetables, drumstick, mushrooms, ladies' fingers (okra), knol-knol, chow-chow, gourd varieties). Data on the seasonal availability of fruits and vegetables were obtained from local wholesale vendorsReference Sudha, Radhika, Sathya, Ganesan and Mohan18. These values were used to convert reported seasonal intake into average intake throughout the year (For example, mangoes are seasonal and are available for the period of 3 months. Suppose if the respondent reported consuming one medium-size mango once-weekly, the nutritionist will convert it to yearly as twelve mangoes (with 4 weeks in each month).)
For each fruit or vegetable, a usual serving size was specified and the individuals were asked to estimate the usual frequency (number of times per d, week, month or year, or never) on average, during the previous year they had consumed that amount. Common household measures such as household cups, bowls, ladles, spoons (for the cooked foods such as vegetables), wedges (to estimate slices of cakes and fruits), circles of different diameter (to estimate the portion size of foods such as paratas or chapatis) and a visual atlas of different sizes of fruits (small, medium, large) were shown to assist the individuals in the estimating process. Frequencies and serving size of the individual food items were converted to average daily intake (g/d) of each fruit and vegetable item for each subject. The average daily intakes of individual foods were summed to compute total fruit and vegetable intake (g/d). Information on total energy was obtained using the same FFQ. A detailed description of the reproducibility and validity of the FFQ has been published elsewhereReference Sudha, Radhika, Sathya, Ganesan and Mohan18. Validity of the FFQ has been documented by comparisons with multiple 24 h recalls collected at 2-monthly intervals for a period of 1 year covering all four seasons. This included four weekdays and two weekends to capture variability in weekend v. weekday food intakes. The energy-adjusted deattenuated Pearson correlation coefficients for the response to the 222-item questionnaire, for fruits and vegetables from the questionnaire compared with six 24 h recalls, averaged 0·28.
Reported individual food items were converted to average daily intake of each fruit and vegetable item for each participant using an in-house EpiNu India® database and software (Nutritional Epidemiology, Food and Nutrient database, version 1.0), developed and launched by the Department of Nutrition and Dietetics Research of Madras Diabetes Research Foundation. This database contains comprehensive data for 1500 recipes (both commercial and non-commercial) and sixty nutrients. The average daily intakes of individual food items were combined to compute total fruit and vegetable intake.
Statistical analysis
All analyses were conducted using the statistical software package SPSS (version 10.0; SPSS, Inc., Chicago, IL, USA). Subjects were divided into quartiles of fruit and vegetable intake (g/d). The mean of each was reported and compared for the descriptive characteristic. Values are expressed as means and standard deviations. One-way ANOVA or Student's t test as appropriate was used to compare continues variables, and the χ2 test was used to compare the proportions among groups. To investigate whether the clustering of CVD risk factors was significantly related to fruit and vegetable intake, we computed Z scores by sex for all nine risk factor variables (systolic blood pressure, diastolic blood pressure, BMI, waist circumference, fasting plasma glucose, total serum cholesterol, TAG, HDL-cholesterol and LDL-cholesterol). Z scores were computed as the number of sd units from the sample mean, i.e. Z = ((individual value – the sex-specific mean value)/sex-specific sd). The HDL-cholesterol Z score was multiplied by − 1 to indicate higher cardiovascular risk with increasing value. The sum of all Z scores indicates the cluster of cardiovascular risk factors. Regression analysis was carried out using cardiovascular risk factors as dependent variables and the first and fourth quartile of fruit and vegetable intake (g/d) as the independent variable with adjustment for potential confounders such as age (years), sex (dichotomous), BMI (continuous variable), current smoking (yes or no), alcohol (yes or no) and total energy intake (kJ). All tests of significance were two-tailed and a P value of < 0·05 was considered significant.
Results
The baseline characteristics of the study participants by sex are presented in Table 1. The ages of the men and the women were 40·2 (sd 12·6) and 38·8 (sd 11·5) years respectively. Men had significantly lower BMI (P = 0·003) and HDL-cholesterol concentration (P < 0·0001) but higher systolic blood pressure (P = 0·009), diastolic blood pressure (P < 0·0001), waist circumference (P < 0·0001), fasting blood sugar (P = 0·055) and serum TAG (P < 0·0001) compared with women. Similarly men had higher prevalence of hypertension (P = 0·023) and dyslipidaemia (P < 0·0001) than women. No significant mean differences were observed in the fruit and vegetable intake (g/d) between the sexes. Fruit and vegetable intake did not differ between non-vegetarians (n 897; 263 (sd 111·1) g/d) and vegetarians including ovo-vegetarians (n 86; 278·7 (sd 143·5) g/d; P = 0·357). The cardiovascular risk factor score was higher in men (0·25 (sd 4·8)) compared with women ( − 0·23 (sd 4·7)).
Table 1 General and clinical characteristics of the representative population of 983 urban subjects
(Mean values and standard deviations or proportions)

* For continuous characteristics, performed using Student's t test. For categorical tests, the χ2 test for trend was used.
† CVD risk factor score was calculated as the sum of Z scores for systolic blood pressure, diastolic blood pressure, waist circumference, BMI, fasting plasma glucose, total cholesterol, TAG, LDL-cholesterol and HDL-cholesterol.
Fruit and vegetable consumption
The clinical characteristics of the study participants by quartiles of fruit and vegetables are presented in Table 2. Intake of fruit and vegetables ranged from 141 g/d in the lowest quartile to 418 g/d in the highest quartile. A higher intake of fruit and vegetables was associated with younger age (P for trend < 0·001), lower prevalence of hypertension (P for trend = 0·005) and dyslipidaemia (P for trend < 0·0001). Systolic blood pressure (P for trend < 0.001), diastolic blood pressure (P for trend = 0·002), BMI (P for trend = 0·004), serum cholesterol (P for trend < 0·001), serum LDL-cholesterol (P for trend < 0·0001) and waist circumference (P for trend < 0·0001) were significantly lower in those in the higher quartiles of fruit and vegetable intake. CVD risk score (P for trend < 0·0001) was inversely related to higher fruit and vegetable intake (g/d).
Table 2 Description of cardiovascular risk factors according to quartiles (Q) of fruit and vegetable intake (g/d) of 983 subjects
(Mean values and standard deviations or proportions)
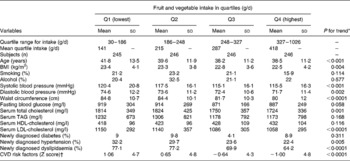
* For continuous characteristics, performed using one-way ANOVA. For categorical tests, the χ2 test for trend was used.
† CVD risk factor score was calculated as the sum of Z scores for systolic blood pressure, diastolic blood pressure, waist circumference, BMI, fasting plasma glucose, total cholesterol, TAG, LDL-cholesterol and HDL-cholesterol.
Association between fruit and vegetable intake with cardiovascular risk factors
In a regression analysis model, we observed a significant inverse association in cardiovascular risk factors and fruit and vegetable intake (g/d) (Table 3). Higher intake of energy-adjusted fruit and vegetable intake showed an significant inverse association with systolic blood pressure (β = − 5·4 (95 % CI − 8·89, − 1·944) mmHg; P = 0·002), diastolic blood pressure (β = − 3·4 (95 % CI − 5·86, − 1·483) mmHg; P < 0·0001), BMI (β = − 2·0 (95 % CI − 2·74, − 1·32) kg/m2; P < 0·0001), waist circumference (β = − 7·9 (95 % CI − 9·87, − 5·96) cm; P < 0·0001), serum total cholesterol (β = − 77 (95 % CI − 140·3, − 13·0) mg/l; P = 0·019), LDL-cholesterol (β = − 79 (95 % CI − 134·1, − 24·8) mg/l; P = 0·004) and HDL-cholesterol (β = 29 (95 % CI 10·8, 40·7) mg/l; P = 0·002) when compared with the lowest quartile (model 1). Adjusting for age and sex (model 2) did not alter the significant association for systolic blood pressure (β = − 4·5 (95 % CI − 7·76, − 1·29) mmHg; P = 0·006), diastolic blood pressure (β = − 3·2 (95 % CI − 5·33, − 1·09) mmHg; P = 0·003), BMI (β = − 2·3 (95 % CI − 2·91, − 1·52) kg/m2; P < 0·0001), waist circumference (β = − 7·6 (95 % CI − 9·58, − 5·69) cm; P < 0·0001), serum total cholesterol (β = − 73 (95 % CI − 134·5, − 11·4) mg/l; P = 0·020), HDL-cholesterol (β = 26 (95 % CI 8·8, 44·0) mg/l; P = 0·003) and LDL-cholesterol (β = − 77 (95 % CI − 130·6, − 22·5) mg/l; P = 0·006). Further, introducing smoking and alcohol (model 3) into the model did not alter the results. Though there was a strong association for consumption of fruit and vegetables with diastolic blood pressure this became insignificant after adjustment for BMI (model 4) but a significant inverse association persisted for systolic blood pressure (β = − 2·6 (95 % CI − 5·92, − 1·02) mmHg; P = 0·027), waist circumference (β = − 2·6 (95 % CI − 3·69, − 1·46) cm; P < 0·0001), serum total cholesterol (β = − 50 (95 % CI − 113·9, − 13·6) mg/l; P = 0·017) and LDL-cholesterol (β = − 55 (95 % CI − 110·8, − 11·1) mg/l; P = 0·039) with fruit and vegetable intake (g/d). Higher fruit and vegetable intake (g/d) was inversely related to the CVD risk score (β = − 1·0 (95 % CI − 1·74, − 0·32); P = 0·004) even after adjusting for all the confounding factors. The highest quartile of fruit and vegetables explained 48 % of the protective effect against CVD risk factors compared with the lowest quartile.
Table 3 Multivariate adjusted association between fruit and vegetable intake (g/d) and common cardiovascular risk factors*
(Regression coefficients and 95 % confidence intervals)
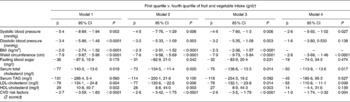
* All models were adjusted for total energy intake (kJ). Model 1 was unadjusted; model 2 was adjusted for age (years) and sex (dichotomous); model 3 was adjusted for model 2 and smoking (yes or no) and alcohol (yes or no); model 4 was adjusted for model 3 and BMI (continuous variable).
† First quartile < 180 g/d = 0 v. fourth quartile >327 g/d = 1.
‡ CVD risk factor score was calculated as the sum of Z scores for systolic blood pressure, diastolic blood pressure, waist circumference, BMI, fasting plasma glucose, total cholesterol, TAG, LDL-cholesterol and HDL-cholesterol.
Discussion
CVD is becoming the leading cause of mortality and morbidity in many developing countries, especially in India. Levels of various CVD risk factors are rising with the rapid nutritional and epidemiological transition in these countries as reflected by higher diabetes prevalence, increased cholesterol, blood pressure levels and greater obesity ratesReference Reddy and Yusuf1. There is also increasing evidence that energy-dense foods usually associated with lower fruit and vegetable intake increase the risk of CVDReference Hu19.
In the present cross-sectional study, a higher fruit and vegetable intake was inversely associated with several risk factors for CVD such as waist circumference, BMI, total cholesterol and LDL-cholesterol concentration, independent of age, sex, smoking status, alcohol, BMI and total energy intake. Overall fruit and vegetable intake explained 48 % of the protective effect against CVD risk factors. To our knowledge, this is the first epidemiological study from India directly showing a link between decreasing fruit and vegetable intake individually with virtually all CVD disease risk factors.
Obesity, particularly abdominal obesity, is a well-known risk factor for CVD and type 2 diabetes; Asian Indians are known to have lower BMI than EuropeansReference Raji, Seely, Arky and Siminson20. However, for any given BMI, Asian Indians have greater waist:hip ratiosReference Raji, Seely, Arky and Siminson20, Reference Ramachandran, Snehalatha, Viswanathan, Viswanathan and Haffner21 and abdominal fat than Europeans. Studies suggest that a diet rich in dietary fibre is protective against obesity, as obesity is less common in populations that consume a high-fibre diet and more prevalent in populations that consume a low-fibre dietReference Van Itallie22. Although earlier studies from India have assessed the effect of dietary fat and obesity, limited data are available on the association of fruit and vegetable intake with obesity (including central obesity) in this population. In the present study, fruit and vegetable intake was inversely correlated to waist circumference and BMI and this is reflected in the lower CVD risk factor prevalence. Similar results were also reported in other epidemiological studiesReference Ludwig, Pereira, Kroenka, Hilner, Van Horn, Slattery and Jacobs23. The mechanisms underlying such an effect are possibly due to high fibre intake, which further reduces the total energy intake and is associated with increased fat excretionReference Cara, Dubois, Borel, Armand, Senft, Portugal, Pauli, Bernard and Lairon24, improved insulin sensitivity and reduced insulinaemiaReference Ludwig, Pereira, Kroenka, Hilner, Van Horn, Slattery and Jacobs23.
Diets rich in vegetables and fruits have been shown to control and prevent high blood pressure in a multicentre clinical trial with a heterogeneous populationReference Appel, Moore and Obarzanek25. In the Chicago Western Electric Study, fruit and vegetable intake was inversely associated with an age-related rise in blood pressureReference Miura, Greenland, Stamler, Liu, Daviglus and Nakagawa26. In a cross-sectional study among 4393 individuals in Spain, a high fruit and vegetable intake was inversely associated with blood pressureReference Alonsa, de la Fuente, Martín-Arnau, de Irala, Martínez and Martinez-González27. Similar results were also reported in a cross-sectional study among 1497 individuals in Kerala, South IndiaReference Beegom and Singh28. This inverse relationship was also evident from the present study where the mean systolic blood pressure was 4.9 mmHg and diastolic blood pressure 2·9 mmHg lower for those with the highest consumption of fruit and vegetable intake. These findings suggest that the adoption of diets rich in fruits and vegetables might potentially shift the population distribution of blood pressure downward and thereby prevent CVD.
Serum total cholesterol and LDL-cholesterol are well-known risk factors for CVDReference Enas, Yusuf and Mehta3. There is also evidence to show that diets rich in fruits and vegetables and low-fat dairy products and reduced in saturated fat, total fat and cholesterol content (dietary approaches to stop hypertension (DASH) diet) substantially lower the total and LDL-cholesterol concentrationReference Obarzanek, Sacks and Vollmer29. Fornes et al. Reference Fornes, Marins, Hernan, Velasquez-Melendex and Ascherio30 reported in a cross-sectional study that the intake of fruits and vegetables was inversely correlated with LDL-cholesterol. Other investigatorsReference Bruce, Spiller, Klevay and Gallagher31 also reported on the beneficial effect of fruit and vegetable intake on LDL-cholesterol concentration. The present findings are also consistent with these reports, as the levels of both total and LDL-cholesterol were lower in the higher quartiles of fruit and vegetable intake.
Viswanathan & MohanReference Viswanathan and Mohan32 showed significant reduction in serum cholesterol among diabetic patients with a high-carbohydrate, high-fibre diet and these effects were sustained for a long period of timeReference Viswanathan, Ramachandran, Mohan and Snehalatha33. Diets rich in fruits and vegetables are good sources of dietary fibre, which may indirectly lower serum cholesterol levels. In addition, antioxidants such as vitamin C and β-carotene may help to reduce lipid oxidation of LDL-cholesterol, thereby preventing the development and progression of atherogenesisReference Lairon34–Reference McKeown, Meigs, Liu, Wilson and Jacques36.
Studies on dietary patterns test the hypothesis that a combination of foods and their nutrients, rather than the individual constituents of a diet, confers or reduces the disease risk. The biological mechanisms responsible for the beneficial effects of fruits and vegetables on CVD risk are therefore likely to be multiple. Besides their contribution to low energy, high fibre content and low glycaemic load, fruits and vegetables are also rich in phytochemicals, antioxidants and other micronutrients, all of which could be beneficial in reducing the risk of CVDReference Joshipura, Hu and Manson37.
The WHO38 recommends a population goal of consumption of a minimum 400 g fruits and vegetables per d for the prevention of chronic non-communicable diseases. The mean intake of fruits and vegetables in the present study was 265 g/d, which was much lower than the recommended intake by the WHO. Though India has a prominent share in the global production of fruits and vegetables and a significant proportion of the population is vegetarianReference Kaul39, this does not seem to be reflected in an increase in the consumption of fruits and vegetables – perhaps the result of export and as it is not affordable by a large section of the populationReference Shetty40. This might be one of the less-emphasised reasons for the increased susceptibility of Asian Indians to diabetes and premature CVDReference Mohan, Deepa, Shanthirani and Premalatha4, Reference Prabhakaran, Shah, Chaturvedi, Ramakrishnan, Manhapra and Reddy5, Reference Mohan, Shanthirani and Deepa41.
One of the limitations of the study is that being a cross-sectional one, it is not the appropriate design to assess the cause and effect between diets and CVD. Longitudinal studies or clinical trials are best suited to evaluate the role of fruit and vegetables in the development of, or protection against, CVD and its risk factors. Physical activity was also not controlled in the present study, but could have, at least in part, been adjusted by adjusting for BMI and total energy intake.
The present study, however, has several strengths. We investigated the association in a relatively large population representative of the overall population of Chennai, which is in turn representative of urban India and hence the results can be extrapolated at least to urban India. The study used an FFQ, to measure the dietary intake of fruits and vegetables, which is considered a better method than a single 24 h recall or even a 7 d food recordReference Willett42. The FFQ used in the present study covered seasonality and has been validated and publishedReference Sudha, Radhika, Sathya, Ganesan and Mohan18. In addition, CVD risk Z score, which we used to define clustering of CVD risk factors on a continuous scale, is statistically more sensitive and less error prone compared with other approachesReference Ragland43. Finally, use of regression analysis in the present study allowed for simultaneous adjustment of several confounding variables. The present study thus offers valuable new data from India on the role of fruit and vegetable intake and the prevalence of CVD risk factors in a population at very high risk of CVD. Further epidemiological studies are needed to further elucidate the type and amount of fruit and vegetables that are most effective in the prevention of chronic diseases such as diabetes and CVD in South Asians in general and Asian Indians in particular.
Acknowledgements
We thank the Chennai Willington Corporate Foundation, Chennai for the CURES field studies. This is the forty-sixth publication from CURES.


