


Introduction
Community pharmacy users, their perceptions and attitudes towards the community pharmacy service, have received attention by researchers in different settings, targeting generic or specific issues, through various methodologies (Vallis et al., Reference Vallis, Wyke and Cunningham-Burley1997; Cordina et al., Reference Cordina, McElnay and Hughes1998; Hamilton, Reference Hamilton1998; Bell et al., Reference Bell, McElnay and Hughes2000; Oparah and Iwuagwu, Reference Oparah and Iwuagwu2001; Grabenstein et al., Reference Grabenstein, Guess, Hartzema, Koch and Konrad2002; Haugbolle et al., Reference Haugbolle, Devantier and Frydenlund2002; Bissell and Anderson, Reference Bissell and Anderson2003; Lawrie et al., Reference Lawrie, Matheson, Bond and Roberts2003). Regional and national studies have been undertaken to address users’ perceptions of the pharmacists’ role, from basic dispensing activities to more elaborated health care initiatives, aiming at tailoring pharmacists’ interventions to their recipients (Airaksinen et al., Reference Airaksinen, Ahonen and Enlund1995). Part of this effort was focused on measuring patient satisfaction with the services provided (MacKeigan and Larson, Reference MacKeigan and Larson1989; Schommer and Kucukarslan, Reference Schommer and Kucukarslan1997; Reid et al., Reference Reid, Wang, Young and Awiphan1999; Kamei et al., Reference Kamei, Teshima, Fukushima and Nakamura2001), framed by service quality theories. In Portugal, user satisfaction with community pharmacy services was also studied and a high general level of satisfaction was reported (Nunes et al., Reference Nunes, Baptista, Contreiras and Falcão1999; EDIDECO, 2000).
Nevertheless, the use of public satisfaction as a measure of service quality presents limitations. An obvious constraint is the population’s knowledge of the actual and potential pharmacists’ role and the linked expectations related to the service. If professionals aspire to provide a significantly different service from what the general public expect to receive, user satisfaction is a limited way to assess the actual and potential practice (Cavaco et al., Reference Cavaco, Sousa Dias and Bates2005). The question of what is exactly the population satisfied with, ie what is the role customers perceived and expected from community pharmacists as primary care professionals, is a pertinent one.
Portuguese community pharmacies are the ‘prescription only medicines’ distributive channel for ambulatory patients. Public access to drugs, independently from their prescription status, is made at the pharmacy via a health professional. Each community pharmacy has a responsible pharmacist, the so-called technical director, who has ownership. Besides the responsible pharmacist, there are a varying number of employees including other pharmacists, technicians, and non-counter staff. The National Pharmacists Order, the Portuguese equivalent to the Royal Pharmaceutical Society of Great Britain, registers all pharmacists. Throughout opening hours, the law requires the presence of the technical director or a substitute pharmacist, although most commonly there are qualified technicians at the counter, in contact with the public. All personnel wear a white coat and an individual identification badge. Most pharmacies have been refurbished during the last decade and this includes computer-assisted sales and customer management. There is a good assortment of health related products besides medicines.
In recent years, changes have taken place in relation to drug prescription and dispensing within the Portuguese National Health Service and other health care subsystems (INFARMED, 2003). The prescription forms, implemented in the beginning of 2002, were designed to reduce the amount of drugs prescribed and simultaneously to encourage generic drug prescription. This was followed by a new reimbursement scheme, based on a generic medicines price reference system. With doctor’s consent, pharmacists can suggest to the patient the cheapest generic drug. However, according to the available information, in the first semester of 2004 only 12.5% of drugs were prescribed by their generic brands and of these only 39.0% had the doctors’ authorization for replacement (CEFAR, 2004). This suggests limited intervention by pharmacy professionals in terms of helping patients managing the costs of their therapies, as well as limited success in the government’s effort to reduce reimbursement expenses.
The exact level of the Portuguese population’s knowledge about community pharmacists’ professional responsibilities is not known. Evidence collected from a previous qualitative study identified a wide range of divergent concepts, as well as feelings and behaviours, in relation to the services provided by the community pharmacy (Cavaco et al., Reference Cavaco, Sousa Dias and Bates2005). This study clearly indicated that the Portuguese public does not necessarily have a convergent understanding of the pharmacist’s role. The level of detailed awareness attached to the pharmacists’ role was rather low, although regular efforts have been developed by professional associations, such as The National Order and A.N.F. (The National Pharmacies Association) campaigns (Associação Nacional das Farmácias, 2003; Ordem dos Farmacêuticos, 2003), to increase population appreciation of the pharmacists’ role and further improve the community pharmacists’ social image. Given these initiatives, it seemed relevant to evaluate the Portuguese population’s knowledge and behaviour in relation to a set of key community pharmacy features and pharmacists’ duties.
The present article presents a national representative survey of pharmacy users’ perceptions. The perceptions presented here were the most divergent among interviewed pharmacy users and those that presented a higher degree of uncertainty (Cavaco, 2005). These perceptions included common professional features and standards of practice generally accepted by community pharmacists. The aim was to describe relationships between demographic variables and community pharmacy users’ perceptions, in particular, behavioural and cognitive facets of pharmacy usage at a national level in Portugal.
Methods
From a previous qualitative study that explored community pharmacy usage dimensions, facets that showed more response discrepancies or error content, were selected to be nationally surveyed. These facets were expressed by attitudinal statements related to pharmacy usage, ie behavioural, affective and cognitive expressions of that usage.
To conduct the survey it was solicited cooperation with The Governmental Public Health Observatory (ONSA). This national research institution regularly completes epidemiological studies on the Portuguese population, managing different samples and methods to conduct data collection. In this case, data were collected through a computer-assisted telephone-structured interview from a national panel, the ECOS (Em Casa Observamos Saúde). This panel is a representative sample, composed of a number of simple randomly chosen households with a landline telephone, within each of the five administrative Portuguese Health Regions (North, Centre, Lisbon and Tagus Valley, Alentejo, and Algarve). ECOS had been previously used to conduct one of the Portuguese pharmacy user satisfaction studies (Nunes et al., 1999), among other national health inquiries of the Portuguese population. At the study date, ECOS was constituted by 2027 households and their families. According to the interview methodology, the participant was the family head or, in his/her absence, the person aged 18 years old or more, preferably with regular visits to a community pharmacy. All households had previously received an invitation letter, explaining the purpose of the study and telephone calls were made from the 4th to 26th of July 2002. ONSA directors established a maximum of five items to be surveyed (Table 1), which were set via the questionnaire presented in Appendix 1.
Table 1 Pharmacy usage facets surveyed
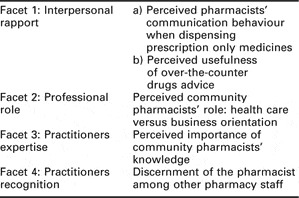
The answer categories were yes/no/don’t know/no answer. General background information was collected, including demographics and data related to prevalent chronic conditions within the Portuguese population, such as asthma, chronic obstructive airway disease, arthritis, hypertension and diabetes.
Statistical analysis was performed for all variables using SPSS (Release 11 – SPSS Inc., Chicago, IL, USA), which included descriptive statistics and logistic regression procedures. Besides frequencies for demographics and facets response, χ 2 statistic was used as a measure of association between facets and demographic variables. Asymptotic two-tailed significance level was set at less than 0.05, as non-directional hypotheses were tested in a large data set. Binary logistic regression was used to build explanatory models, estimating the influence of demographic and background variables on each facet of community pharmacy usage. Each facet was a dichotomous dependent variable since only cases with answers in categories ‘yes’ or ‘no’ were included in the analysis. This decision was made since other replies were from participants that had no defined opinion or had not correctly understood the question. As in all regression equations, there was a dependent variable, in here the logarithm of the odds of answering accordingly to the required cognition or behaviour, which equalled a constant (C) plus all the input variables (Xn) multiplied by their regression coefficients (βn). These coefficients estimated the amount of increase or decrease (if negative) in the log odds of the dependent variable, holding all other predictors constant. Their conversion to odds ratios allows an easier interpretation of each predictor impact. The logistic regression output contained the Nagelkerke pseudo-explain variance, the Wald χ 2 and the Hosmer and Lemeshow test. These were respectively, the amount of variation in the model by comparison with a ‘null’ (or without predictors) model; the statistic testing if predictor’s β coefficient differs significantly from zero; and the model goodness-of-fit statistic. Initially, univariate logistic regressions were conducted with each individual predictor variable with each facet as the dependent variable. This gave crude (unadjusted) odds ratios showing whether any predictor was a significant explanatory variable or not. The next stage was to conduct multivariate logistic regression on each facet with all the predictor variables.
Predictors were variables originally dichotomous (eg, gender) or ordinal (eg, education), with other measurements being categorical by nature, such as country region or occupation. SPSS transforms dichotomous and categorical predictors into dummy variables, here by indicator contrast. In the end, the following predictors were used:
• age group, being the reference category 18–34 years old;
• education, with eight categories from ‘illiterate’ to ‘graduated’, being ‘illiterate’ the reference category;
• country region, with ‘North’ as the reference category;
• occupation, a dichotomized variable, varying from economically ‘inactive’ (unemployed, retired, domestic, student) to employed (employee or self-employed), with the first as the reference category;
• gender, the binary variable male/female, with male as the reference category;
• chronic condition, a dichotomous variable, having or not a chronic condition, with the last being the reference category.
The minimum number of cases that entered regression calculations was 793, for Facet 1.b (see Table 1). The regression was conducted using the backward method and the likelihood ratio test to eliminate non-significant variables from the model. The backward method is less prompt to suppressor effects (Field, 2000), ie a significant effect of a predictor only when another variable is held constant, excluding it from the model and making a type II error. Multicollinearity was checked using the variance inflation factor (VIF) and it was assumed that input variables were not subject to significant interactions.
Results
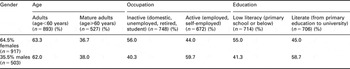
From 2027 households contacted by telephone, 1671 confirmed the reception of the invitation letter and 1420 gave their informed consent to participate in the survey, producing a response of 84.9%. As shown in Table 2, from the 1420 participants, 64.5% were females and the sample mean age was 52.9 years (SD 16.42). Half of the sample had only primary school education, while 47.3% were employed.
Table 2 Summary of sample demographics (n = 1420)
The most prevalent chronic conditions within the Portuguese population (INSA, 2001) were identified in this sample (Table 3). Rheumatic conditions affected almost one-fifth of the respondents, followed by 14.5% hypertensive patients.
Table 3 Sample frequencies for prevalent chronic conditions within the Portuguese population (n = 1420)
Based on these results, it was calculated 31.8% of the sample as having at least one chronic condition, suggesting that almost one-third of the sample were probable ambulatory patients and therefore probably regular pharmacy users.
Response frequencies to the different facets of community pharmacy usage are shown in Figure 1.
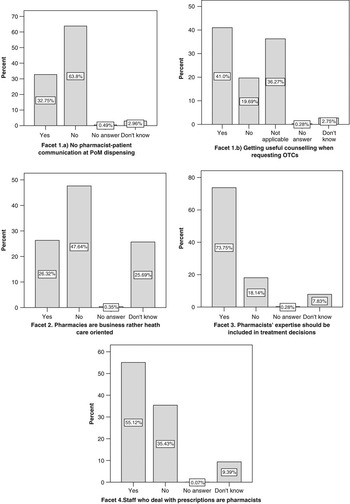
Figure 1 Bar graphs with percentage response to different pharmacy usage facets
Approximately one-third (32.8%) of the participants reported not necessarily talking with the professional who dispenses a prescription (Facet 1.a), while almost 20% said not to receive useful information when asking for an over-the-counter (OTC) medication (Facet 1.b). However, the question for Facet 1.b – perceptions of the advice given by the pharmacy staff for dispensed OTC, ie medicines purchased without a prescription – generated a non-predicted answer category, ‘not applicable’, with 36.3% response. This may have resulted from participants’ understanding of the item as receiving unhelpful counselling after requesting a ‘prescription only medicine’ (POM), without presenting the compulsory doctor’s prescription. This type of dispensing circumstance (POM without prescription) has been described to happen among Portuguese community pharmacies (EDIDECO, 2000). However, even when considering both situations, ie buying OTCs or requesting POMs without a prescription, 19.7% said they did not receive useful information when obtaining medicine.
Almost half of the sample (47.6%) did not agree with the idea that pharmacies were more product trade than health care oriented (Facet 2). Contrary to previous facets, a significant proportion was not sure (25.7%), almost equal to those who said they did not believe health care provision to be the pharmacies’ driving force (26.3%). Reinforcing the belief in the pharmacists’ health care role, a large majority of the participants (73.8%) expressed their agreement with the pharmacists’ participation in treatment decisions (Facet 3). However, answers to Facet 4 showed that users do not easily differentiate between a registered pharmacist and other counter staff, such as qualified technicians, with 55.1% wrong answers to the pharmacist recognition facet.
Response to the different facets was compared between genders, age groups, country regions, education, economic status (in terms of occupation), and chronic condition, excluding from analysis cases with ‘no’ or ‘don’t know’ answers. In relation to pharmacist–patient communication at POM dispensing (Facet 1.a) no significant associations were found between this facet and all the demographic and background variables. Users’ perceptions of getting useful counselling at OTC requests (Facet 1.b, excluding those that have responded ‘not applicable’) did not significantly differ between males and females, as well as country regions. However, significant associations were found with age groups (χ 2 = 104.635, df = 6, P < 0.001), education levels (χ 2 = 109.780, df = 18, P < 0.001), economically active or inactive participants (χ 2 = 40.381, df = 2, P < 0.001) and pharmacy users with or without a chronic condition (χ 2 = 24.181, df = 2, P < 0.001). Participants between 18 and 54 years old, as well as more literate (from high school to pre-graduates), reported useful counselling from the pharmacy staff. This was not the case for graduate participants. Economically active participants were also significantly associated to a positive perception of the pharmacy staff advisory role for OTC purchase, but even more relevant was the association between this facet and the chronic patient status: patients with a chronic condition perceived that they received less useful information than users without a chronic condition.
Response to Facet 2 did not reveal any significant associations with all categories of the variables previously referred, ie no statistical independence in the perception of a commercialistic role for the community pharmacy service between, for instance, educational cohorts or chronic condition status. The high proportion of undecided participants (25.7%), compared to the percentage of response in the same category for other facets (range 2.8% to 7.8%) should be noted.
Facet 3 registered a highly favourable response to include pharmacists’ expertise in decisions related to patient treatment. Significant associations were found with age groups (χ 2 = 14.815, df = 3, P = 0.002) and almost significant with gender (Yates’ corrected χ 2 = 3.524, df = 1, P = 0.051). Females agreed more extensively than males (81.8% versus 77.4%), while participants from 55 years old were increasingly less in favour of pharmacists’ treatment intervention. The youngest group scored 84.6% in favour against 15.4% disapproval, while the oldest group (⩾75 years) scored 69.5% and 30.5%, respectively. Cross-tabulations of the communication facets (1.a and 1.b) with Facet 3 revealed, for users who do not communicate with the pharmacy staff for prescription dispensing or OTC counselling, similar proportions of agreement (66.6% POM, 17.8% OTC) or disagreement (60.7% POM, 26.8% OTC) with pharmacists’ treatment intervention.
The dichotomized (yes/no) pharmacist recognition facet (Facet 4) gave non-significant associations with gender and country regions, but highly significant (P < 0.001) associations with age and educational groups (respectively, χ 2 = 126.900, df = 3 and χ 2 = 205.688, df = 9), as well as with economic status and chronic patient status (respectively, Yates’ corrected χ 2 = 87.527, df = 1 and Yates’ corrected χ 2 = 36.846, df = 1). Older participants, from 55 years onward, gave mostly incorrect answers: an average of 78.2% said that all pharmacy staff dealing with prescriptions are registered pharmacists. As expected, age was associated with education (χ 2 = 531.285, df = 21, P < 0.001): more than half of the participants answering correctly were above the ninth grade cut-off (high school completed), with increased awareness in relation to different community pharmacy professionals (range 54.3% for ninth grade to 72.7% for graduates). Half of the employed participants (50.2%) responded correctly, compared to 24.1% for economically inactive participants. However, more interesting were the results for the patients with a chronic condition, who supposedly are in regular contact with the pharmacy staff for prescribed medicines. These pharmacy users showed a poorer result in staff differentiation: only 26.5% were able to identify correctly the pharmacist among other pharmacy professionals, versus 44.7% for non-chronic drug users.
Table 4 Adjusted odds ratio for relevant predictors of community pharmacy usage facets
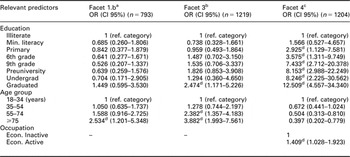
a(5th step) Model χ 2 = 28.449, P < 0.001; Nagelkerke R 2 = 0.049; Hosmer and Lemeshow; χ 2 = 3.277, P = 0.858
b(5th step) Model χ 2 = 35.159, P < 0.001; Nagelkerke R 2 = 0.045; Hosmer and Lemeshow; χ 2 = 7.459, P = 0.488
c(4th step) Model χ 2 = 204.078, P < 0.001; Nagelkerke R 2 = 0.213; Hosmer and Lemeshow; χ 2 = 3.032, P = 0.882
dThe correspondent β value presented Wald Sig. <0.05.
Models from stepwise logistic regressions were calculated for each dichotomous facet. Facet 1.a produced at the seventh step an irrelevant model, including only the constant. Regression calculations for Facet 1.b produced at the fifth step a significant model (χ 2 = 28.449, P < 0.001), although with a low pseudo-explained variance (4.9%). This model presented one age group with a significant β (excluding the reference category), the oldest participants. The correspondent value of Exp(β), or the odds ratio, can be interpreted as an increase of 2.534 in the odds of perceiving to receive unuseful information when asking for an OTC drug for participants with 75 years or older, when compared to the youngest group.
Facet 2 did not prove to be explained by the variables studied, since no significant model was obtained. This meant participant commercialistic perception of pharmacies might be explained by other variables rather than gender, age, education, occupational status, country region, or chronic patient status. In contrast, for Facet 3, ie pharmacist’s contribution to health care decisions, was obtained a five-step model (χ 2 = 35.159, P < 0.001), explaining the equivalent to 4.5% variance and with an acceptable goodness-of-fit (χ 2 = 7.459, P = 0.488). Here, not only age groups but also educational levels were the relevant predictors. The likelihood of agreeing or not with pharmacist’s contributions to treatment decisions was significantly explained if the participant held a degree (OR = 2.474) and belonged to the older age groups (ie from 55 years onward). Compared to illiterate respondents, the odds of not agreeing with pharmacists’ participation in treatment decisions were 2.474 greater for graduates. The odds of the oldest participants (⩾75 years) being in disfavour of a pharmacist’s interference were greater (OR = 3.882) than the odds of the 55–74 years old participants (OR = 2.382), both compared to the youngest cohort.
The participants’ awareness of graduated professionals, measured by his/her correct pharmacist identification among other pharmacy staff (Facet 4), was also explained by educational level and age, including participant occupational status. A significant model was calculated at step four (χ 2 = 204,078, P < 0.001), with a pseudo-explained variance of 21.3% and an adequate goodness-of-fit (χ 2 = 3.032, P = 0.882). Here, all educational levels produced a significant β, except for participants with minimum literacy (ie knowing how to read and write, but without finishing the primary school). The likelihood of correct pharmacist recognition, by comparison to illiterate users, increased from primary education to graduate users, with the later having a 12.509 greater chance of correct pharmacist identification when compared to illiterate participants. In terms of age groups, the 55–74 years group presented an odds ratio of 0.504, while participants 75 years old or more presented a value of 0.397. This indicated, by comparison with the reference category (18–34 years old), that being a pharmacy user older than 55 years multiplied the odds of correctly recognizing the pharmacist by 0.504 or 0.397, ie decreases the odds of correct pharmacist recognition in 49.6% and 60.3%, respectively. Finally, one unit increase in occupational status, ie switching from economically inactive to an employed or self-employed condition, multiplied the likelihood of correctly answered the pharmacist recognition item by 1.409.
Discussion
These results obtained from this sample of Portuguese general public, showed a predominance of older female participants, with a low literacy level and a range of chronic conditions, especially rheumatic problems. Around 32% of the sample reported having a chronic condition most certainly experienced with primary health care, including a regular contact with community pharmacy services, where ambulatory patients obtain their medicine necessary to control their conditions.
Perceptions of pharmacy usage revealed three quarters of the represented population would expect the pharmacists to take an active role in their treatment decisions, with older people less in favour. This belief was certainly construct on users’ perceptions of pharmacist professional competencies, which in turn should result from pharmacist–patient interactions, and in particular from interpersonal communication processes. However, approximately one-third reported receiving their prescribed medication without necessarily communicating with the person dispensing the medication, while one-fifth of the population considered the information received on minor conditions as irrelevant, especially if older, less literate, economically inactive and suffering from a chronic condition. Additionally, users who did not communicate with the pharmacy staff presented similar proportions of agreement or disagreement with pharmacists’ treatment intervention. All these results suggest that user belief in the pharmacist’s therapeutic competencies may be grounded on convictions here not investigated, probably beyond the professional–customer communication and counter interaction. The wish for pharmacist treatment intervention was either a strong desirability bias in response or users were looking for additional therapeutic security, without realizing how the professionals should be doing their job, and what to exactly expect from practitioners which have been under constant influences to adopt an extended role.
One user perception that might have been an influential factor, thus contributing to the quality of the pharmacist–patient relationship, was the poor acknowledgment of different workers at the community pharmacy counter. More than half of the represented population was not able to recognize if the interaction occurred with a graduated professional or someone else. This was even poorer, again for older, less literate, economically inactive pharmacy users and those who had a chronic condition, supposedly under some type of continuous drug therapy. This is an important issue, because it is known that technicians are in most cases exclusively trained for supply work, in theory differing from pharmacists by the limited cognitive service they can provide to patients. Therefore, pharmacy users were not receiving from graduated pharmacists a type of service which distinguished them from technicians. This suggest, among other implications, that current standards of practice, as well as pharmacists’ professional role extension, such as pharmaceutical care programmes for people with chronic conditions, known to be implemented in major urban areas, were not being comprehensively integrated by the Portuguese general public. Nonetheless, pharmacies were perceived as oriented to provide a health care service rather than to be oriented for product trading, although one quarter of the population manifested uncertainty about the focus of pharmacies. This reinforced the need for role clarification among service users.
Regression models offered one explanation regarding the impact of background and demographic variables into three of the pharmacy usage facets: OTC counselling, pharmacist treatment intervention and pharmacist recognition. Considering overall results, the models proposed for the different facets provided confidence in the importance of age was the most influential predictor, followed by educational level. Besides these predictors, occupational status was also important to explain the correct pharmacist identification. Older and less educated members of the public presented an increased likelihood of perceiving negatively the current pharmacist role, with less value attached to pharmacist intervention for treatment options, including self-care. Additionally, being economically inactive increases the odds of not making a full use of the potential pharmacist expertise. Conversely, younger and more educated users have a better perception of the pharmacy staff and can establish a better interpersonal rapport with professionals. These are good indications, in the context of Portuguese society and educational development. It seems to exist a favourable social environment for service recognition, thus contributing to the improvement of the community pharmacist role.
Variables such as country region and gender were not important to explain the studied pharmacy users’ cognitions and behaviours. More surprisingly, being or not a patient with a chronic condition, theoretically an important predictor, but did not prove to be significant for any of the usage facets studied. Other associated variables, such as age, could have had a possible confounder effect on the main cognitive predictor – education, not to mention the possibility of interactions between variables. Although chronic condition status was a weak predictor, actually such users presented the poorer overall cognitive results. This was unexpected. Knowing these patients were probable drug users and thus likely to regularly contact the pharmacy staff. A possible explanation for this variable negative influence on user perceptions might be given by the common qualities associated with people with chronic conditions and on long-term treatments: persons with stable health problems are perceived by the pharmacy staff as being under control over repeated medication, in addition to be generally aged, less educated, and consequently less demanding.
Study limitations existed besides the ones related to analytical procedures, mentioned in the previous paragraph, and should be considered when reviewing the results. First, the sampling method does not collect information from pharmacy users with mobile or ex-directory telephone numbers, although the panel has been used for national health services research and non-response did not suggest any relevant result distortion. Second, it is not possible to determine bias that could have been introduced if other family members were also frequent pharmacy users and hold different opinions. Third, facets wording and constructing would have benefited from a previous pilot study, increasing their validity and reliability. Finally, rural versus urban comparisons were not considered, as rural pharmacies geographic distribution could compromise their anonymity.
Conclusions
The national sample of community pharmacy users was composed largely of older inhabitants, with a proportion of chronic patients. The findings suggested the Portuguese population have an image of community pharmacy service that differ from the desired by professionals. The distance to the desired professional role perception was greater for aged, less educated and economically inactive pharmacy users.
In view of the current trends for pharmacy practice and the implemented pharmaceutical care programmes, the quality of pharmacist–user interactions needs to be extended and improved. Since public expectations do not always tie in with the professional development proposed by academic and professional bodies, educational interventions are needed. These should be designed according to each pharmacy user’s strata, taking advantage of Portuguese societal differences.
Acknowledgements
Dr Teresa Contreiras and Dr Baltazar Nunes, ONSA, Portugal. FCT Programa Praxis XXI BD/9363/96 QCA II.
Appendix 1 Telephone interview schedule
Is it possible to talk with the family head, or alternatively, with the person who most often uses the community pharmacy?
Take down the name of the person who is going to respond.
If these are unavailable, another 18 years old person can participate, if he/she went to the pharmacy at least once in the last month.
1. Please, think about what usually happens when you visit a community pharmacy, and answer YES (1), NO (2) or DON’T KNOW (8), to the following statements.
If no response, please use NO ANSWER (9).
1.1. You fill up a prescription without necessarily talk to the staff. (Facet 1.a – aimed response, NO).
1.2. When asking for a non-prescribed drug, usually you receive useful information. (Facet 1.b – aimed response, YES).
2. Please, give us your opinion to the following statements by answering YES (1), NO (2) or DON’T KNOW (8).
If no response, please use NO ANSWER (9).
2.1. Community pharmacies are more concerned with business than with user’s health. (Facet 2. – aimed response, NO).
2.2. Community pharmacists’ opinions should be included in treatment decisions. (Facet 3 – aimed response, YES).
2.3. Pharmacists are all those who work at the pharmacy and know how to dispense prescribed drugs. (Facet 4 – aimed response, NO).
Thank you very much for your cooperation.


