


Fe deficiency is a major public health problem worldwide( Reference McLean, Cogswell and Egli 1 ). Infants aged >4–6 months are at particular risk as their dietary Fe intakes are often insufficient to support increased physiological requirements during rapid growth. Fe-deficiency anaemia in early childhood has been associated with long-lasting and potentially irreversible cognitive and behavioural delays( Reference Lozoff, Beard and Connor 2 ). Provision of an adequate amount of Fe in infancy is therefore essential to reduce the risk of deficiency and avoid its negative effects. Both Fe supplements( Reference Lind, Lönnerdal and Stenlund 3 – Reference Ziegler, Nelson and Jeter 6 ) and Fe-fortified formula( Reference Szymlek-Gay, Ferguson and Heath 7 – Reference Moffatt, Longstaffe and Besant 11 ) have been effective in improving Fe status and reducing the prevalence of Fe deficiency in young children. However, concerns have been raised about Fe supplementation of Fe-sufficient infants, including reduced infant growth( Reference Iannotti, Tielsch and Black 5 , Reference Ziegler, Nelson and Jeter 6 , Reference Lind, Seswandhana and Persson 12 , Reference Dewey, Domellöf and Cohen 13 ) and increased morbidity( Reference Iannotti, Tielsch and Black 5 , Reference Dewey, Domellöf and Cohen 13 ).
Fe supplements and fortification Fe appear to follow different metabolic pathways in infants, as supplemental Fe has been shown to be stored in ferritin, whereas fortification Fe seems to be utilised for Hb synthesis( Reference Domellöf, Lind and Lönnerdal 14 ). The different targeting has been suggested to be due to the high absorption rate of supplemental Fe( Reference Andersson and Hurrell 15 ), which is often provided in a single daily dose without food. This can result in a high postabsorptive peak in serum Fe, which mobilises hepcidin to divert Fe to storage( Reference Domellöf, Lind and Lönnerdal 14 ). High peaks in serum Fe may also lead to an increase in circulating non-transferrin-bound Fe( Reference Brittenham, Andersson and Egli 16 ), resulting in the production of reactive oxygen species( Reference Britton, Leicester and Bacon 17 ). Fe-mediated oxidative stress has been proposed to be responsible for the negative effects of excessive Fe supplementation, as suggested by findings in a mouse model( Reference Kaur, Peng and Chinta 18 ). Recently, however, high-Fe-fortified foods consumed in infancy have also been shown to adversely affect the long-term neurodevelopment of children with initially high Hb concentrations (>128 g/l)( Reference Lozoff, Castillo and Clark 19 ) and increase morbidity in settings with high rates of infection( Reference Soofi, Cousens and Iqbal 20 ). The mechanisms behind these observations are still unknown, making it difficult to design effective yet safe programmatic strategies for the prevention of Fe deficiency in early childhood.
The adverse effects of Fe supplements or high-Fe-fortified foods on infant health and development may possibly be mediated through the negative effect of Fe on Zn absorption and subsequently Zn status( Reference Lönnerdal 21 ). Alternatively, the impairment in Zn status due to Fe intakes may occur after absorption, as excessive Fe intakes can lead to an increase in circulating non-transferrin-bound Fe( Reference Brittenham, Andersson and Egli 16 ), which can induce the formation of reactive oxygen species and an immune response( Reference Britton, Leicester and Bacon 17 ), and consequently result in a decline in plasma Zn concentration( Reference Brown 22 ). Inadequate Zn status has been associated with impaired growth, poor immune function and compromised neurobehavioural function( Reference Krebs, Miller and Hambidge 23 – Reference Georgieff 25 ). Zn absorption, however, appears to be reduced by Fe only when both minerals are provided together as a supplement in aqueous solutions and in disproportionate molar doses( Reference Lönnerdal 21 , Reference Lim, Riddell and Nowson 26 ). Whether Fe supplements given alone compromise infant Zn nutrition is still unclear( Reference Lönnerdal 21 , Reference Fischer Walker, Kordas and Stoltzfus 27 – Reference Domellöf, Hernell and Abrams 29 ). When present as a fortificant, Fe does not appear to inhibit Zn absorption( Reference Fairweather-Tait, Wharf and Fox 30 – Reference Esamai, Liechty and Ikemeri 32 ), impair Zn status( Reference Esamai, Liechty and Ikemeri 32 – Reference Gera, Sachdev and Boy 34 ) or result in measurable circulating non-transferrin-bound Fe( Reference Brittenham, Andersson and Egli 16 ). Few studies, however, have addressed this in infants. Thus, the aim of this study was to determine whether the mode of oral Fe administration (i.e. Fe supplementation v. fortification Fe) or the amount of Fe habitually consumed (i.e. high v. low Fe intakes) affects Fe absorption and systemic Fe utilisation in healthy, term, Fe-sufficient 6-month-old infants. We also determined the effects of these interventions on Zn absorption and the indicators of Fe and Zn status, as well as growth.
Methods
Study design and participants
This was a 45-d, partial double-blind (formula groups blinded), parallel, three-group, randomised intervention trial with a 1:1:1 participant allocation ratio. The trial was conducted from October 2010 to May 2012 in Umeå, Sweden. Infants were identified through the Swedish population register, and all those residing locally and aged 5–6 months during the recruitment period (October 2010–March 2012) were invited to participate. Infants were eligible for the trial if they were healthy, 6 months old at baseline and had been predominantly formula-fed before enrolment. Infants were excluded if they were (1) born preterm (<37 weeks of gestation), (2) had low birth weight (<2500 g), (3) had a baseline Hb concentration <100 g/l, (4) had a baseline serum ferritin concentration <12 μg/l, (5) had illness or consumed medications known to interfere with Fe or Zn absorption, (6) had ever received Fe medications or supplements, (7) were currently consuming Zn supplements or (8) had feeding problems. Previous use of Fe-fortified infant formula or Fe-fortified infant foods did not preclude participation in the trial. This study was conducted according to the guidelines laid down in the Declaration of Helsinki, and all procedures were approved by the Ethics Committees of Umeå University (Umeå, Sweden) and ETH Zurich (Zurich, Switzerland). Written informed consent was obtained from both parents of all participating infants. This trial was registered at www.clinicaltrials.gov as NCT01216709.
Sample size
Sample size calculations were based on previous data on the incorporation of Fe-stable isotopes into erythrocytes in infants( Reference Davidsson, Ziegler and Kastenmayer 35 ). Assuming an sd of 0·25 for log-transformed incorporation data, we estimated that twenty-one infants were required per group to detect a 40 % difference in incorporation of Fe into erythrocytes between any two groups with 80 % power and a two-sided α of 5 %. Allowing for approximately 15 % attrition, twenty-four infants were enrolled in each group. The sample size calculated on the basis of this difference in incorporation of Fe into erythrocytes also allowed 80 % power and a two-sided α of 5 % to detect a 30 % difference in Zn absorption between any two groups, with the assumption of an sd of 11·0 %( Reference Abrams, Griffin and Davila 36 ).
Randomisation and blinding
A computer-generated, permuted-block (block size, n 3) randomisation sequence with stratification by sex was used to randomly assign seventy-two eligible infants to one of three groups: high-Fe formula (n 24), low-Fe formula (n 24) or Fe drops (n 24); three-digit codes were used to indicate the treatment groups. Infants were enrolled and assigned to the interventions by two paediatric research nurses who were blinded to the allocation sequence. Allocation concealment was achieved via secure storage of the randomisation sequence separately from the participant database. Neither the trial participants nor the researchers were aware of the formula group assignment. The codes were broken when data collection, biochemical analyses and data entry were completed.
Interventions and adherence
For the duration of this 45-d study, parents were asked to feed their infant daily (except for day 31: Fe and Zn absorption test day) 534 ml of high-Fe formula (high-Fe formula group), low-Fe formula (low-Fe formula group) or formula with no added Fe (Fe drops group). The formulae were identical in appearance, taste and composition with the exception of Fe content. The formulae were manufactured by Semper AB, Sweden, and had the following analysed nutrient content: 12·4 mg Fe as ferrous sulphate/l (95·0 mg Fe/kg powdered formula), 3·9 mg Zn/l, 132·0 mg ascorbic acid/l and 13·4 g protein/l in the high-Fe formula; 2·3 mg Fe as ferrous sulphate/l (18·0 mg Fe/kg powdered formula), 3·9 mg Zn/l, 131·3 mg ascorbic acid/l and 13·2 g protein/l in the low-Fe formula; and 0·5 mg Fe/l (4·0 mg Fe/kg powdered formula), 3·8 mg Zn/l, 131·3 mg ascorbic acid/l and 13·1 g protein/l in the formula with no added Fe. The formulae were packaged into identical foil bags. The bags were marked with only the three-digit randomisation code. The formulae were provided to the parents as powder in pre-weighed daily portions of 69·5 g. Parents were asked to mix this quantity of formula with 480 ml of water. To ensure correct formula dilutions, parents were given a 500-ml graduated cylinder to assist with the measuring of water. Each parent was asked to feed their infant the assigned formula as three meals each day. Parents of infants in the Fe drops group were also asked to give their child 0·42 ml of oral Fe drops daily in a single dose (except for day 31: Fe and Zn absorption test day) between meals for the duration of the study (15·0 mg Fe as ferrous sulphate/ml; Ferrous Sulfate Iron Supplement Drops; Hi-Tech Pharmacal Co. Inc.). To allow for accurate administration of Fe drops, parents were given a 1-ml graduated oral syringe. The assigned quantity of study formulae (i.e. 534 ml/d of either high-Fe or low-Fe formula, depending on the infants’ group assignment) provided infants in the high-Fe formula group with 6·6 mg Fe/d and infants in the low-Fe formula group with 1·3 mg Fe/d. The formula with no added Fe (i.e. 534 ml/d) and Fe drops (i.e. 0·42 ml/d) provided infants in the Fe drops group with 6·6 mg Fe/d. During the study, infants were not permitted to consume Fe- or Zn-fortified commercial infant foods, non-study infant formula, Fe- or Zn-fortified foods, animal tissue-containing foods, or Fe- or Zn-containing supplements. Infants were allowed to consume ad libitum the following foods provided by the study: infant formula with no added Fe (0·5 mg Fe/l; Semper AB), rice porridge with no added Fe (Oldana AB) and a range of commercially made fruit- and vegetable-based infant foods with no added Fe or Zn and free from animal tissue (Semper AB). Parents were also permitted to feed their infants home-made fruit and vegetable purées. Mothers were able to continue to breast-feed at their discretion.
Adherence to the intervention was assessed by asking each parent to record daily the amount of formula consumed by their infant. Parents of infants in the Fe drops group were also asked to record the volume of drops given to their infant each day and note any case of vomiting or posseting by their infant up to 30 min after the administration of the drops. The adherence data were used to estimate mean daily intakes of study formulae, Fe drops, and Fe and Zn intakes from the interventions.
Socio-demographic, anthropometric, obstetric and neonatal data
Socio-demographic data were collected at baseline using a self-administered questionnaire. Nude weight was measured to the nearest 5 g with digital baby scales (Seca 727; Seca Deutschland). Recumbent length was measured to the nearest 0·1 cm with a paediatric length board (CMS Weighing Equipment Ltd). A non-stretchable measuring tape for head circumference of babies and toddlers (Seca 212; Seca Deutschland) was used to assess each child’s head circumference to the nearest 0·1 cm. Knee–heel length was measured to the nearest 0·1 cm with an infant knemometer (BK5; FORCE Instituttet). All measurements were taken in accordance with standardised procedures( Reference Lohman, Roche and Martorell 37 ). Weight, length and head circumference were measured in duplicate, whereas knee–heel length was measured four times at baseline and at the end of the study. Additional duplicate measurements were taken for weight on day 31. The z scores for weight-for-age, length-for-age and head circumference-for-age were calculated using the World Health Organization Child Growth Standards( 38 ). Obstetric and neonatal data were obtained from hospital records.
Preparation and administration of isotopes
Fe absorption, systemic Fe utilisation and Zn absorption were measured using stable-isotope methods. 57Fe (97·8 % enrichment), 58Fe (99·5 % enrichment), 67ZnO (90·6 % enrichment) and 70ZnO (95·4 % enrichment) were purchased from Chemgas. All isotopic labels were prepared at the Human Nutrition Laboratory at ETH Zurich. 57FeSO4 for oral administration was prepared by dissolving 57Fe in diluted H2SO4. The solution was divided into vials containing 0·67 mg 57Fe (administered to the formula groups) or 2 mg 57Fe (administered to the Fe drops group) in 0·5 ml of solution. 67ZnSO4 for oral administration was prepared by dissolution of 67ZnO in stoichiometric amounts of diluted H2SO4. The resulting 67ZnSO4 solution was subsequently diluted to a Zn concentration of 0·33 mg/g and then aliquoted into vials containing 0·17 mg 67Zn in 0·5 ml of solution. [58Fe]citrate was prepared for intravenous infusion from 58Fe as previously described( Reference Dainty, Roe and Teucher 39 ). The solution was aliquoted into vials containing 50 µg 58Fe in 1 ml of solution. 70ZnCl2 was prepared for intravenous infusion by converting 70ZnO to 70ZnCl2 with diluted HCl adjusted to pH 6 by adding NaHCO3 and diluted by physiological saline to a final Zn concentration of 100 µg/g. The solution was then divided into vials containing 100 µg 70Zn in 1 ml of solution. All vials containing 58Fe and 70Zn were sterilised and checked for sterility and pyrogens at the Cantonal Pharmacy of the University Hospital Zurich.
The isotopes were administered to each infant at 7·3 months of age (ranging from 6·9–7·8 months) on study day 31. The high-Fe formula, formula with no added Fe and Fe drops used on the day of testing were the same as the ones used for the intervention as described above. The formula (either high-Fe formula or formula with no added Fe, depending on the infant’s group assignment) was prepared freshly on the day of testing.
Infants in both formula groups received three meals of 150 ml of high-Fe formula; 0·67 mg 57Fe and 0·17 mg 67Zn were added to each meal (2 mg 57Fe and 0·5 mg 67Zn in total for all three meals) before feeding. The first meal was administered after a 2-h fast, with the second and third meal fed to infants 2 h after the previous meal had been ingested. Each meal was fed under standardised conditions over 15–20 min. After each meal, 6 ml×2 of unlabelled high-Fe formula was administered to each infant to rinse out the bottle. The bottle was weighed immediately before and after feeding. All spills, posseting and other accidental milk losses were removed with pre-weighed napkins. The amount of 57Fe and 67Zn consumed by each infant was calculated by subtracting the amount of 57Fe and 67Zn corresponding to the amount of meal left in the bottle and absorbed in the napkins from the original doses of 0·67 mg 57Fe and 0·17 mg 67Zn. Next, 30 min after the first meal had been ingested, 1 ml of an aqueous solution containing 50 µg 58Fe and 1 ml of an aqueous solution containing 100 μg 70Zn were aspirated into a syringe, injected into a 25-ml infusion bag (0·9 % saline) and infused over 30 min into each infant in the formula groups. The rate of intravenous infusion of Fe was based on the estimated 2 µg/min plasma appearance of Fe normally absorbed from the gastrointestinal tract( Reference Roe, Heath and Oyston 40 ). At completion of the infusion, 5 ml of unlabelled saline was injected into the bag to rinse it out and the saline was infused into the infant. This was carried out twice, and we assumed that no residual isotopes remained in the infusion bag.
Infants in the Fe drops group followed a similar protocol as the formula groups. The Fe drops group received three meals of 150 ml of formula with no added Fe; 0·17 mg 67Zn was added to each meal (0·5 mg 67Zn in total for all three meals) before feeding. The first meal was administered after a 2-h fast. Next, 2 h after the first test meal had been ingested, infants in the Fe drops group were administered 0·4 ml of Fe drops labelled with 2 mg 57Fe; 30 min after the administration of Fe drops, 1 ml of an aqueous solution containing 50 µg 58Fe and 1 ml of an aqueous solution containing 100 µg 70Zn were aspirated into a syringe, injected into a 25-ml infusion bag (0·9 % saline) and infused over 30 min into each infant in the Fe drops group. At completion of the infusion, 5 ml×2 of unlabelled saline was injected into the infusion bag to rinse it out, and the saline was infused into the infant; we assumed that no residual isotopes remained in the infusion bag. Immediately following administration of the intravenous dose, infants were fed the second meal with the third one fed to infants 2 h after the second meal had been ingested. Each meal was fed under standardised conditions over 15–20 min. After each meal, 6 ml×2 of unlabelled formula with no added Fe was administered to each infant to rinse out the bottle. The bottle was weighed immediately before and after feeding. All spills, posseting and other accidental milk losses were removed with pre-weighed napkins. The amount of 67Zn consumed by each infant was calculated by subtracting the amount of 67Zn corresponding to the amount of meal left in the bottle and absorbed in the napkins from the original dose of 0·17 mg.
Neither the formula groups nor the Fe drops group was permitted to consume any food or drink on the day of testing until 2 h after the third meal had been ingested. On the day of testing, the formula groups received a total of 8·1 mg Fe and 2·5 mg Zn, and the Fe drops group received a total of 8·3 mg Fe and 2·4 mg Zn (i.e. Fe/Zn in the test meals/Fe drops plus the isotope labels). This amount of Fe is equivalent to 1 mg Fe/kg body weight, assuming a mean body weight of 8 kg at 7 months( 41 ).
Sample collection
Venous blood samples were drawn at baseline, on day 31 and at the end of the study (day 45) after a 2-h fast for the determination of Fe and Zn status indices (each time point), as well as Fe isotopic composition (day 45 samples only). The day 31 samples were collected before the administration of stable isotopes. Samples were collected by experienced paediatric research nurses into an EDTA-containing tube, a serum separator tube and a heparinised trace element-free tube (Becton, Dickinson and Company). The time of sample collection was recorded. Baseline sampling and end-of-study sampling were postponed by 2 weeks if the child was ill or recently immunised to minimise the influence of an acute-phase response on blood indices. A spot urine sample was collected 96 h after the infusion with stable isotopes and stored at −20°C until Zn isotopic composition determination( Reference Abrams 42 ).
Laboratory analyses
Hb, mean corpuscular volume, serum ferritin, serum Fe and serum transferrin were analysed within 2–4 h of collection at the Department of Clinical Chemistry, Umeå University, Sweden. Hb and mean corpuscular volume were measured in whole blood using a Sysmex XE-5000 Automated Haematology Analyser (Sysmex). Blood in the serum separator tube was centrifuged for 10 min at 3000 rpm, and the separated serum was analysed for ferritin using a Roche Cobas 6000 (Roche Diagnostics), and Fe and transferrin were analysed using a Vitros 5.1 FS (Ortho Clinical, Johnson & Johnson AB). Values for the controls were within the certified ranges for all analyses. Serum Fe and transferrin concentrations were used to calculate transferrin saturation using the following formula: transferrin saturation (%)=serum Fe (μmol/l)/(serum transferrin (g/l) ×25·1)×100( Reference Rustad, Felding and Lahti 43 ). The remaining serum was stored at −80°C until hepcidin and high-sensitivity C-reactive protein analyses. Hepcidin and high-sensitivity C-reactive protein were determined at the Department of Clinical Sciences, Pediatrics, Umeå University, Sweden, by an enzyme immunoassay using commercial kits (Human Hepcidin Kit S-1337; Bachem AG, and Human C-Reactive Protein, Quantikine®ELISA; R&D Systems Europe Ltd, respectively). Analytical accuracy was checked by analysing in-house serum controls at low and high concentrations. For hepcidin, the analysed mean values for the quality control sera were 25·9 (sd 2·4; CV 9·3 %; n 5) µg/l at 25·0 µg/l (low concentration) and 42·8 (sd 5·2; CV 12·3 %; n 5) µg/l at 40·0 µg/l (high concentration). For high-sensitivity C-reactive protein, the analysed mean values for the quality control sera were 154·5 (sd 14·5; CV 9·4 %; n 6) ng/ml at 150 ng/ml (low concentration) and 3137·7 (sd 202·4; CV 6·4 %; n 6) ng/ml at 3000 ng/ml (high concentration).
Blood samples in the heparinised trace element-free tube were refrigerated immediately after collection. Plasma was separated within 2 h and stored at −80°C until Zn analysis. For day 45 samples, erythrocytes were stored at −20°C for determining Fe isotopic composition. Zn concentration and Fe isotopic composition were measured at the Human Nutrition Laboratory at ETH Zurich. Zn was measured using flame atomic absorption spectrophotometry (Varian AA240FS; Varian Inc.) after dilution with 10 % HNO3 using commercial aqueous standards (Titrisol; Merck) for external calibration. Analytical accuracy was checked by analysis of commercially available serum controls (Seronorm Trace Elements Serum Levels 1 and 2; Sero AS). The analysed mean values for the quality control sera were 25·4 (sd 0·6; n 5) µmol/l for Level 1 and 31·3 (sd 0·6; n 5) µmol/l for Level 2. The certified values were 24·1–29·2 µmol/l for Level 1 and 27·1–47·5 µmol/l for Level 2. The method showed a detection limit of 0·50 µmol/l and its intra-assay and inter-assay CV were 3 and 5 %, respectively. For Fe isotopic analysis, erythrocytes were first mineralised by microwave digestion, and Fe was then separated by anion-exchange chromatography followed by a solvent–solvent extraction step into diethyl ether( Reference Walczyk, Davidsson and Zavaleta 44 ). Fe isotopic composition was measured by negative thermal ionisation–MS using a magnetic sector field MS (Finnigan MAT 262; Thermo Finnigan), equipped with a multi-collector system for simultaneous ion beam detection( Reference Walczyk, Davidsson and Zavaleta 44 ). Circulating Fe was determined for each infant using an assumed blood volume of 65 ml/kg( Reference Bratteby 45 ), the measured Hb concentration and the known concentration of Fe in Hb of 3·47 mg/g. Fractional incorporation of 57Fe and 58Fe into erythrocytes 14 d after isotope administration was calculated according to isotopic dilution principles as described earlier( Reference Walczyk, Davidsson and Zavaleta 44 ). The erythrocyte incorporation of 58Fe indicates Fe utilisation. The absorption of 57Fe was calculated by dividing the percentage of erythrocyte incorporation of 57Fe by the fractional erythrocyte incorporation of 58Fe.
Urine samples were analysed for Zn isotopic composition under chemical blank monitoring at the Human Nutrition Laboratory at ETH Zurich. Samples were concentrated by freeze-drying, mineralised by microwave digestion (MLS-ETHOS plus; MLS GmbH) using a mixture of HNO3 and H2O2, and Zn was then separated from the sample matrix by anion-exchange chromatography as described previously( Reference Wegmüller, Tay and Zeder 46 ). All acids used for the preparation of samples were ultrapure. 70Zn-to-66Zn:67Zn-to-66Zn ratios were measured to determine 70Zn and 67Zn enrichment in the urine samples by inductively coupled plasma MS using a high-resolution, double-focusing, magnetic sector field multi-collector MS (Neptune; Thermo-Finnigan). Fractional absorption of 67Zn was calculated from 67Zn:70Zn ratios as described by Friel et al.( Reference Friel, Naake and Miller 47 ).
Fe deficiency was defined as depleted Fe stores, Fe-deficient erythropoiesis and Fe-deficiency anaemia( Reference Gibson 48 ). Depleted Fe stores were defined as a serum ferritin concentration <12 µg/l( 49 ) in the absence of Fe-deficient erythropoiesis or Fe-deficiency anaemia. Fe-deficient erythropoiesis was defined as ≥2 abnormal values for serum ferritin (<12 µg/l), mean corpuscular volume (<71 fl)( Reference Domellöf, Dewey and Lönnerdal 50 ) and transferrin saturation (<10 %)( Reference Saarinen and Siimes 51 ) in the absence of anaemia (Hb ≥100 g/l). Fe-deficiency anaemia was defined as Hb <100 g/l( Reference Domellöf, Dewey and Lönnerdal 50 ) in the presence of Fe-deficient erythropoiesis. Infants with missing data at each time point for serum ferritin, mean corpuscular volume, transferrin saturation or Hb were excluded from these estimations. Low plasma Zn concentration was defined as <9·9 µmol/l for morning samples and <8·7 µmol/l for samples drawn afternoon( Reference Brown, Rivera and Bhutta 52 ). Fe and Zn deficiency prevalence was estimated after correcting serum ferritin and plasma Zn concentrations for infection for all infants with a C-reactive protein concentration >5 mg/l at baseline, day 31 or day 45 (n 7 at baseline, n 4 on day 31 and n 5 on day 45) as described previously( Reference Thurnham, McCabe and Haldar 53 , Reference Mburu, Thurnham and Mwaniki 54 ).
Statistical analysis
The primary outcomes were Fe absorption and systemic Fe utilisation. The secondary outcomes were Zn absorption and the indices of Fe and Zn status and growth. Descriptive statistics were used to examine participants’ characteristics at birth and baseline. To compare outcomes measured at more than one time point among the three intervention groups (i.e. Fe status indices, plasma Zn concentration and growth indices), in order to utilise all data, we used linear random-intercept models with robust standard errors where repeated measurements were nested within individuals. All models included fixed effects of time and group and their interaction in order to assess differences in change within and between groups. Adjustments were made for a priori-defined covariates: sex and infection (Fe status indices), time of day of blood sampling and infection (plasma Zn), and sex (growth indices). To compare outcomes measured at only one time point among the three groups (i.e. Fe absorption, Fe utilisation and Zn absorption), we used linear regression analyses with robust standard errors. Linear regression models were used to examine the relationship between Fe absorption and Fe utilisation and Fe status indices at day 31; Hb, mean corpuscular volume, serum Fe, serum transferrin, transferrin saturation and serum hepcidin measures were excluded for all infants with a C-reactive protein concentration >5 mg/l, whereas serum ferritin was corrected for infection for all infants with a C-reactive protein concentration >5 mg/l( Reference Thurnham, McCabe and Haldar 53 ). The distributions of residuals from all models were examined, and log-transformations were used where residuals were skewed or exhibited non-constant variance. Where log-transformations were used, results are shown as ratios of geometric means rather than differences of arithmetic means.
Prevalence of Fe deficiency and low plasma Zn concentration was assessed at three time points, and thus random-intercept logistic regression analyses where repeated measurements were nested within individuals were used to assess group effects.
As infants had up to 45 d of adherence data, generalised estimating equation models with exchangeable correlation structures were used to assess differences among the study groups in study formula intakes and Fe and Zn intakes from the interventions.
All analyses were performed with Stata (version 13.1; StataCorp LP). All tests were two-sided and were not adjusted for multiple testing. Statistical significance was determined at P<0·05.
Results
Participants
Invitation letters, followed up by telephone calls, were sent to parents of 2429 infants. Of these, 160 expressed initial interest in participation and ninety-seven were assessed for eligibility. The screening process identified seventy-two eligible infants who were randomly assigned to one of the three intervention groups (Fig. 1). All infants received their allocated intervention; six infants (8·3 %) were lost to follow-up.
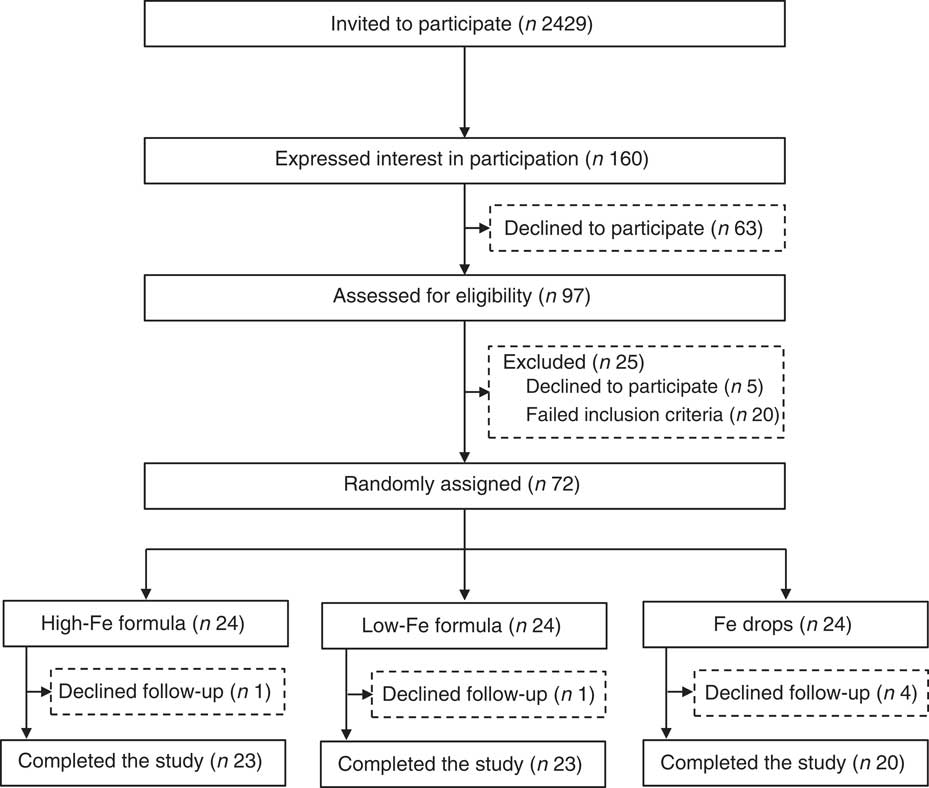
Fig. 1 Flow chart of participants through the study.
The mean age of infants at baseline was 6·1 (sd 0·3) months, and the mean gestational age was 40·1 (sd 1·3) weeks. The majority of infants were boys, were born via vaginal delivery, were not breast-fed at baseline and were from middle-income families. In all, 50 % of mothers had university education. All infants and their mothers were born in Sweden, and all infants’ anthropometric birth indices were within the normal range (Table 1).
Table 1 Characteristics of infants at birth and baseline (Numbers and percentages; mean values and standard deviations)
* Annual post-tax household income. SEK240 000 approximately USD29 000. SEK480 000 approximately USD58 000. Columns do not sum to 100 % because some parents chose not to answer the question.
Adherence to intervention
The mean amount of study formula consumed during the trial was 516 (95 % CI 511, 522) ml/d in the high-Fe formula group, 508 (95 % CI 500, 516) ml/d in the low-Fe formula group and 503 (95 % CI 488, 518) ml/d in the Fe drops group. There was no statistically significant difference among the three groups in the daily amount of study formula consumed during the intervention period (P=0·092).
The required volume of Fe drops (i.e. 0·42 ml/d) was administered to infants in the Fe drops group on 99·9 % of occasions. Accounting for vomiting and posseting, 0·42 ml of Fe drops/d were consumed by infants in the Fe drops group on 95·2 % of occasions. This resulted in the Fe drops group consuming a mean of 0·39 (95 % CI 0·37, 0·42) ml/d of Fe drops.
During the intervention, the study formulae provided 6·4 (95 % CI 6·3, 6·4) mg Fe/d to infants in the high-Fe formula group, and 1·2 (95 % CI 1·2, 1·2) mg Fe/d to infants in the low-Fe formula group. The formula with no added Fe combined with Fe drops provided 5·7 (95 % CI 5·1, 6·3) mg Fe/d to infants in the Fe drops group. Fe intakes from the interventions differed among groups (P<0·001) and were higher in the high-Fe formula group compared with the low-Fe formula group (mean difference: 5·2 (95 % CI 4·8, 5·5) mg Fe/d, P<0·001), higher in the high-Fe formula group compared with the Fe drops group (mean difference: 0·6 (95 % CI 0·3, 1·0) mg Fe/d, P=0·001) and higher in the Fe drops group compared with the low-Fe formula group (mean difference: 4·6 (95 % CI 4·2, 4·9) mg Fe/d, P<0·001).
The high-Fe formula group received 2·0 (95 % CI 2·0, 2·0) mg Zn/d, the low-Fe formula group received 2·0 (95 % CI 1·9, 2·0) mg Zn/d and the Fe drops group received 1·9 (95 % CI 1·9, 2·0) mg Zn/d from the study formulae. Compared with the Fe drops group, Zn intakes from the study formulae were higher in both the high-Fe formula group (mean difference: 0·1 (95 % CI 0·1, 0·2) mg Zn/d, P<0·001) and the low-Fe formula group (mean difference: 0·1 (95 % CI 0·0, 0·1) mg Zn/d, P=0·007).
Iron and zinc status
By 45 d, mean Hb concentration decreased from baseline by 4·9 (95 % CI −8·3, −1·4) g/l in the Fe drops group with no evidence of a change in the high-Fe formula or low-Fe formula groups (Table 2). Because of the decrease in Hb concentration in the Fe drops group, at the end of the study, there was a significant difference in change in the mean Hb concentration between the high-Fe formula and Fe drops groups (intervention effect: 6·3 (95 % CI 1·4, 11·2) g/l). At the end of the study, Hb concentration also tended to be 3·8 (95 % CI −0·6, 8·2) g/l higher in the high-Fe formula group than in the low-Fe formula group (P=0·088). Within-group comparisons showed a 32 (95 % CI 22, 40) % decrease in mean serum ferritin concentration from baseline in the low-Fe formula group with no evidence for a change in the high-Fe formula or Fe drops groups (Table 2). Compared with the low-Fe formula group, at the end of the study, mean serum ferritin concentration was 34 (95 % CI 4, 72) % greater in the high-Fe formula group, and 35 (95 % CI 7, 72) % greater in the Fe drops group. There was no evidence of a change in mean serum transferrin concentration from baseline in the high-Fe formula or Fe drops groups, whereas it significantly increased in the low-Fe formula group, with a mean intervention effect of −0·1 (95 % CI −0·2, 0·0) g/l when both the high-Fe formula group’s and Fe drops group’s values were compared with those of the low-Fe formula group (Table 2). Serum hepcidin concentrations decreased from baseline in all three study groups (all P≤0·022) with no evidence that these changes were related to the intervention (P=0·908). Similarly, despite the significant decrease in mean plasma Zn concentration from baseline in the high-Fe formula group (P=0·020), there was no evidence of significant intervention-related changes in plasma Zn concentrations for the three study groups (P=0·342). There was no evidence of intervention effects on mean corpuscular volume, serum Fe concentration or transferrin saturation (Table 2).
Table 2 Adjusted means at baseline, day 31 and day 45 with estimates of intervention effect for Hb, mean corpuscular volume, serum ferritin, serum iron, serum transferrin, transferrin saturation, serum hepcidin and plasma zinc in the three study groupsFootnote * (Arithmetic/geometric means and 95 % confidence intervals)
* All estimates are from linear random-intercept models with robust standard errors.
† The intervention effect is baseline to day 45 change (day 31 in the case of serum hepcidin) in one study group minus baseline to day 45 change (day 31 in the case of serum hepcidin) in another study group.
‡ Values are arithmetic means.
§ Model adjusted for sex and infection.
|| n at baseline, n at day 31, n at day 45.
¶ Expressed as a difference.
** The within-group comparison is baseline to day 45 change within each study group. The between-group comparison is the intervention effect as described in footnoteFootnote †.
†† Values are geometric means.
‡‡ Expressed as a ratio.
§§ n at baseline, n at day 31.
|||| Model adjusted for time of day of blood sampling and infection.
At baseline, one infant had Fe-deficient erythropoiesis (Fe drops group). At the end of the study, all infants were Fe sufficient (data not shown in tables). In all, five infants had low plasma Zn concentrations at baseline (three in the high-Fe formula group and two in the low-Fe formula group) and three at the end of the study (two in the high-Fe formula group and one in the low-Fe formula group) (data not shown in tables). The intervention had no effect on the risk of developing Fe or Zn deficiency (all P≥0·760).
Growth
Within-group comparisons showed that mean weight, length, head circumference and knee–heel length increased from baseline in all three study groups (Table 3; all P<0·001). We found no evidence of intervention effects on weight, length, head circumference or knee–heel length (Table 3; all P≥0·052).
Table 3 Adjusted means at baseline, day 31 and day 45 with estimates of intervention effect for weight, length, head circumference and knee–heel length in the three study groupsFootnote * (Arithmetic means and 95 % confidence intervals)
* All estimates are from linear random-intercept models with robust standard errors adjusted for sex.
† The intervention effect is baseline to day 45 change in one study group minus baseline to day 45 change in another study group.
‡ n at baseline, n at day 31, n at day 45.
§ Expressed as a difference.
|| The within-group comparison is baseline to day 45 change within each study group. The between-group comparison is the intervention effect as described in footnoteFootnote †.
¶ n at baseline, n at day 45.
Weight-for-age, length-for-age and head circumference-for-age z scores were within the normal range for all infants at all time points (data not shown in tables). Only weight-for-age z scores significantly increased from baseline within each group (high-Fe formula group: 0·17 (95 % CI 0·06, 0·28), P=0·002; low-Fe formula group: 0·13 (95 % CI 0·03, 0·23), P=0·013; and Fe drops group: 0·11 (95 % CI 0·00, 0·21), P=0·046). Head circumference-for-age z scores increased from baseline in the low-Fe formula group (0·14 (95 % CI 0·05, 0·22), P=0·002) and the Fe drops group (0·11 (95 % CI 0·02, 0·21), P=0·018) but not in the high-Fe formula group (0·01 (95 % CI −0·10, 0·11), P=0·900). We observed no within-group changes for length-for-age z scores in any of the three groups (all P≥0·232) (data not shown in tables). There was no evidence of intervention effects on weight-for-age (P=0·708), length-for-age (P=0·734) or head circumference-for-age (P=0·142) z scores (data not shown in tables).
Iron absorption and utilisation
There was no evidence that mean fractional Fe absorption or erythrocyte Fe utilisation differed among the three study groups (Table 4; all P≥0·534). Fe absorption was inversely correlated with serum ferritin concentration (Table 5, Fig. 2), such that a 10 % increase in serum ferritin (e.g. an increase from 60 to 66 µg/l) corresponded to a 3·9 % decrease in Fe absorption in the high-Fe formula group, a 5·6 % decrease in the low-Fe formula group and a 4·8 % decrease in the Fe drops group. Fe absorption was also inversely correlated with serum hepcidin concentration (Table 5, Fig. 3), with each 10 % increase in serum hepcidin (e.g. an increase from 40 to 44 µg/l) relating to a 2·6 % decrease in Fe absorption in the high-Fe formula group, a 6·5 % decrease in the low-Fe formula group and a 5·0 % decrease in the Fe drops group. In the low-Fe formula group only, Fe absorption was positively associated with serum Fe concentration, serum transferrin concentration and transferrin saturation (Table 5). The associations between Fe absorption and Hb concentration and mean corpuscular volume were not significant in any of the intervention groups (Table 5; all P≥0·216). Fe utilisation was negatively correlated with mean corpuscular volume only in the low-Fe formula group (r −0·541, P=0·011, n 21). Fe utilisation did not significantly correlate with Hb, serum ferritin, serum Fe, serum transferrin, transferrin saturation or serum hepcidin in any of the three groups (all P≥0·071; data not shown in the tables).
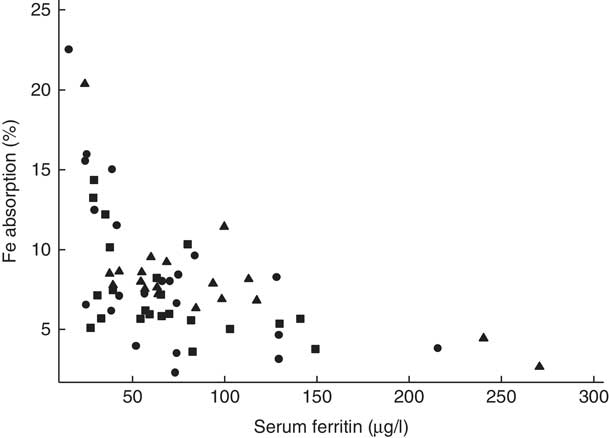
Fig. 2 Scatter plot depicting the relationship between fractional iron absorption and serum ferritin concentration (measured on day 31) in healthy, 7-month-old, Swedish infants habitually consuming high-iron formula (![]() , n 22), low-iron formula (
, n 22), low-iron formula (![]() , n 22) or iron drops (
, n 22) or iron drops (![]() , n 19). Serum ferritin concentrations were corrected for infection for all infants with a C-reactive protein concentration >5 mg/l(
Reference Thurnham, McCabe and Haldar
53
). Linear regression on log-transformed values showed a negative correlation between fractional iron absorption and serum ferritin concentration across the three groups (r −0·64, P<0·001, n 63).
, n 19). Serum ferritin concentrations were corrected for infection for all infants with a C-reactive protein concentration >5 mg/l(
Reference Thurnham, McCabe and Haldar
53
). Linear regression on log-transformed values showed a negative correlation between fractional iron absorption and serum ferritin concentration across the three groups (r −0·64, P<0·001, n 63).
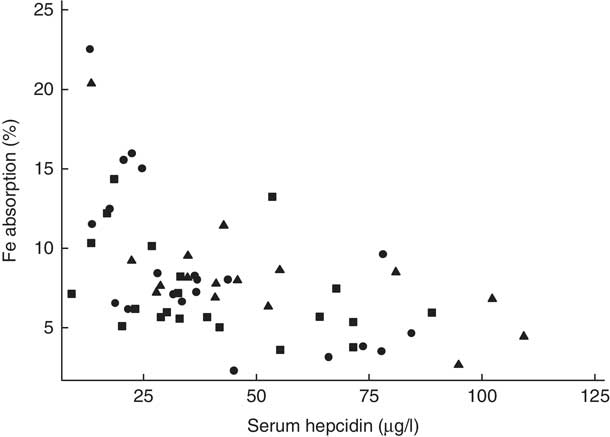
Fig. 3 Scatter plot depicting the relationship between fractional iron absorption and serum hepcidin concentration (measured on day 31) in healthy, 7-month-old, Swedish infants habitually consuming high-iron formula (![]() , n 21), low-iron formula (
, n 21), low-iron formula (![]() , n 21) or iron drops (
, n 21) or iron drops (![]() , n 16). Infants with an elevated C-reactive protein concentration (>5 mg/l) were excluded. Linear regression on log-transformed values showed a negative correlation between fractional iron absorption and serum hepcidin concentration across the three groups (r −0·59, P<0·001, n 58).
, n 16). Infants with an elevated C-reactive protein concentration (>5 mg/l) were excluded. Linear regression on log-transformed values showed a negative correlation between fractional iron absorption and serum hepcidin concentration across the three groups (r −0·59, P<0·001, n 58).
Table 4 Absorption of iron (from an 8·1 or 8·3 mg dose) and zinc (from a 2·4 or 2·5 mg dose) in healthy, 7-month-old, Swedish infants habitually consuming high-iron formula, low-iron formula or iron dropsFootnote * (Geometric/arithmetic means and 95 % confidence intervals)
* All estimates are from linear regression models with robust standard errors.
† Values are geometric means.
‡ Values are arithmetic means.
Table 5 Univariate correlations between iron absorption and iron status indices in healthy, 7-month-old, Swedish infants habitually consuming high-iron formula, low-iron formula or iron dropsFootnote * (β-Coefficients and 95 % confidence intervals)
* All estimates are from linear regression models. Fe indices were measured on day 31.
† Infants with a C-reactive protein concentration >5 mg/l or a missing value on day 31 were excluded: n 1 (missing value for C-reactive protein) in the high-Fe formula group, n 1 (C-reactive protein >5 mg/l) in the low-Fe formula group and n 3 (n 1, missing value for C-reactive protein; n 2, C-reactive protein >5 mg/l) in the Fe drops group for Hb, mean corpuscular volume, serum Fe, serum transferrin and transferrin saturation; n 0 in the high-Fe formula group, n 1 (C-reactive protein >5 mg/l) in the low-Fe formula group and n 2 (C-reactive protein >5 mg/l) in the Fe drops group for serum hepcidin.
‡ Values were corrected for infection( Reference Thurnham, McCabe and Haldar 53 ).
Zinc absorption
There was no evidence that mean fractional Zn absorption differed among the three study groups (Table 4; P=0·284).
Discussion
This is the first study to investigate whether the mode of oral Fe administration or the amount of Fe habitually consumed will affect Fe absorption, Fe utilisation and Zn absorption in healthy, term, predominantly formula-fed, Fe-sufficient infants. We measured intestinal Fe absorption and systemic Fe utilisation directly by using both an oral and an intravenous tracer. This study showed that the type of Fe consumed, whether provided as an oral supplement or as a fortificant in infant formula daily for 45 d, did not affect Fe absorption, Fe utilisation or Zn absorption in infants. We also found no evidence that high intakes of fortification Fe compared with low intakes had an effect on these parameters.
Our results indicate that in well-nourished, predominantly formula-fed, Fe-sufficient infants Fe stores, rather than the mode of oral Fe administration or the habitual amount of Fe consumed, play a more important role in the regulation of Fe absorption. Fe stores, as determined by serum ferritin, were inversely correlated with Fe absorption and explained between 35 and 62 % of its total variability across the three study groups. This is supported by our previous research, which has shown that low Fe stores up-regulate Fe absorption from infant formula in healthy, formula-fed infants( Reference Szymlek-Gay, Lönnerdal and Abrams 55 ), and other studies that have shown that Fe absorption from an Fe supplement is inversely related to infants’ Fe stores( Reference Abrams, O’Brien and Wen 56 ). In addition, we found evidence for a moderate-to-strong negative correlation between Fe absorption and serum hepcidin in all three groups in the current study. Hepcidin, a hormone produced primarily by the liver in response to high plasma Fe and inflammation( Reference Nemeth, Tuttle and Powelson 57 , Reference Ganz 58 ), regulates Fe absorption and its distribution to tissues( Reference Ganz 58 ). Hepcidin binds to the Fe exporter ferroportin causing its degradation, and thus inhibiting efflux of Fe into plasma( Reference Ganz 58 ). Hepcidin may also reduce Fe absorption by inhibiting the expression of enterocyte divalent metal ion transporter 1( Reference Brasse-Lagnel, Karim and Letteron 59 ). In contrast, Fe deficiency, hypoxia and erythropoietic activity down-regulate hepcidin production, which results in an increase in Fe absorption( Reference Nemeth and Ganz 60 ). Except for formula and Fe drops intakes, no additional dietary data were available in the current study. However, as infants were not permitted to consume foods fortified with Fe or foods containing animal tissue, and as we provided all foods to be consumed during the study, it can be assumed that all or most of the Fe consumed during the trial was provided by the interventions. As these Fe intakes were within a very narrow range in each group, we did not investigate the correlations between dietary Fe intakes and Fe absorption, Fe stores or serum hepcidin. Nevertheless, we have previously shown that Fe intakes are not associated with either Fe absorption from infant formula or Fe stores in healthy, formula-fed infants( Reference Szymlek-Gay, Lönnerdal and Abrams 55 ).
Fractional Fe absorption from infant formula in our study was comparable with previous reports( Reference Davidsson, Ziegler and Kastenmayer 35 , Reference Kastenmayer, Davidsson and Galan 61 – Reference Stekel, Olivares and Pizarro 63 ). Although daily consumption of approximately 500 ml of low-Fe formula (i.e. 1·2 mg Fe/d) for 1·5 months as the primary source of Fe resulted in reduced Fe stores and increased serum transferrin concentrations, all infants in the low-Fe formula group were Fe sufficient at the end of the study. However, if the low-Fe formula were to be consumed in the long term in the quantities observed in our study and in the absence of Fe-rich foods, it is unlikely that it would provide sufficient Fe to maintain adequate Fe status in infancy – a conclusion in line with recent recommendations on fortification levels of infant and follow-on formulae( Reference Hernell, Fewtrell and Georgieff 64 ).
Few studies have determined Fe availability to infants from supplements. The 7·7 % Fe absorption from Fe drops in our study is similar to that of 7·6 % found by Heinrich et al.( Reference Heinrich, Gabbe and Whang 65 ) who administered 10 mg of ferrous sulphate to 1–18-month-old Fe-sufficient infants and similar to that of 6·6–8·5 % from 3 mg of ferrous sulphate previously found by our group in 6–9-month-old Fe-sufficient infants( Reference Domellöf, Lönnerdal and Abrams 66 ). In contrast, at 13·7 %, Fe absorption from 5 mg of ferrous sulphate appeared to be higher in 13-month-old children in the study by Abrams et al.( Reference Abrams, O’Brien and Wen 56 ) compared with ours; however, the infants had poorer Fe status compared with the infants in our study. Furthermore, the supplement in the study by Abrams et al.( Reference Abrams, O’Brien and Wen 56 ) was administered with apple juice that contained ascorbic acid at a 3:1 molar ratio of ascorbic acid:Fe, which could also help explain the higher Fe absorption in their study compared with ours. The addition of ascorbic acid at a molar ratio of ≥2:1 of ascorbic acid:Fe has been shown to enhance the absorption of Fe from ferrous sulphate( Reference Hurrell 67 ). In our study, the Fe drops were administered 2 h after the ingestion of 150 ml of the formula with no added Fe (131·3 mg ascorbic acid/l) and ≥1 h before the next meal was consumed. As the formula would have emptied from the stomach after 2 h( Reference Cavell 68 ) and the drops would have been absorbed before the next meal was provided, it is unlikely that the ascorbic acid in the formula would have interacted with the Fe drops. Fomon et al.( Reference Fomon, Ziegler and Nelson 69 ) found that only 4·4 % of Fe was incorporated into erythrocytes in 2-month-old formula-fed infants from 8 mg ferrous sulphate administered with ascorbic acid at a 1:1 molar ratio of ascorbic acid:Fe.
It is still uncertain whether the current study lends support to our previous report that fortification Fe is primarily utilised for Hb synthesis( Reference Domellöf, Lind and Lönnerdal 14 ). The consumption of 6·4 mg of fortification Fe per day resulted in a 6·3 g/l higher Hb concentration compared with that achieved with Fe drops and does appear to confirm the earlier observation. Although the high-Fe formula group consumed 0·6 mg/d more Fe from the intervention compared with the Fe drops group, this is not enough to explain the differences observed in Hb concentrations. At 7 % Fe absorption, 0·6 mg more Fe consumed per day converts to approximately 1·9 mg (0·04 mg/d for 45 d) more Fe absorbed by the high-Fe formula group over the 45-d intervention compared with the Fe drops group. This is much less than the amount of additional Fe needed to raise Hb concentration by 6·3 g/l in an 8·5-kg infant with a blood volume of approximately 550 ml, which would be approximately 12 mg. Nevertheless, there was no evidence that the incorporation of infused Fe into Hb was greater in the high-Fe formula group than in the Fe drops group. The labelled Fe infusion was given 30 min after the isotopic meal, so that the Fe incorporation of the two isotopes would be expected to be similar. In contrast to our previous results( Reference Domellöf, Lind and Lönnerdal 14 ), we found no evidence that Fe supplements result in higher Fe stores compared with fortification Fe, which is also unlikely to be explained by the lower amount of total Fe absorbed from the interventions. The Fe drops group absorbed only 1·9 mg less Fe over 45 d than the high-Fe formula group, and in adults 8–10 mg of additional storage Fe is needed to increase serum ferritin by 1 µg/l( Reference Zimmermann 70 ).
Fe supplements have been shown to impair Zn absorption in adults when both minerals are provided together as a supplement in aqueous solutions at a high Fe:Zn molar ratio( Reference Sandström, Davidsson and Cederblad 71 ). Moreover, Fe supplements given together with Zn supplements appear to result in reduced plasma Zn concentrations in infants( Reference Pasricha, Hayes and Kalumba 28 ). In contrast, we found no effect of Fe supplements given alone on Zn absorption or status in infants. This confirms our previous findings of no effect of Fe supplements on Zn absorption in infants( Reference Domellöf, Hernell and Abrams 29 ), and is in line with previous research showing that Fe supplements provided to infants alone in the range of 7·5–30 mg Fe/d do not have adverse effects on Zn status( Reference Fischer Walker, Kordas and Stoltzfus 27 , Reference Pasricha, Hayes and Kalumba 28 ). The results of our study support the limited research that shows no evidence that consumption of foods fortified with Fe has a negative effect on Zn absorption( Reference Fairweather-Tait, Wharf and Fox 30 , Reference Esamai, Liechty and Ikemeri 32 ) or Zn status( Reference Esamai, Liechty and Ikemeri 32 , Reference Morgan, Heath and Szymlek-Gay 33 ) in young children. The absorption of Zn from the study formulae was similar to that previously reported in infants( Reference Abrams, Griffin and Davila 36 ). Dietary non-haem Fe is transported into enterocytes by the transmembrane protein divalent metal ion transporter 1( Reference Garrick and Garrick 72 ), whereas Zn uptake and transport across enterocytes is regulated by specialised Zn transporters( Reference Cousins 73 ). However, some Zn transporters (e.g. Zn-regulated transporter/Fe-regulated transporter-like proteins 8 and 14; ZIP8 and ZIP14) have recently been found to be capable of transporting Fe into mammalian cells( Reference Jenkitkasemwong, Wang and Mackenzie 74 , Reference Wang, Jenkitkasemwong and Duarte 75 ). Therefore, it can be speculated that when an excessive amount of Fe is consumed together with Zn in a water solution Fe may inhibit ZIP-mediated Zn transport, resulting in decreased Zn absorption and reduced Zn concentrations. This inhibition would not occur when Fe supplements are ingested alone. In contrast, when Fe is provided in a meal as fortification Fe, it interacts with dietary components that can reduce the number of Fe cations available for absorption compared with supplemental Fe provided in an aqueous solution, and therefore it does not exert the same negative effect on Zn absorption or status. Thus, it may be prudent to suggest that in situations when Fe supplements are required they are provided to infants alone or are provided as fortification Fe along with fortification Zn in infant formula.
Unlike recent reviews showing that Fe supplementation or fortification may result in reduced weight gain and length in Fe-deficient and Fe-sufficient infants( Reference Pasricha, Hayes and Kalumba 28 , Reference Sachdev, Gera and Nestel 76 ), we found no evidence that the type or dose of Fe consumed had a negative effect on physical growth in healthy, Fe-sufficient infants. However, the considerably shorter duration of our study compared with others might have prevented us from observing an effect.
It must be noted that we did not provide placebo drops to the formula groups, which could have potentially biased the results. However, we have shown previously that there is no difference in compliance to placebo or Fe drops in Swedish infants( Reference Berglund, Westrup and Domellöf 77 ). Furthermore, despite the Fe drops group not being blinded, we found no difference among the three groups in the amount of the assigned formula consumed during the trial. Finally, adherence to the allocated intervention was excellent in all groups in the current study.
In summary, Fe can be safely provided to healthy, term, Fe-sufficient infants as either a supplement or a fortificant, within the amounts and duration of intake investigated in our study, as we found no evidence that the mode of oral Fe administration or the amount of Fe habitually consumed altered infant Fe absorption, systemic Fe utilisation, Zn absorption, plasma Zn or physical growth. As observed previously, consumption of fortification Fe compared with supplemental Fe resulted in a greater Hb concentration. However, unlike previously shown, consumption of Fe drops did not result in increased Fe stores compared with fortification Fe. Daily intakes of approximately 500 ml of low-Fe formula (2·3 mg Fe/l) in the absence of other sources of Fe are insufficient to maintain Fe stores in >6-month-old infants. Our results also demonstrate that Fe stores and hepcidin regulate Fe absorption from both Fe supplements and infant formula in Fe-sufficient, predominantly formula-fed infants.
Acknowledgements
The authors thank Åsa Sundström and Camilla Steinvall Lindberg for participant recruitment and data collection, Monika Brändström for translating all protocols from English to Swedish and Jasmin Tajeri Foman for sample analysis.
This study was supported by the New Zealand Foundation for Research, Science and Technology (grant number UMEA0901 to E. A. S.-G.); ETH Zurich, Switzerland; the Umeå University Foundation; and the Västerbotten County Council (ALF). E. A. S.-G. was supported by a New Zealand Science and Technology Postdoctoral Fellowship from the Foundation for Research, Science and Technology (fellowship grant no. UMEA0901). Semper AB, Sweden, generously provided the study formulae and the fruit- and vegetable-based infant foods. The funders had no role in designing or conducting the study, in the collection, management, analysis or interpretation of the data and had no input into the preparation, review or approval of the manuscript.
The authors’ responsibilities were as follows: E. A. S.-G., M. D., O. H., R. F. H., T. L., B. L., C. Z. and I. M. E. designed the study; E. A. S.-G., M. D., O. H. and T. L. conducted the study; C. Z. measured plasma Zn concentrations and the Fe and Zn isotopic composition; E. A. S.-G. performed statistical analyses, wrote the paper and took primary responsibility for the final content; and all the authors provided a critical review of the manuscript and read and approved the final version of the manuscript.
O. H. and B. L. are members of the Scientific Advisory Board of Semper and Hero. M. D., O. H., T. L. and B. L. have received research support from Semper and Hero unrelated to the present study. The remaining authors declare no conflicts of interest related to the study.


