


Compared with healthy term infants, preterm infants are born physiologically immature, nutritionally compromised, growth restricted and at risk of long-term complications( Reference Ehrenkranz, Younes and Lemons 1 – Reference Parkinson, Parkinson and Hyde 3 ). The optimal nutrition for preterm infants is to be fed human breast milk( 4 , Reference Eidelman and Schanler 5 ), and to mirror the growth and development of the age-matched healthy fetus. However, the nutrient and energy contents of native breast milk are insufficient to meet the needs of the preterm infant( Reference Eidelman and Schanler 5 – Reference Arslanoglu, Moro and Ziegler 7 ), and fortification processes are thus used to assist in achieving the latest European recommended intakes( Reference Agostoni, Buonocore and Carnielli 8 ). These recommendations target 460–565 kJ/kg per d (110–135 kcal/kg per d), with 4·0–4·5 g protein/kg per d (3·6–4·1 g protein/418·4 kJ (100 kcal)) for preterm infants weighing <1000 g and 3·5–4·0 g protein/kg per d (3·2–3·6 g protein/418·4 kJ (100 kcal)) for infants weighing between 1000 and 1800 g( Reference Agostoni, Buonocore and Carnielli 8 ).
Common practice is to fortify on an assumed average preterm breast milk composition( Reference Bauer and Gerss 6 , Reference Arslanoglu, Moro and Ziegler 7 , Reference Arslanoglu, Moro and Ziegler 9 ); however, significant variation in the macronutrient content of breast milk exists between and within mothers( Reference Bauer and Gerss 6 , Reference Kociszewska-Najman, Borek-Dzieciol and Szpotansk-Sikorska 10 – Reference Lonnerdal 22 ), reflected by wide variations in macronutrient values derived by studies and adopted by neonatal intensive care units and industry to fortify milk, raising concerns that this practice may lead to undernourishment of some infants and over-nourishment of others( Reference Arslanoglu, Moro and Ziegler 7 ). The lack of a globally accepted reference ‘assumed’ preterm breast milk composition inhibits standardised reporting of nutritional intakes, making it difficult for clinicians and researchers to assess the adequacy of nutritional intakes and the role of nutrition in growth and developmental preterm outcomes.
Macronutrient composition, particularly lipid concentration, is dependent on the method of sampling, stage of lactation, gestational age, maternal diet, presence of maternal infection and parity( Reference Corvaglia, Battistini and Paoletti 13 , Reference Jensen 23 ). In addition, there is significant diurnal and inter-feed variation; as such, study designs that incorporate milk expressions collected at each feed over a 24-h period are preferred to ensure that analysis is being undertaken on a representative milk sample( Reference Khan, Prime and Hepworth 24 ). Accurately measuring the composition of individual breast milk feeds is difficult, costly and time consuming, and studies have collectively differed in the quality of their various methodologies and analytical designs.
Bedside milk analysis with the potential for targeted fortification is under development, with a recent study evaluating the accuracy of using IR analysis for small aliquots of milk, clinically relevant due to the smaller volumes of milk sometimes expressed by preterm mothers( Reference Fusch, Rochow and Choi 25 ). Fusch et al.( Reference Fusch, Rochow and Choi 25 ) highlighted that the near- and mid-IR spectroscopy equipment had variable accuracy when calibrated against micro analyses methods (0·2 g/100 ml for protein, 0·5 g/100 ml for lipid and inaccurate measurements of lactose), which can be significant when feeding at low volumes. These values were similarly found in another study reviewing mid-IR spectroscopy, with lactose again being overestimated( Reference Smilowitz, Gho and Mirmiran 26 ). A recent meta-analysis reported the mean values for each macronutrient in preterm and term milk from healthy mothers during the first 12 weeks of lactation, based on all available data, independent of the analysis used( Reference Gidrewicz and Fenton 27 ). Inclusion criteria stipulated 24-h milk collections for fat and energy only. To account for study differences in the estimation of protein in breast milk (either including or excluding non-protein nitrogen (NPN), the authors conducted two meta-analyses of protein using the available data on each: an estimate of protein based on the assumption that all of the N is protein and a true protein estimate that excludes NPN. Two important findings from this meta-analysis were that milk content is relatively stable between weeks 2 and 12 of lactation and also that the most common difference reported between the quantity of total nitrogen (TN) and true protein estimates was 0·3 g/100 ml( Reference Gidrewicz and Fenton 27 ). Although this difference appears to be small, it is likely to be clinically important, given that it represents about 30 % of the amount of protein currently added by fortifiers to increase the protein content of preterm milk to ensure adequate growth.
The aims of this systematic literature review were to document the published values of preterm human milk composition over representative 24-h samples, assess the validity of the methodology in each of the studies, suggest preferred reference values for fortification based on this assessment and to determine the adequacy of industry-directed routine fortification in meeting nutrition targets.
Methods
Ovid Medline, Scopus, CINAHL and the Cochrane Library were searched using the strategy outlined in Fig. 1, limited to English language and publications from 1959 to 2013. Grey literature was identified through Trove limited to theses, ProQuest Dissertation and Theses and OAIster using the same search string.
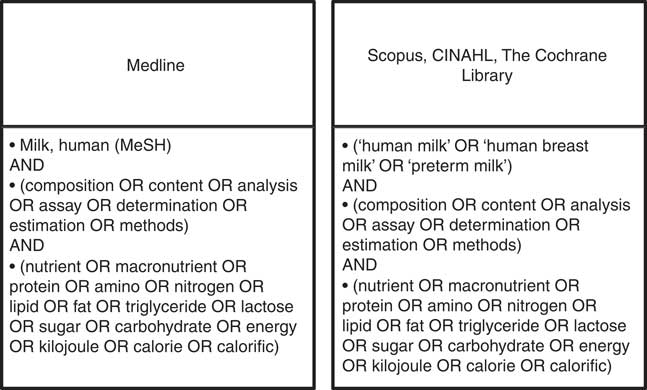
Fig. 1 Search strategies.
The article review and exclusion processes are outlined in Fig. 2. In summary, all retrieved articles (n 7731) were reviewed by title and abstract, excluding articles identified as duplicates, non-English or not relevant to the study aim (Stage 2, Fig. 2). This was achieved by distributing all articles among the first four authors, who independently assessed the articles, conferring only when there was ambiguity about exclusion criteria. The remaining articles were reviewed at Stage 3 (Fig. 2) by at least two authors, and further exclusions were made if full texts could not be sourced, or if studies did not analyse preterm human milk for protein, energy, lactose, carbohydrate or lipid contents in representative 24-h samples. A 24-h sampling procedure was deemed necessary in order to obtain representative samples that accounted for diurnal and inter-feed variation in composition. We included 24-h milk expressions or representative samples comprising fore- and hind-milk samples collected in equal volumes from each expression throughout the day. Articles were also critiqued according to sample size, number of milk samples analysed and maternal demographics.
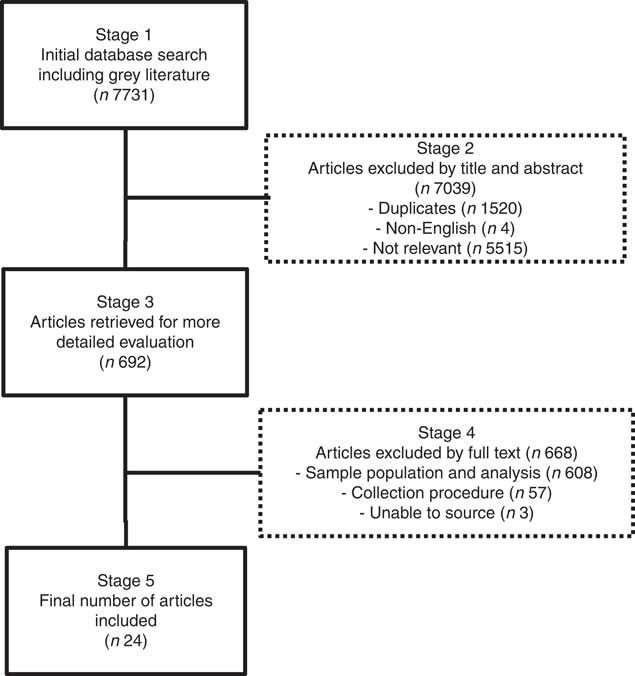
Fig. 2 Article review and exclusion process.
The included articles were examined with the aid of a hierarchical ranking of analytical methods (Fig. 3) based on the EN ISO/IEC 17025:2005 methodology practice, which considers methods according to selectivity, measurement uncertainty, repeatability/reproducibility and robustness within the matrix( 28 ). A method ranking system was not necessary for energy as the primary methods of determination were consistent within the articles assessed. Analyses expressing total carbohydrate and those only expressing the disaccharide lactose were considered separately.
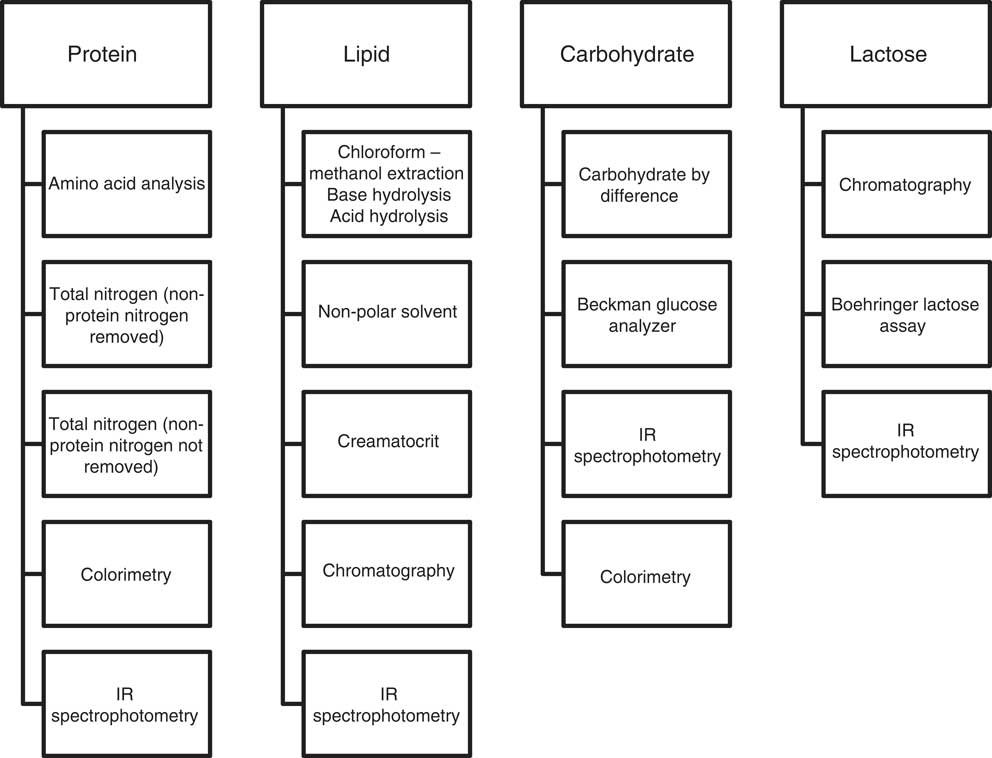
Fig. 3 Method ranking systems specific to protein, lipid, carbohydrate and lactose.
All values were collated and standardised to g/100 ml for each macronutrient and kJ (kcal)/100 ml for energy and were assigned to a lactation week according to the day of lactation (i.e. lactation week 1=inclusive of 1–7 d, lactation week 2=inclusive of 8–14 d, etc.) with values >56 d compiled and reported as ≥week 8. Values that spanned multiple weeks were assigned to a week by the median day of the time period reported. In the case of values reported by type of milk, these were deemed to be of weeks 1, 2 and 4 for colostrum, transitionary and mature milk, respectively.
Protein as determined by the Kjeldahl method results in determination of TN, requiring adjustment for NPN and the subsequent conversion of this derived value to protein equivalents( Reference Bradstreet 29 ). In this review, protein is defined as bioavailable N multiplied by the general conversion factor 6·25( 30 ). Bioavailable N is protein nitrogen (PN=TN–NPN) plus the proportion of NPN that is available for protein synthesis (approximately 27 % of the NPN)( Reference Fomon 31 ).
NPN values specific to different weeks of lactation (17·6 % for weeks 1–4 of lactation( Reference Atkinson, Anderson and Bryan 21 ); 24 % after week 4( Reference Fomon 31 )) were used to standardise protein values across studies and to ensure that all values were representative of bioavailable proteinacious material. To achieve this, all reported values for PN were back calculated to TN. All TN values were then converted into bioavailable N using the applicable assumed NPN percentage (as above). In addition, where studies reported PN derived from the chemical determination of NPN, adjustment was made for bioavailable N where necessary. As there was little difference between the calculated and the chemically derived NPN component of milk, all studies using a form of the Kjeldahl method were used to suggest preferred mean protein values for weeks 1–8 of lactation.
Results
In all, 7731 articles were reviewed by title and abstract, and 7039 articles were excluded as they were duplicates, non-English or not relevant to the study aim (Stage 2, Fig. 2). Of the 692 articles reviewed at Stage 3 (Fig. 2), a further 668 articles were excluded because the investigators did not analyse preterm human milk for protein, energy, lactose, carbohydrate or lipid contents in representative 24-h samples or because full texts could not be sourced. The demographics of the included studies are reported in Table 1.
Table 1 Studies included in the systematic review
E, energy; *, calculated; Pro, protein.
Results from the twenty-four studies included in this review are collated in Table 2 and depict mean and standardised reference ranges, organised by lactation week and macronutrients.
Table 2 Standardised protein, lipid, lactose/carbohydrate and energy values organised by lactation week (Standardised mean values and ranges)
NPN, non-protein nitrogen.
* Articles from which one or more tabulated values were extracted from graphs.
† Articles in which protein values were calculated from reported N values, using the conversion factor 6·25.
‡ Ranges inclusive of values obtained up to 16 weeks of lactation.
To determine a more accurate macronutrient composition, the means/medians (minimum, maximum) of the mean values reported in lactation week 1 and weeks 2–8 by studies using the more robust methodology as per Fig. 3 are shown in Table 3. Protein values used contain bioavailable protein based on assumed NPN percentage. Energy values have been calculated from the mean values using the Atwater general factors( 49 ).
Table 3 Macronutrient composition of lactation week 1 and lactation weeks 2–8 using systematically selected data (Means/medians of values reported for Lactation week 1; means/medians (minimum and maximum) of values reported for each of Weeks 2–8)
The mean and minimum, maximum values reported for lactation weeks 2–8 (Table 3) have been used to calculate incremental volume intakes (ml/kg per d) of breast milk that has been routinely fortified with human milk fortifier (Nutriprem, Cow and Gate; Nutricia). The fortifier provides an additional 1·1 g of protein, 2·8 g of carbohydrate and 67 kJ (16 kcal) of energy when added to 100 ml of expressed breast milk (EBM) (Fig. 4 (a–e)). Table 4 illustrates the change to protein:energy ratio (PER) and quantifies protein intakes at incremental volumes when 0·5 and 1·0 g of protein powder (Beneprotein; Novartis) are added to 100 ml of breast milk that has been routinely fortified.
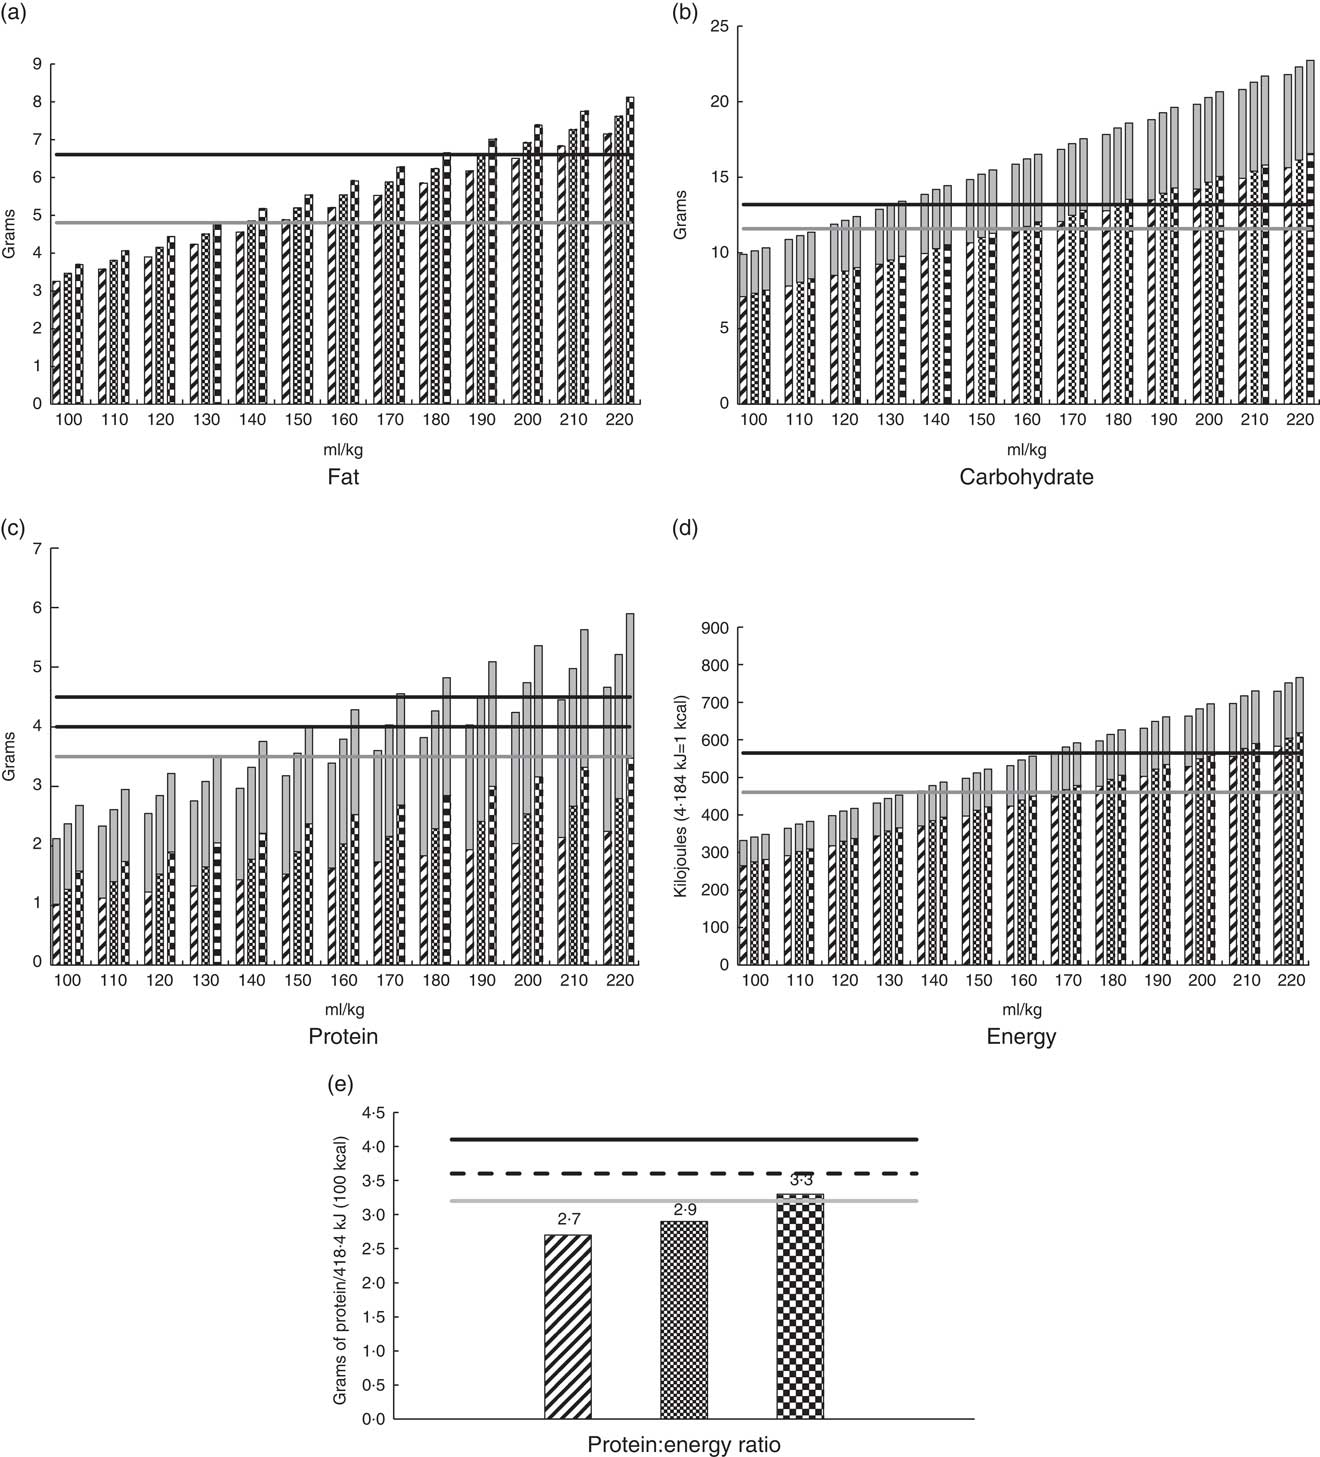
Fig. 4 Estimated intakes at incremental volumes and protein:energy feed ratios derived from routinely fortified milk (4·4 g Nutriprem/100 ml breast milk), using the minimum, mean and maximum values for milk components at lactation weeks 2–8 as described in Table 3. (a) Fat; (b) carbohydrate; (c) protein; (d) energy and (e) protein:energy ratio. The fortifier does not contain fat. ![]() , minimum value for component in breast milk;
, minimum value for component in breast milk;
![]() , mean value for component in breast milk;
, mean value for component in breast milk; ![]() , maximum value for component in breast milk;
, maximum value for component in breast milk; ![]() , fortifier;
, fortifier;
![]() , minimum recommended daily intake;
, minimum recommended daily intake; ![]() , minimum recommended daily intake (<1000 g), maximum recommended daily intake (1000–1800 g);
, minimum recommended daily intake (<1000 g), maximum recommended daily intake (1000–1800 g); ![]() , maximum recommended daily intake.
, maximum recommended daily intake.
Table 4 Simulated protein and energy intakes and protein:energy ratio (PER) of breast milk* fortified with breast milk fortifier† and additional protein powder‡
*Breast milk preferred composition/100 ml from Table 3: protein 1·27 g; fat 3·46; carbohydrate 7·34; energy 276 kJ (66 kcal).
†Fortifier (Nutriprem; Nutricia 4·4 g/100 ml breast milk: protein 1·1 g; carbohydrate 2·8 g; energy 67 kJ (16 kcal)).
‡Protein powder (Beneprotein, Novartis, 0.86 g protein/1 g powder).
Discussion
Biological outcomes
Individualising milk fortification on the basis of measured milk analysis to meet recommended intakes and growth targets is not always possible or pragmatic in the clinical setting. It requires consideration of the infant’s clinical presentation, weight and prescribed feeding volume, is reliant on precise, accurate and expensive measuring equipment, and is labour intensive and time consuming. Instead, and commonly, fortifier is added to milk in routine amounts as directed by industry. The calculation and reporting of nutritional intakes is thus based on the formulation of the fortifier and an assumed milk composition. There are wide variations in milk composition between and within mothers and across the course of lactation, and there are many variants in the assumed milk composition used across neonatal centres to estimate intakes. Therefore, it is difficult to interpret studies that seek to investigate the role nutrition plays in clinical and growth outcomes in the neonatal setting, which ultimately leads to a paucity of good-quality, standardised data that can inform both nutritional practice and development of evidence-based nutritional guidelines.
In this review, we have reported the mean values and ranges of the macronutrient content of preterm breast milk per lactation week, using data from studies that used 24-h milk sampling (Table 2). This strategy was adopted to avoid making broad assumptions or oversimplifying data that are influenced by differences in study design and by the diurnal, within-feed and inter- and intra-maternal variations in milk composition. Selecting data from studies that have utilised the most robust methodology, we have suggested preferred reference mean values for the macronutrient composition of preterm colostrum and preterm mature breast milk (protein: 1·27; fat 3·46; carbohydrate 7·34; energy 66) for use in the clinical setting (Table 3). Global acceptance of these reference values may help standardise calculation and reporting of nutritional intakes and the development of evidence-based guidelines and sound nutritional practice. This will better direct clinicians, researchers and industry in the development of appropriate formulations of breast milk fortifiers (BMF) that address the wide variation in breast milk composition and guide the level of fortification required to better achieve preterm nutrition and growth targets.
Growth data of 13 years (2000–2013) collected from 362 833 low birth weight infants (501–1500 g) in the Vermont Oxford Network( Reference Horbar, Ehrenkranz and Badger 50 ) have recently been published. These growth data were collected over the period when earlier and more aggressive nutrition regimens were being adopted and during a time when the highest-ever protein intakes were recommended for infants weighing <1000 g( Reference Agostoni, Buonocore and Carnielli 8 , Reference Tsang, Uauy and Koletzko 51 ). It is concerning that as late as 2013, 50 % of low birth weight infants in this network were growth restricted at discharge (<10th percentile), and 28 % had severe growth failure (<3rd percentile)( Reference Horbar, Ehrenkranz and Badger 50 ). This is despite the reformulation of several human milk fortifiers since the latest enteral guidelines were released in 2010( Reference Agostoni, Buonocore and Carnielli 8 ), suggesting that current nutrition regimens, including fortification practices, may still not be sufficiently optimised to meet the needs of extremely preterm infants.
Commercial BMF currently provide between 1·0 and 1·1 g protein/100 ml EBM. Polberger et al.( Reference Polberger, Raiha and Juvonen 52 ) used a BMF containing 1 g protein/100 ml EBM to routinely fortify milk and calculated protein intakes of 3·05 g/kg per d in the control arm of the trial, using milk composition data measured with IR technology. Similarly, McLeod et al.( Reference McLeod, Sherriff and Hartmann 53 ) used a BMF containing 1 g protein/100 ml EBM and additional protein powder up to 0·5 g/100 ml EBM to fortify the milk of preterm infants in the control arm of a randomised trial. Mean volume and protein intakes of 153 ml/kg per d and 3·9 g/kg per d, respectively, were calculated for these infants during the fortification period, using milk composition data obtained with mid-IR technology. Miller et al.( Reference Miller, Makrides and Gibson 54 ) has also shown improved protein intakes of 4·2 g/kg per d in the first 4 weeks of a study of preterm infants born <31 weeks of gestation who were fed a trial-based BMF containing 1·4 g of protein/100 ml of breast milk (160, 139–170 ml/kg per d) compared with controls who were fed an isoenergetic BMF containing 1 g protein to achieve intakes of 3·6 g/kg per d (164, 149–171 ml/kg per d).
The American Academy of Pediatrics has stipulated that breast milk should be the primary diet of all preterm infants and that it should be appropriately fortified for those with birth weights <1500 g to target intra-uterine growth rates( Reference Eidelman and Schanler 5 ). Using our preferred minimum and mean values for preterm milk (Table 3) and by using fortification levels as directed by industry, we have demonstrated (Fig. 4(c)) that the recommended protein targets of 4·0–4·5 g/kg per d considered necessary for the growth of preterm infants weighing <1000 g( Reference Agostoni, Buonocore and Carnielli 8 ) may not be achieved below volumes of 190–210 and 170–190 ml/kg per d, respectively. This is concerning, given that lower volumes may be prescribed for extremely preterm infants to minimise risk of long-term morbidity such as chronic lung disease and patent ductus arteriosus( Reference Agostoni, Buonocore and Carnielli 8 ). It is also concerning that the PER of fortified milk, calculated using these preferred values, does not appear to meet recommendations for these infants (Fig. 4(e)). From our estimations, it seems likely that this is due to the insufficient protein and high carbohydrate content of fortifiers, the latter adding a substantial energy load to the final composition of fortified milk, resulting in excessive energy intakes at reasonably low volumes (Fig. 4(d)) and carbohydrate intakes exceeding recommendations beyond volumes of 140 ml/kg per d (Fig. 4(b)).
Table 4 depicts simulated fortified intakes achieved at incremental fluid intakes, based on our preferred mean values, and a commercially available BMF (1·1 g protein/100 ml EBM) and 0·5 or 1·0 g of protein supplement (0·86 g protein/g protein powder). Notably, protein, energy and PER targets for infants weighing <1000 g are achieved when 0·5 g of protein powder is added to feeds in addition to BMF and fed at volumes between 140 and 160, and similarly these targets are achieved at lower volumes (130–140 ml/kg per d) when 1·0 g of protein powder is added in addition to routine amounts of BMF. This level of fortification is currently being practised in some neonatal units around the globe, with the understanding that additional, intact protein powder does not adversely affect osmolality of the feeds( Reference Sherriff and McLeod 55 ), and with acceptance that protein intakes may be greater than needed for some preterm infants if the native content of the milk is actually higher than anticipated( Reference Ziegler 56 ). The efficacy and safety of these fortification practices have not been well studied, and further research is needed to determine the best formulation and the amount of fortifier that can be safely added to preterm milk to optimise preterm growth, developmental and metabolic outcomes. It seems increasingly clear that one size may not fit all; different strength fortifiers may be required to meet the needs of very low weight or poorly growing infants and to address the variations in milk composition between mothers and across the course of lactation.
Justification for the preferred reference values of preterm milk
Protein
Amino acid analysis is the most accurate method for determining true protein content( Reference Lonnerdal 22 ); however, this method is time consuming and costly.( Reference Lonnerdal 22 ) The Kjeldahl method is the most accurate indirect determination of protein content( Reference Donovan and Lonnerdal 57 , Reference Bergqvist, Karisson and Fohlin 58 ), and it – or its more sensitive derivations( Reference Lonnerdal, Woodhouse and Glazier 59 ) (micro and semi-micro Kjeldahl) – is the most commonly used method employed by studies in this review( Reference Corvaglia, Battistini and Paoletti 13 , Reference Lemons, Moye and Hall 16 – Reference Anderson, Atkinson and Bryan 18 , Reference Gross, Geller and Tomarelli 20 , Reference Atkinson, Anderson and Bryan 21 , Reference Atkinson, Bryan and Anderson 32 – Reference Beijers, Graaf and Schaafsma 34 , Reference Lepage, Collet and Bougle 42 – Reference Saarela, Kokkonen and Koivisto 45 , Reference Silber, Hachey and Schanler 47 , Reference Stevens 48 ). The Kjeldahl method involves liberation of TN from a sample( Reference Keller and Neville 60 ). A second analysis improves the accuracy by determining NPN and subtracting this from TN to determine PN( Reference Keller and Neville 60 ). During protein precipitation, peptides remain in the supernatant and are attributed to NPN, resulting in a minor underestimation of true protein as they are excluded from the derived PN( Reference Keller and Neville 60 ); four studies( Reference Lemons, Moye and Hall 16 , Reference Anderson, Williams and Merkatz 17 , Reference Atkinson, Anderson and Bryan 21 , Reference Beijers, Graaf and Schaafsma 34 ) reported chemically determined NPN values, which were used to determine bioavailable protein and were compared with the bioavailable protein using an assumed NPN percentage. Differences in bioavailable protein calculated using chemically derived NPN compared with using assumed values during week 1 to week 4 of lactation ranged from −0·06 to 0·21 g. Although it is technically superior to chemically derived NPN, the small differences between bioavailable proteins using the above methods are reassuring, and thus all derivations of Kjeldahl with NPN correction applied were considered to be superior.
The modified Lowry–Petersen and Biuret assays use colorimetry to quantify protein concentration( Reference Keller and Neville 60 ). The Biuret assay, used by Sann et al.( Reference Sann, Bienvenu and Lahet 46 ), is limited in that it requires a large number of samples( Reference Okutucu, Dınçer and Habib 61 ), has low sensitivity with detection starting at 1 g/l and can be confounded by other components in milk( Reference Keller and Neville 60 ). Bauer & Gerss( Reference Bauer and Gerss 6 ) used the Lowry–Petersen method to determine protein content in the milk of a large sample of mothers; this study reported the highest protein values for each lactation week. Reliability of the Lowry–Petersen assay is dependent on technique, which demands high accuracy in achieving a 100-fold dilution and precise timing when adding the reagent( Reference Keller and Neville 60 ).
Jitta et al.( Reference Jitta, Musoke and Bwibo 40 ) used a variation of the Esbach’s method, which was designed to measure protein in urine( Reference Lewis and Richards 62 ). This, together with the socio-cultural demographics of the Kenyan women in this study( Reference Jitta, Musoke and Bwibo 40 ), may account for the low protein values reported for weeks 3 and 4 compared with those determined by other methods.
In addition, two studies used IR spectrophotometry methods to determine TN and true protein concentrations, respectively( Reference Corvaglia, Battistini and Paoletti 13 , Reference Faerk, Skafte and Petersen 38 ). This indirect determination can vary in accuracy depending on the calibration of the individual machines( Reference Casadio, Williams and Lai 12 ), the choice of the reference method used and the diversity and number of samples used in the calibration set( Reference Agelet and Hurburgh 63 ). That aside, it is noteworthy that the protein values reported in these studies were consistent with values found by more direct methods.
Lipid
During the first 5 weeks of lactation, lipid concentration appears to increase, with convergence of the range of reported values. Obtaining representative lipid samples requires 24-h collections to allow for variation as well as careful mixing of the sample at 38°C before removing an aliquot for analysis( Reference Jensen 23 ). The preparation and storage of a sample is important to maintain its integrity; a limit of 14 d at −20°C is recommended to prevent lipolysis( Reference Jensen and Clark 64 ). Only one study specified the duration of storage at such temperatures( Reference Saarela, Kokkonen and Koivisto 45 ). This susceptibility to lipolysis can be overcome by storing samples at −70°C or below( Reference Jensen and Clark 64 ), a strategy used in three of the included studies( Reference Bauer and Gerss 6 , Reference Lemons, Moye and Hall 16 , Reference Ehrenkranz, Ackerman and Nelli 37 ). Of note, this should be used by studies determining lipid concentration without using extraction techniques. Preferred methods for determining total lipid concentration include modified Folch and Roese–Gottlieb methods, which both use chloroform–methanol extraction followed by gravimetric determination( Reference Jensen and Clark 64 , Reference Horwitz 65 ). Insull & Ahrens( Reference Insull and Ahrens 66 ) compared modified Folch with Roese–Gottlieb methods, and found that the total lipids that were recovered were similar between the two methods but the Folch method recovered phospholipids more effectively( Reference Jensen 23 ); four articles (Maas et al.( Reference Maas, Gerritsen and Hart 44 ), Beijers et al.( Reference Beijers and Schaafsma 35 ), Saarela et al.( Reference Saarela, Kokkonen and Koivisto 45 ) and Gross et al.( Reference Gross, Geller and Tomarelli 20 )) used the Roese–Gottlieb method, and the narrow range for total lipid reported over the first 8 weeks of lactation in these studies emphasises the robust nature of their methodology. The Folch technique was used by Ehrenkranz et al.( Reference Ehrenkranz, Ackerman and Nelli 37 ) and Sann et al.( Reference Sann, Bienvenu and Lahet 46 ); however, the reported results using this method were only comparable for matched lactation weeks 1 and 2, in which differences in fat concentration of up to 1·35 g/100 ml were noted.
Chloroform–methanol extraction followed by colorimetric determination was used by Anderson et al.( Reference Anderson, Atkinson and Bryan 18 ) and Atkinson et al.( Reference Atkinson, Bryan and Anderson 33 ). Lemons et al.( Reference Lemons, Moye and Hall 16 ) used colorimetric determination but used sulphuric acid for extraction( Reference Frings and Dunn 67 ). The colorimetric determination of lipid yielded higher values for week 1 of lactation, compared with those determined by the Roese–Gottlieb and Folch methods, but were similar for the remaining weeks. A modified De la Huerga method of extraction followed by photometric determination was used by Guerrini et al.( Reference Guerrini, Bosi and Chierici 39 ). This method was not as specific as previously mentioned methods, as there was no precipitation of protein before photometrically reading the sample’s turbidity. The method used by Silber et al.( Reference Silber, Hachey and Schanler 47 ) was crude fat determination as lipid extraction was performed using non-polar solvents, and therefore did not account for phospholipids. Anderson et al.(17) calculated total lipid concentration on the basis of average fatty acid chain length, a method less robust than direct measurements.
The creamatocrit technique is a simple, rapid and inexpensive measure of fat in milk( Reference Jensen and Clark 64 , Reference Lucas, Gibbs and Lyster 68 ). The method is limited by the subjectivity associated with reading the measurement, and the potential for overestimating the lipid content due to significant unpacking of the lipid column if the sample is read after 30 min( Reference Bauer and Gerss 6 , Reference Lucas, Gibbs and Lyster 68 ). However, the creamatocrit method has an accuracy of ±10 %, which is considered by some to be adequate in most clinical and research settings( Reference Lucas, Gibbs and Lyster 68 ). Jitta et al.( Reference Jitta, Musoke and Bwibo 40 ) and Bauer & Gerss( Reference Bauer and Gerss 6 ) both used the creamatocrit technique, and their results were comparable with the Roese–Gottlieb method for weeks 1–3 but appeared to be an overestimation for week 4. The Gerber method used by Corvaglia et al.( Reference Corvaglia, Battistini and Paoletti 13 ) uses an adequate extraction technique; however, the volumetric determination is inferior to the gravimetric methods and requires a large sample size( Reference Lucas, Gibbs and Lyster 68 ).
IR spectrophotometers have the ability to ascertain values for all macronutrients in one measurement; however, this is an indirect measurement and the machine must be calibrated against direct analysis( Reference Agelet and Hurburgh 63 ). The strength of the calibration depends on the reference chemistry used and the number and range of samples( Reference Agelet and Hurburgh 63 ). Homogenisation is an important step in preparing milk samples as it decreases the variability in fat globule size and subsequent light-scattering effect of larger globules, improving the accuracy of measurement( Reference Fusch, Rochow and Choi 25 ). Reducing the diameter of the fat globule to <3 µm can be achieved through either manual or ultrasonographic methods; however, utilising an ultrasound processor is associated with high measured values for N, energy and particularly fat and lactose( Reference García-Lara, Escuder-Vieco and García-Algar 69 ). Neither of the studies has reported whether the samples underwent homogenisation before analysis. Corvaglia et al.( Reference Corvaglia, Battistini and Paoletti 13 ) used near-IR, with a detailed description of calibration. This study found a correlation of 0·808 between IR analysis and the Roese–Gottlieb method( Reference Corvaglia, Battistini and Paoletti 13 ). Faerk et al.( Reference Faerk, Skafte and Petersen 38 ) used mid-IR spectrophotometry but did not provide information on the calibration of their machine, which is critical in establishing the reliability of the results( Reference Agelet and Hurburgh 63 ). This study consistently reported higher lipid concentrations than those reported by others using different methods.
Carbohydrate/lactose
Lactose is the predominant disaccharide carbohydrate in human milk (approximately 70–83 % of total carbohydrates); however, human milk also contains free glucose and galactose, as well as numerous oligosaccharides( Reference Coppa, Gabrielli and Pierani 70 ). Of the studies reported in Table 1, nine reported lactose concentrations( Reference Lemons, Moye and Hall 16 , Reference Anderson, Atkinson and Bryan 18 , Reference Gross, Geller and Tomarelli 20 , Reference Atkinson, Bryan and Anderson 33 , Reference Jitta, Musoke and Bwibo 40 , Reference Maas, Gerritsen and Hart 44 – Reference Silber, Hachey and Schanler 47 ) and five reported total carbohydrate( Reference Bauer and Gerss 6 , Reference Anderson, Williams and Merkatz 17 , Reference Chessex, Reichman and Verellen 36 , Reference Faerk, Skafte and Petersen 38 , Reference Maas, Gerritsen and Hart 44 ). As expected, the total carbohydrate composition range was consistently higher than lactose. Further, both lactose and total carbohydrate followed the same trend, which was to increase gradually over weeks 1–4 and remain relatively stable from then on. Although it may be preferable from a clinical perspective to identify a total carbohydrate value, the majority of studies with high methodological quality measured lactose; two reliable methodologies identified for lactose determination were used by five studies( Reference Lemons, Moye and Hall 16 , Reference Anderson, Atkinson and Bryan 18 , Reference Atkinson, Bryan and Anderson 33 , Reference Maas, Gerritsen and Hart 44 , Reference Sann, Bienvenu and Lahet 46 ). These methods were chromatography, with Lemons et al.( Reference Lemons, Moye and Hall 16 ) using GLC and Sann et al.( Reference Sann, Bienvenu and Lahet 46 ) using ion-exchange chromatography, as well as the Boehringer lactose assay used by Anderson et al.( Reference Anderson, Atkinson and Bryan 18 ), Maas et al.( Reference Maas, Gerritsen and Hart 44 ) and Atkinson et al.( Reference Atkinson, Bryan and Anderson 33 ). Although these methods differ, they are each primary methods of analysis, specific for lactose and are not confounded by carbohydrate interference. The chromatographic methods achieve this by virtue of their calibrated parameters being lactose specific, and the Boehringer lactose assay accounts for free glucose. There were four studies included in this review reporting lactose values in which the methodology was unable to be sufficiently identified( Reference Gross, Geller and Tomarelli 20 , Reference Jitta, Musoke and Bwibo 40 , Reference Saarela, Kokkonen and Koivisto 45 , Reference Silber, Hachey and Schanler 47 ). It is also noteworthy that Saarela et al. ( Reference Saarela, Kokkonen and Koivisto 45 ) used an unidentified enzymatic degradation method, which greatly increased the range reported in weeks 1 and 4 where values from their study were included. It is possible that this methodology may not have accounted for free glucose, and thus overestimated lactose; however, this is unlikely to be significant. Of the studies reporting total carbohydrate, the main limitation was the infrequency with which measurements were taken or reported over the weeks of lactation. Chessex et al.( Reference Chessex, Reichman and Verellen 36 ) and Bauer & Gerss( Reference Bauer and Gerss 6 ) only contributed to the ranges reported in weeks 3 and 4, respectively. Although Faerk et al.( Reference Faerk, Skafte and Petersen 38 ) reported values for multiple weeks, it should be noted that the validity of the IR spectrophotometry values is not clearly elucidated because the calibration method was not explicitly stated. Despite the potential for confounding errors in a multistep process, Maas et al.( Reference Maas, Gerritsen and Hart 44 ) used sound methodology, calculating total carbohydrate by difference, and provided the greatest contribution to the carbohydrate trend, reporting values over weeks 2–8.
Energy
Bomb calorimetry accurately measures total energy content and was used in a number of studies( Reference Bauer and Gerss 6 , Reference Lemons, Moye and Hall 16 , Reference Anderson, Williams and Merkatz 17 , Reference Lepage, Collet and Bougle 42 , Reference Silber, Hachey and Schanler 47 ); however, it does not differentiate between gross and metabolisable energy, which is dependent on the bioavailability of each macronutrient in the food source. This difference can result in an overestimation of energy based on inaccuracies in each macronutrient (protein 5·7 kJ/g (1·36 kcal/g), lipids 1·92 kJ/g (0·46 kcal/g) and carbohydrate 0·33 kJ/g (0·08 kcal/g))( Reference Anderson, Atkinson and Bryan 18 , 30 , Reference Neville 71 ), which is important when considering the energy value, the PER of milk feeds and the energy intake of preterm infants. It is common to quantify energy content through the use of factors representing the energy contribution of each macronutrient. Anderson et al.( Reference Anderson, Atkinson and Bryan 18 ), Atkinson et al.( Reference Atkinson, Bryan and Anderson 33 ), Faerk et al.( Reference Faerk, Skafte and Petersen 38 ), Jitta et al.( Reference Jitta, Musoke and Bwibo 40 ), Maas et al.( Reference Maas, Gerritsen and Hart 44 ) and Chessex et al.( Reference Chessex, Reichman and Verellen 36 ) have used the factors of 23·64, 38·70 and 16·52 kJ/g (5·65, 9·25 and 3·95 kcal/g) for protein, fat and lactose, respectively, which are based on heats of combustion and comparable with bomb calorimetry values( Reference Anderson, Atkinson and Bryan 18 , Reference Neville 71 ). Saarela et al.( Reference Saarela, Kokkonen and Koivisto 45 ) used the Atwater general factor system, which represents the metabolisable energy of protein, fat and carbohydrate with the factors 17, 38 and 17 kJ/g (4, 9 and 4 kcal/g), respectively( 30 , Reference Southgate and Barrett 72 ). These factors were further developed to be food specific, forming the Atwater specific factor system( 30 ). This system was used by Gross et al.( Reference Gross, Geller and Tomarelli 20 ), with the factors for metabolisable energy in milk being 17·86, 36·78 and 16·19 kJ/g (4·27, 8·79 and 3·87 kcal/g) for protein, fat and carbohydrate, respectively( 30 ). Many authors have used lactose concentration in place of carbohydrate when calculating energy content( Reference Anderson, Atkinson and Bryan 18 , Reference Gross, Geller and Tomarelli 20 , Reference Atkinson, Bryan and Anderson 33 , Reference Jitta, Musoke and Bwibo 40 , Reference Saarela, Kokkonen and Koivisto 45 ), because of lactose being the primary carbohydrate in milk, and a better reflection of the carbohydrate component that is digestible, with the remaining component being largely indigestible oligosaccharides. Although the Atwater factor systems are clinically relevant methods of energy determination, there is also the larger measurement error to consider when using factors, as the percentage errors involved in the measurement of individual components of the milk combine to give a much larger error for the derived energy content. As expected, reported energy values based on digestible or metabolisable energy factors were consistently lower than those based on total energy intake values.
Limitations of this review
Although the authors made every effort to procure papers, a small number of articles that could not be excluded by title or abstract could not be obtained for use in this review. Chemical analyses used in some studies were incompletely described or cited inaccessible reference material; these studies were mentioned within the discussion; however, the validity of the results could not be appreciated. The graphical representation of data without numerical support was a barrier to accurate interpretation. Rather than exclude these studies, the four reviewers independently extracted values manually and reached a consensus value for each relevant weekly average. However, there were many fundamental differences between studies, including number of mothers included, various maternal factors (including age, parity, nutritional and socio-economic status), gestational ages of the infants and methodologies used, which could not be controlled for and may have contributed to the large range of values identified in the literature.
Conclusion
This review has provided a compilation of the published values of preterm human milk composition, and has suggested preferred reference values for the assumed macronutrient composition of preterm milk for week 1 (colostrum) and weeks 2–8 of lactation (mature milk). We have calculated estimated macronutrient and energy intakes of infants at prescribed fluid volumes using the minimum, mean and maximum reference values for mature milk and routine fortification practices, as well as demonstrated that recommended protein targets are likely unachievable below volume intakes of 170–190 ml/kg per d when the milk has low and average protein content. We have also demonstrated that these fortified preterm milk feeds are unlikely to have an adequate PER, potentially compromising adequate growth. Given the variable composition of breast milk and the fact that preterm infants are a heterogeneous population, different strength fortifiers may be required to meet the needs of very low weight or poorly growing infants. Global acceptance of the recommended preferred reference values for preterm milk composition may ensure standardised calculation and reporting of nutritional intakes, better direct clinicians, researchers and industry in the development of appropriate formulations of BMF, and guide the level of fortification required to better achieve preterm nutrition and growth targets.
None of the studies included in this review used the most accurate methods for measuring each macronutrient in preterm human milk. In order to determine the most accurate preterm breast milk composition, analyses must be undertaken of all macronutrients in 24-h collections from a large sample of healthy mothers over the course of lactation, using the best methodologies available.
Acknowledgements
The authors acknowledge the support and resources provided by King Edward Memorial Hospital, The University of Western Australia and the ChemCentre at Curtin University.
This research received no specific grant from any funding agency or from commercial or not-for-profit sectors.
C. B., M. W., G. L. and S. R.: equal contribution to the formulation of the research question and study design, collation and review of data, synthesis of results and compilation of the review; K. D.: provision of expert advice on analytical chemistry and assistance in developing the method ranking system; K. S.: contribution to the formulation of the research question and study design and editorial assistance; G. M.: supervisor of the project. Contribution to the development of the research question and study design and provision of expert advice and editorial assistance.
None of the authors has any conflicts of interest to declare.


