INTRODUCTION
Ethnic disparities in the rates of sexually transmitted infection (STI) diagnoses have been reported in many developed countries and are a major source of health inequality worldwide [Reference Millett1, Reference Woestenberg2]. In the UK, disproportionately high STI and HIV rates are reported in people of black Caribbean and black African ethnicity [3, Reference Fenton4]. In England, among sexual health clinic attendees, the highest diagnosis rates of gonorrhoea, genital herpes, genital warts and syphilis are found in black ethnic groups [Reference Hughes5–Reference Savage7].
Socioeconomic deprivation (SED) is one of the major determinants of poor health [Reference Marmot8], and it is also frequently implicated as a contributor to the disparate health observed in racial and ethnic minorities [Reference Shavers9]. SED refers to the range of socioeconomic circumstances, such as income, education and occupation, by which individuals are hierarchically stratified in society [Reference Marmot8], and can be expressed as poor access to healthcare [Reference Butler10], poor education, social segregation [Reference Kershaw, Albrecht and Carnethon11, Reference White12] and poor housing [Reference Krieger and Higgins13]. A link between decreasing socioeconomic status and increased risk of a multitude of diseases, including infectious diseases such as STIs, has been already established [Reference Newton14, Reference Moonesinghe15].
Especially for people of lower socioeconomic status, engaging in high-risk behaviour could be linked to poor self-esteem, perceived limitations of life choices and limited control over what happens to their health [Reference Hughes and Gorton16]. Behavioural risk factors are themselves linked to the social gradient by levels of risk associated with the social and structural environment [Reference Pound and Campbell17]. A living environment with low social capital places an individual at increased risk of exposure to infections associated with behavioural risk [Reference Gupta18]. In addition, racial disparities in sexual and in general health typically reflect environmental and social differences between racial groups [Reference Millett1, Reference Nazroo19].
A previous analysis investigated the association between SED and ethnicity in terms of STI risk [Reference Savage20]. This analysis highlighted that the STI diagnosis rates in black ethnic communities remained significantly higher than those of other ethnic groups after adjustment for SED. However, the analysis was based on patients' lower-tier Local Authority (LA) of residence, large administrative units of local government, of which there are 326 in England. In this paper, we refine and update these analyses using a much smaller geographical unit, the Lower Super Output Area (LSOA), 32 482 census output areas with an average population of 1620 persons [21], to investigate the association between ethnicity, STI diagnosis rates and SED in England.
METHODS
Data from all 215 sexual health clinics in England were obtained from the Genitourinary Medicine Clinic Activity Dataset version 2 (GUMCADv2), the mandatory surveillance system for all STI diagnoses and services in England [Reference Savage22]. All sexual health clinic attendances from 1 January 2013 to 31 December 2013, inclusive, were considered in the analysis. The diagnosis rates per 100 000 population of gonorrhoea; primary, secondary and early latent syphilis; genital warts (first episode); and genital herpes (first episode) were derived.
SED was measured using the index of multiple deprivation (IMD) a measure of area-level deprivation for each LSOA. The IMD score [23], is constructed for each of 32 482 defined LSOAs in England by combining scores derived largely from routine administrative data for the following seven domains (weighted for importance): income (22·5%), employment (22·5%), health and disability (13·5%), education, skills and training (13·5%), barriers to housing and services (9·3%), crime (9·3%), living environment (9·3%) [Reference Payne and Abel24].
Each LSOA was ranked according to the IMD score, and then assigned to quintiles. Denominators used to derive crude incidence rates of STI diagnoses were obtained from the 2011 Census [25]. Poisson regression was used to calculate unadjusted and IMD-adjusted incidence rate ratios (IRRs) for each STI by ethnic group. As census data only provide limited demographic breakdowns by LSOA, demographic factors other than ethnicity could not be considered in the Poisson regression model.
A sensitivity analysis to examine the relationship between ethnicity, deprivation and other demographic factors was performed using binary logistic regression to derive odds ratios (ORs) for the diagnosis of each STI among sexual health clinic patients, with and without adjustment for IMD, age and gender/sexual orientation. Gender and sexual orientation were combined as a single variable consisting of the following categories: men who have sex with men, heterosexual men and women (<1% of women were lesbian, so this was not considered as a category due to small cell sizes for analysis).
All analyses were performed using Stata v. 13.1 (StataCorp LP, USA) [26], and P values <5% were considered statistically significant.
Ethical standards
Ethics committee approval is not required, as the analyses are based on surveillance data held by Public Health England. These datasets have approval for analyses for public health purposes.
RESULTS
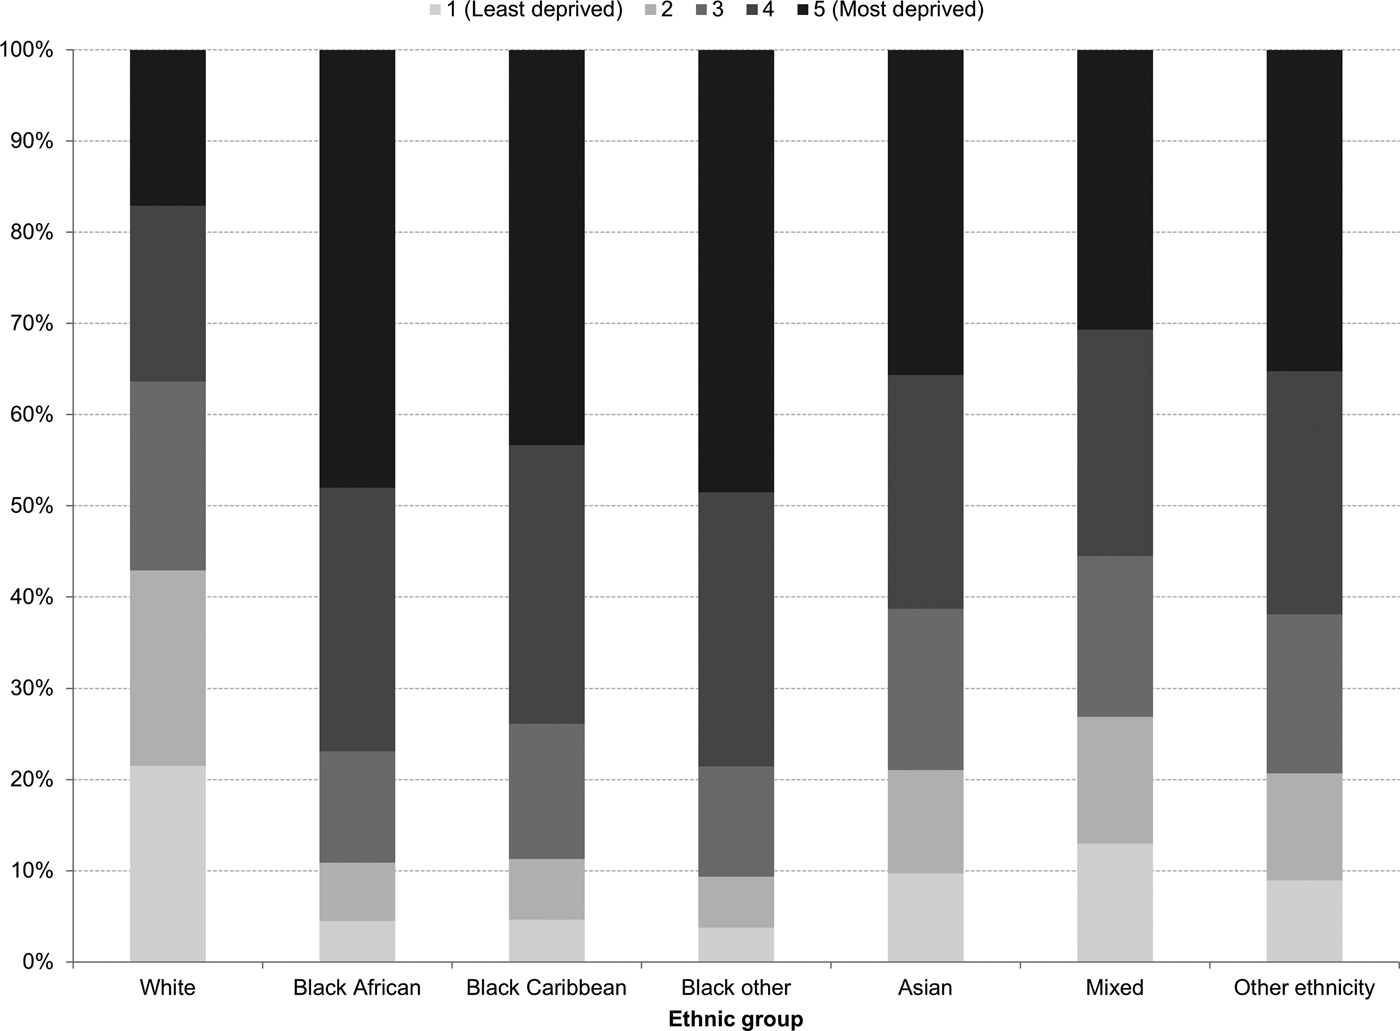
In England, there was little variation in the distribution of white British people by IMD quintile of their LSOA of residence: 22% of white British people lived in the least deprived areas and 17% lived in the most deprived areas (Fig. 1). This contrasted with other ethnic groups. For example, 47% of black British people lived in the most deprived areas, while only 4% lived in the least deprived areas (Fig. 1).

Fig. 1. Ethnic variations in the distribution of the index of multiple deprivation in England, 2011.
In 2013, data from 2 539 572 sexual health clinic attendances were submitted to GUMCADv2 and the proportion of attendances reported with known ethnicity was 99·7%.
Most (65·3%) of the attendances were by patients of white British ethnicity, followed by those of non-British/non-Irish white ethnicity (10·7%) and black African ethnicity (6·4%). The proportions of attendances by people of black Caribbean and non-Caribbean/non-African black ethnicity were 3·9% and 2·0%, respectively.
Black Caribbeans had the highest crude rates per 100 000 population for gonorrhoea (285·7) and genital herpes (190·0), while people of non-British/non-Irish white ethnicity had the highest rates of genital warts (228·4) and syphilis (25·8). The crude rates in those of white British ethnicity were 34·9 for gonorrhoea, 51·4 for genital herpes, 123·6 for genital warts and 3·6 for syphilis (Fig. 2).

Fig. 2. Crude rates for (a) gonorrhea, (b) syphilis, (c) genital herpes and (d) genital warts by ethnic group, England, 2013.
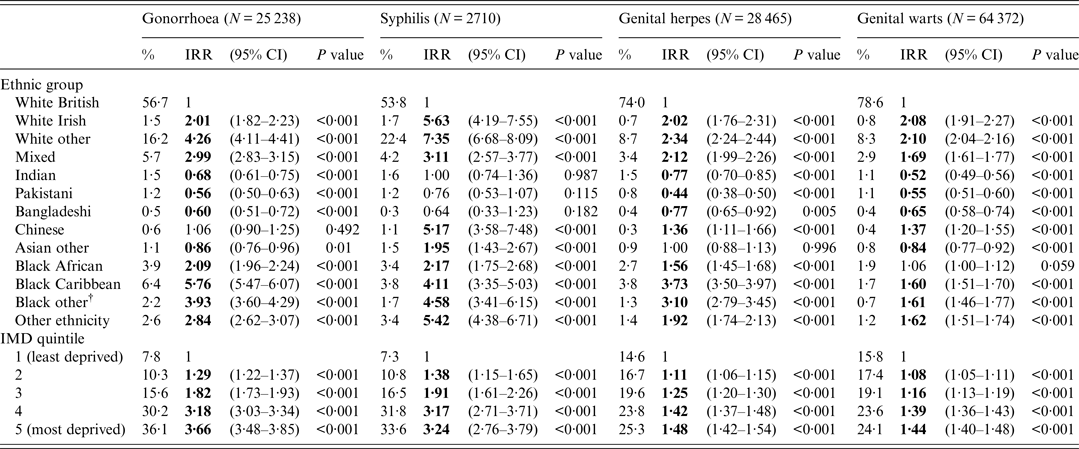
Unadjusted IRRs (95% confidence intervals) from the Poisson regression were highest for gonorrhoea [8·18 (7·77–8·61) and 5·76 (5·28–6·29)] and genital herpes [4·24 (3·99–4·51) and 3·58 (3·23–3·98)] for people of black Caribbean and non-Caribbean/non-African black ethnicity, respectively, compared to those of white British ethnicity (Table 1). Unadjusted IRRs were highest for people of non-British/non-Irish white ethnicity for syphilis [8·76 (7·97–9·63)] and genital warts [2·23 (2·17–2·29)], respectively, compared to those of white British ethnicity (Table 1).
Table 1. Unadjusted incidence rate ratios (IRRs) for gonorrhoea, syphilis*, genital herpes and genital warts by ethnic group, England, 2013

CI, Confidence interval.
* Syphilis is defined as primary, secondary and early latent syphilis.
† Black other: non-Caribbean/non-African black ethnicity.
After adjustment for IMD, IRRs for gonorrhoea [5·76 (5·47–6·07)] and genital herpes [3·73 (3·50–3·97)] declined but remained highest for black Caribbeans compared to those of white British ethnicity (Table 2). IRRs for syphilis [7·35 (6·68–8·09)] and genital warts [2·10 (2·04–2·16)] also declined but remained highest for non-British/non-Irish white ethnicity compared to those of white British ethnicity (Table 2).
Table 2. Incidence rate ratios (IRRs) for gonorrhoea, syphilis*, genital herpes and genital warts by ethnic group adjusted for index of multiple deprivation (IMD), England–2013

CI, Confidence interval.
* Syphilis is defined as primary, secondary and early latent syphilis.
† Black other: non-Caribbean/non-African black ethnicity.
People of Indian and Pakistani ethnicity had consistently lower IRRs (both unadjusted and adjusted) for gonorrhoea, genital warts and genital herpes compared to white British people (Tables 1 and 2).
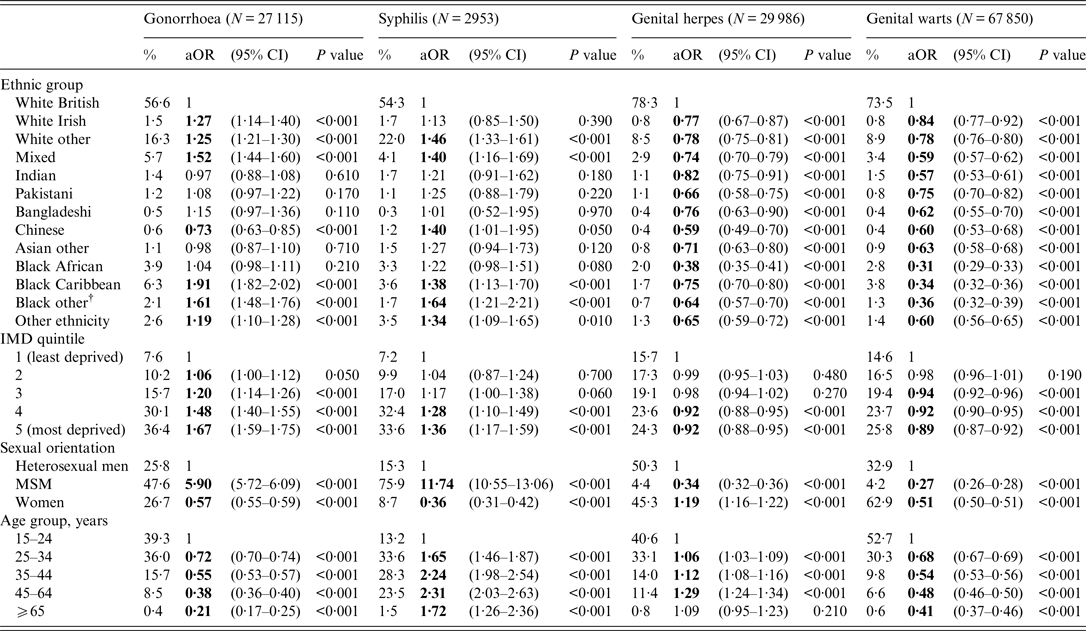
According to the sensitivity analysis (Table 3), the ORs for gonorrhoea [1·91 (1·82–2·02) and 1·61 (1·48–1·76)] were highest for black Caribbean and people of non-Caribbean/non-African black ethnicity, respectively, compared to white British ethnic groups. In contrast, the ORs for syphilis [1·64 (1·21–2·21)] were highest for those of non-Caribbean/non-African black ethnicity. The ORs for genital warts and genital herpes were highest in those of white British ethnicity.
Table 3. Adjusted odds ratios (aORs) for gonorrhoea, syphilis*, genital herpes and genital warts diagnoses by ethnic group, England, 2013

CI, Confidence interval, IMD, index of multiple deprivation; MSM, men who have sex with men.
* Syphilis is defined as primary, secondary and early latent syphilis
† Black other: non-Caribbean/non-African black ethnicity
DISCUSSION
After controlling for deprivation, the strength of association between ethnicity and STI diagnosis was reduced, most notably for gonorrhoea in those of black Caribbean and non-Caribbean/non-African black ethnicity, suggesting that socioeconomic status and poverty might be important correlates of racial disparities in health. However, variation by ethnicity persisted. After additional adjustment for sexual orientation and age, persons of black Caribbean ethnicity remained the ethnic group with the greatest odds of gonorrhoea diagnoses.
Compared to the previous analysis performed which included larger geographical units [Reference Savage20], the refined version presented here allowed us to investigate the association between STI diagnoses, ethnicity and SED, at a very small local level (LSOA). Confounding variables have been included as much as possible given population data availability at the local level. In this respect, one limitation of this study relates to the use of IMD. This is a measure of residential area-level and not individual deprivation, and thus is subject to ecological fallacy. Furthermore, although IMD is composed of many closely related domains, chosen to reflect varying forms of disadvantage, the indicator provides no insight into which specific factors are associated with the pathway between exposure and infection.
Although we were able to adjust for SED, residual confounding suggests that there are unknown – and possibly unmeasurable – predictors for some infections. As such, we performed a sensitivity analysis to adjust for multiple demographic factors in addition to IMD, and similar results for the bacterial STIs with respect to IMD, ethnicity and STI diagnoses were observed. Other confounders such as risky sexual behaviour and drug use could not be included in this study as these characteristics are not currently collected by GUMCADv2. However, the enhancement of GUMCADv2 [27] to include behavioural information is currently being piloted from a subset of STI services, and future studies may be able to address this study's limitation.
While chlamydia is the most common STI to be diagnosed in England [28], it was not considered in this analysis because 48% of diagnoses are made in different settings such as sexual and reproductive health clinics, general practice, Young people's services. In addition, data are captured from another surveillance system [29], which has poor data quality on ethnicity which could potentially bias the results. In contrast, one of this study's most important strengths is that we used national surveillance data which benefits from 100% reporting compliance and high data completion (each variable collected has at least 90% completion), resulting in a dataset with over 2 million observations from all STI services throughout the country and over 450 000 diagnoses of STIs reported in 2013. This enabled derivation of robust population-based estimates of the diagnosis rates of common STIs both at a national and local level [Reference Savage22].
Evidence suggests that most STIs diagnosed in England are detected at a sexual health clinic or are referred to a sexual health clinic from general practice [Reference Hughes and Field30, Reference Wetten31].
The clear disparity in sexual ill-health by ethnic group, with those from black ethnic minorities having higher rates of specific STI diagnoses found in this study, is consistent with previous studies based in the UK, as well in United States [Reference Millett1, Reference Hughes5, Reference Nazroo19]. In line with other studies, the results of this analysis confirm SED as a key determinant of poor health outcomes [Reference Zhang32, Reference Mazur33].
SED only partly explains ethnic differences in STI diagnosis rates. It is likely that the high rates of STI diagnoses seen in black ethnic minorities relate to a complex interaction of structural determinants such as cultural, social and economic conditions and individual-level factors.
Structural determinants influence the health of communities as a whole and include education, employment, access to services and job security [Reference Dean and Fenton34].
The individual-level factors include high-risk behaviours such as unsafe sexual practices [Reference Gerver35], drug-injecting practices [Reference Dean and Fenton34], and health-seeking behaviour, especially the use of treatment and screening services [Reference Gerressu36]. There is limited evidence in health-seeking behaviour by ethnicity; however, data from the second British National Survey of Sexual Attitudes and Lifestyles (Natsal 2000) show that the proportion of people of black Caribbean ethnicity reporting sexual health clinic attendance and STI diagnosis is higher compared to those of white ethnicity [Reference Fenton4]. A higher prevalence of infections in black ethnic minorities may make them more likely to attend a sexual health clinic. However, other factors could influence the health-seeking behaviour.
It is well documented that an individual's sexual risk behaviour occurs within the context of a sexual partnership or partnerships within a wider sexual network and background prevalence of untreated disease [Reference Beyrer37]. These more proximal determinants of risk also occur within the context of broader social and structural determinants such as racial discrimination perception [Reference Hogben and Leichliter38, Reference Bowleg39]. In particular, perceived racial segregation acts directly upon the patterns of the sexual networks. The correlation between geographical proximity and a sexual network is a key component of STI prevalence due to high probability of choosing another sexual partner within the network [Reference Westercamp40].
Disparities between groups are by definition community-level differences: the community is here intended as physical vicinity (e.g. neighbourhoods) and commonality of purpose [Reference Hogben and Leichliter38].
Reducing STI transmission and acquisition risk in specific ethnic groups requires recognition of these contributing factors. Developing approaches that challenge the underlying social-structural drivers of vulnerability and behaviour are needed. Clinic and community-based interventions could involve counselling and social peer networks to deliver behavioural skill-based interventions such as sexual negotiation and risk perception.
The ethnic disparity in STI diagnosis rates is partially explained by SED, but behavioural and other factors are likely to contribute. To investigate and adjust for other potential predictors of the STI diagnosis rates by ethnicity, behavioural data from the proposed enhancement of GUMCADv2 can be taken into account in a future study. This proposed enhancement is to collect details on high-risk sexual behaviour, including the use of recreational drugs in a sexualized context, and these data will contribute to our understanding of the ethnic disparities in sexual health. Further research into understanding the drivers and context of sexual risk-taking behaviours using geo-spatial information in order to highlight sexual networks is also warranted.
ACKNOWLEDGEMENTS
This research received no specific grant from any funding agency, commercial or not-for-profit sectors.
DECLARATION OF INTEREST
None


