


It is estimated that 1·9 billion people are at risk of I deficiency worldwide( Reference Zimmermann and Andersson 1 ). China is one of the countries most affected by I deficiency disorders (IDD). In 1993, the State Council of China announced a policy to virtually eliminate IDD by year 2000 and adopt universal salt iodisation (USI) as the national strategy( Reference Zhao and Haar 2 ). Since 1995, China has implemented an I nutrition surveillance system. This system uses the median urinary I concentration (MUI) to monitor I nutritional status in national or regional surveys as recommended by the World Health Organization et al.( 3 ). National IDD survey results indicate that the population’s I nutritional status has improved significantly, and China has attained the goal of sustainable IDD elimination since 2005( Reference Sun, Xiao and Liu 4 ). In these population-based surveys, school-aged children (SAC, aged 6–12 years) are most commonly involved because of their vulnerability and easy access( 3 ). MUI of SAC has been used as the proxy biological indicator for I nutrition status in the general population for more than two decades under the assumption that it represents the I status of the whole populations( 3 ). Although increasingly surveys measured urinary I in children, pregnant women or other populations( Reference Zimmermann, Connolly and Bozo 5 – Reference Eric-Alain, Rajan and Werner 7 ), a few of them compared the MUI of different populations by geographic area or community levels (national, sub-national, county and household). A number of studies matched the MUI of children only with pregnant women, and the results were inconsistent. Some of them concluded that children’s urinary I level could be used as a proxy for pregnant women( Reference Wong, Sullivan and Perrine 8 – Reference Roza, Svetlana and Frits 10 ); others suggested that MUI of SAC should not be used as a surrogate for monitoring I status during pregnancy( Reference Gowachirapant, Winichagoon and Wyss 11 – Reference Ren, Sang and Shen 13 ). Evaluation of the current recommendation of using MUI in SAC as a proxy for I status in the general population and population most vulnerable to I deficiency, such as pregnant women, has been recently recognised as a research priority( Reference Andersson, de Benoist and Rogers 14 ). Hence, the aims of this article were to address whether MUI in SAC can be used confidently to indicate I nutritional levels of the following population groups: pregnant women, lactating women, women of childbearing age (non-pregnant and non-lactating) and adult men and women aged 18–45 years and to explore some influencing factors.
Methods
Data sources
This is a secondary data analysis. Fig. 1 describes the flow of data collection, cleaning and analyses; two national and two regional survey data sets were included in this study. In the two most recent (2011 and 2014) National IDD Surveys, the probable proportion to size method( 3 ) was used and stratified at the province level, with thirty counties selected in each province( Reference Liu, Su and Shen 15 ). The two regional surveys were the 2009 Iodine Nutrition Survey in Coastal Provinces’ Populations (hereafter referred to as the 2009 Coastal Provinces Survey, from north to south, including three provinces, Liaoning, Zhejiang and Fujian, and one municipality, Shanghai, from eleven coastal provinces)( Reference Yu, Liu and Shen 16 ) and the 2009–2014 High Iodine Deficiency Risk Areas Survey (hereafter referred as High Risk Areas Survey); the counties in this survey were chosen on the basis of historical cretinism prevalence or iodised salt coverage rate lower than 80 %. All surveys were approved by the National Health and Family Planning Commission of the People’s Republic of China. Informed consent was obtained from all groups of adult participants and from the guardians of SAC. All participants recruited were self-reported healthy and without a history of thyroid diseases or were not taking thyroid medications.
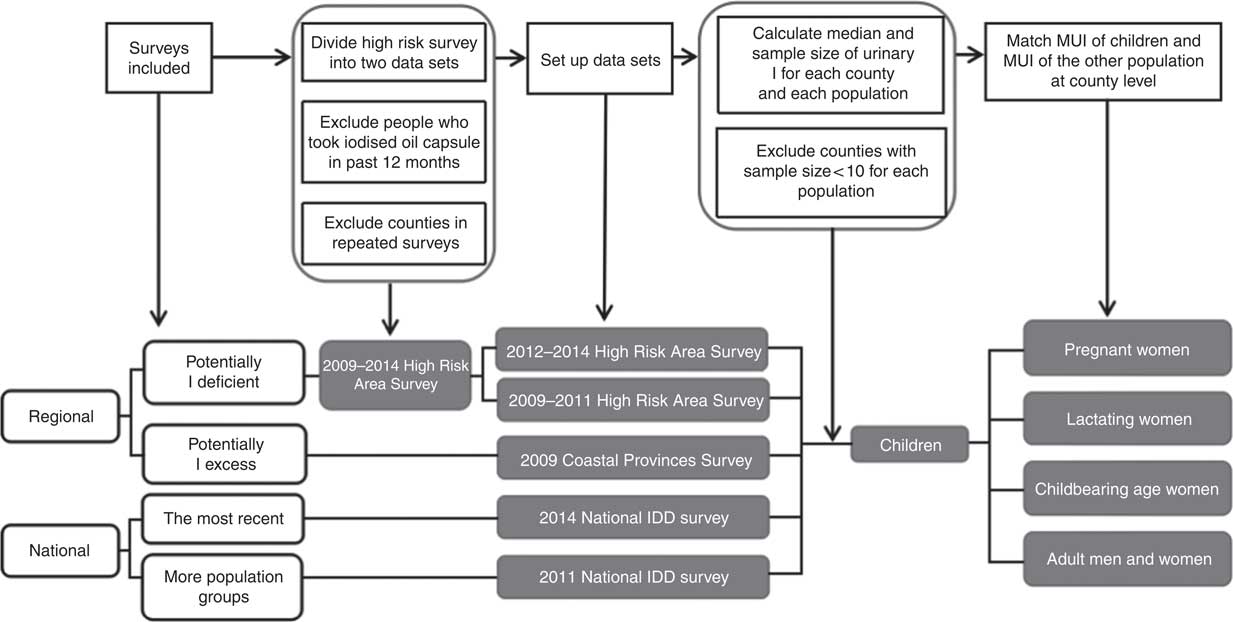
Fig. 1 Flow chart of the data analysed. MUI, median urinary I; IDD, I deficiency disorders.
Evaluation standards
Urinary I concentration of spot urine samples in these surveys was measured using the modified acid digestion method, As3+−Ce4+ catalytic spectrophotometry( Reference Yan, Zhang and Liu 17 ). The WHO criteria for determining I concentrations were used( Reference Zimmermann and Andersson 1 ): for SAC, women of childbearing age and adults, insufficient MUI<100 μg/l, adequate MUI 100–199 μg/l, above requirement MUI 200–299 μg/l and excessive MUI≥300 μg/l( Reference Zhao and Haar 2 ); for pregnant women, insufficient MUI<150 μg/l, adequate MUI 150–249 μg/l, above requirement MUI 250–499 μg/l and excessive MUI≥500 μg/l; and for lactating women, insufficient MUI<100 μg/l (as there is no other cut-off value for above requirement and excess for lactating women, adult cut-off values were used as surrogate in some analyses)( 3 ).
Statistical methods
The MUI for each population group (SAC, pregnant women, lactating women, women of childbearing age and adults) in each county was calculated. For all surveys, a county’s data were excluded from the analysis even one population group’s sample size was <10. For High Risk Areas Survey, a person’s data were excluded from the study if the person had taken iodised oil capsules during the past 12 months before the survey. The data sets from the High Risk Areas Surveys were pooled into 2009–2011 and 2012–2014 sub-data sets as the survey was carried out annually and the population groups were different between two stages. If a county was sampled more than once in different years, then only data from the most recent year were used. The MUI of SAC and MUI of the comparison population groups were matched at county level.
In all, three approaches were used to evaluate the correlation and agreement between MUI of SAC and MUI of the other population. First, scatter plots of MUI of the two matched populations were obtained (each dot representing one county, X axis is the MUI of SAC and Y axis is the MUI of the other population). Pearson’s correlation coefficient was calculated, and values >0·7 were defined as high correlation( Reference Mukaka 18 ). Second, Bland–Altman plots were used to assess agreement (each dot representing one county, X axis is the mean of MUI of SAC and MUI of the other population for each county and Y axis is the difference of MUI of SAC and MUI of the other population for each county)( Reference Rothwell 19 ). For these plots, the mean difference (average of all values in Y axis) was calculated (with 95 % CI) to assess bias, and agreement limits were calculated using the mean difference±1·96 sd. The better the agreement, the closer the mean difference is to 0 and smaller the range between the two agreement limits. The third approach categorised MUI of each population in all counties into four categories: I insufficient, adequate, above requirement and excessive according to the WHO criteria( 3 ). A two-way table was constructed to compare the SAC and the other population using these categories. The proportion of concordant pairs (the proportion of counties with two matched populations with same I status) and κ were then calculated to assess agreement. A κ value >0·4 indicates a moderate agreement( Reference Landis and Koch 20 ).
SPSS 17.0 (Polar Engineering and Consulting) was used for calculating the correlation coefficient, the concordant proportions and for creating the scatter plots, the Bland–Altman plots and the κ test.
This study was conducted according to the guidelines laid down in the Declaration of Helsinki, and all surveys were approved by the Harbin Medical University. Written informed consent was obtained from all adult subjects and guardians of children.
Results
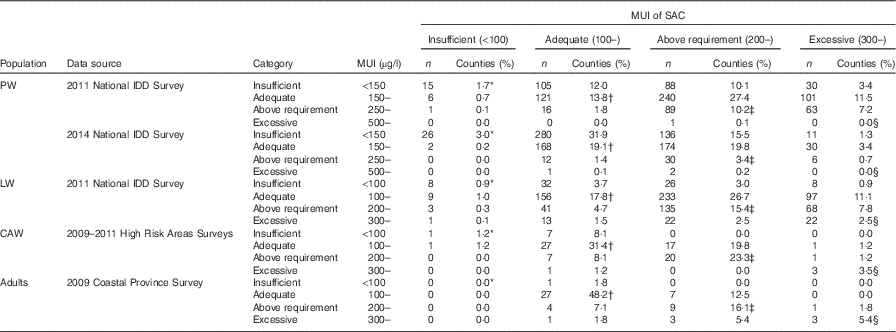
Table 1 summarises the number of samples and counties from each survey that were used for analyses in this study. SAC were included in all surveys, and other populations were included in different surveys; thus, each comparison between two populations may use data sets from different surveys.
Table 1 Basic information of different surveys
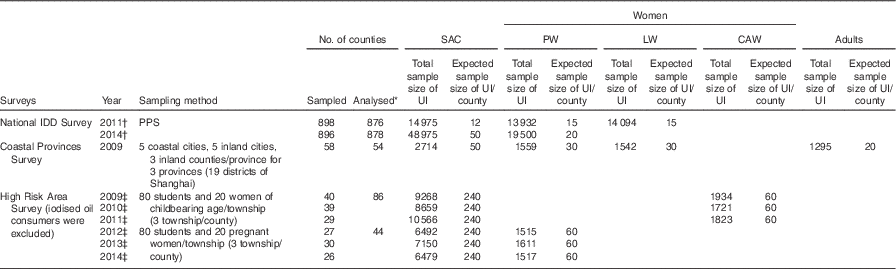
UI, urinary I concentration; SAC, school-aged children; PW, pregnant women; LW, lactating women; CAW, childbearing age women; IDD, I deficiency disorders; PPS, probable proportion to size method.
* For all surveys, a county’s data were exclude from the analysis if one population’s sample size was <10 or if we were unable to match two population groups (because a county having a sample size <10 was excluded from that population). Data from High Risk Area Survey from 2009 to 2011 were pooled together for analysis and similarly from 2012 to 2014.
† Same project carried out in different years.
‡ Same project carried out in different years.
Pregnant women and school-aged children
A total of four data sets were used for comparing MUI concentrations of pregnant women and SAC: the 2011 National IDD Survey (13 932 pregnant women and 14 975 children), the 2014 National IDD Survey (19 500 pregnant women and 48 975 children), the 2012–2014 High Risk Areas Survey (2532 pregnant women and 10 974 children) and the 2009 Coastal Provinces Survey (1559 pregnant women and 2714 children). The main results are presented in Table 2. Fig. 2 shows the scatter plots constructed with MUI of pregnant women and SAC from the four data sets. In the two national surveys, the Pearson’s correlation showed low correlation between MUI of pregnant women and SAC (Fig. 2(a) and (b)). The correlations of the regional surveys were relatively stronger (Fig. 2(c) and (d)).
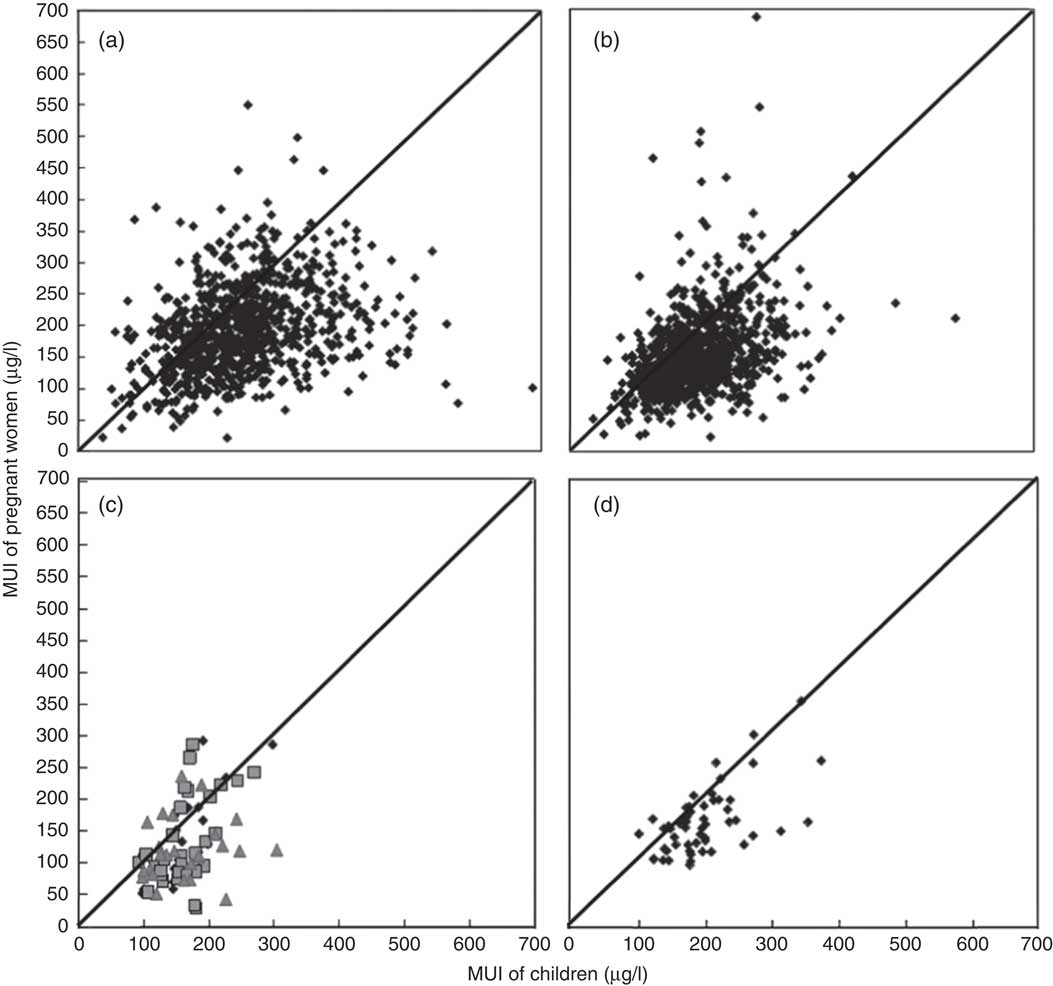
Fig. 2 Scatter plot of median urinary I concentrations (MUI) of pregnant women and children by county level for (a) 2011 National Iodine Deficiency Disorder (IDD) Survey (n 876, r 0·31, P<0·05), (b) 2014 National IDD Survey (n 878, r 0·37, P<0·05), (c) 2012–2014 High Risk Area Survey (n 44, r 0·50, P<0·05; ![]() , 2012;
, 2012; ![]() , 2013;
, 2013; ![]() , 2014) and (d) 2009 Coastal Provinces Survey (n 54, r 0·58, P<0·05). Each dot is one county, diagonal lines are y=x.
, 2014) and (d) 2009 Coastal Provinces Survey (n 54, r 0·58, P<0·05). Each dot is one county, diagonal lines are y=x.
Table 2 Main results of three different comparison methodsFootnote *
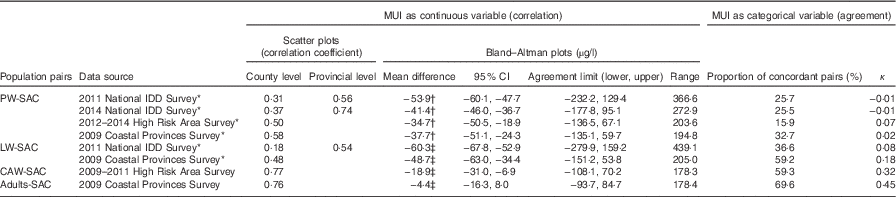
MUI, median urinary I; PW, pregnant women; SAC, school-aged children; LW, lactating women; CAW, childbearing age women.
* ‘Weak’ correlation group for comparing with ‘strong’ correlation groups.
† We expect the mean difference to be 50 µg/l.
‡ We expect the mean difference to be 0 µg/l.
The mean difference between MUI of pregnant women and SAC was approximately −50 µg/l, which means the MUI of pregnant women was 50 µg/l lower than that of SAC. However, for pregnant women, the value for adequate I nutrition was 150–249 µg/l and it was 100–199 µg/l for children; in other words, in pregnant women, the value should be 50 µg/l higher. The range of agreement limits was wide, nearly 200–400 µg/l. The proportion of counties with concordant pairs of pregnant women and SAC classified in the same I nutrition status group was low, only about 30 %. The κ scores indicated low agreement (<0·1).
Lactating women and school-aged children
We used two data sets for analysing the relationship between lactating women and SAC – the 2011 National IDD Survey (14 094 lactating women and 14 975 children) and the 2009 Coastal Province Survey (1542 lactating women and 2714 children). Pearson’s correlation was low (r 0·18, P<0·05, Fig. 3(a)) between MUI of lactating women and MUI of SAC in the 2011 National IDD Survey and moderate (r 0·48, P<0·05, Fig. 3(b)) in the 2009 Coastal Provinces Survey. Similar to pregnant women, the Bland–Altman plots showed that the mean difference of MUI in lactating women and SAC was also about −50 µg/l. The range of agreement limits was wide, nearly 200–400 µg/l.
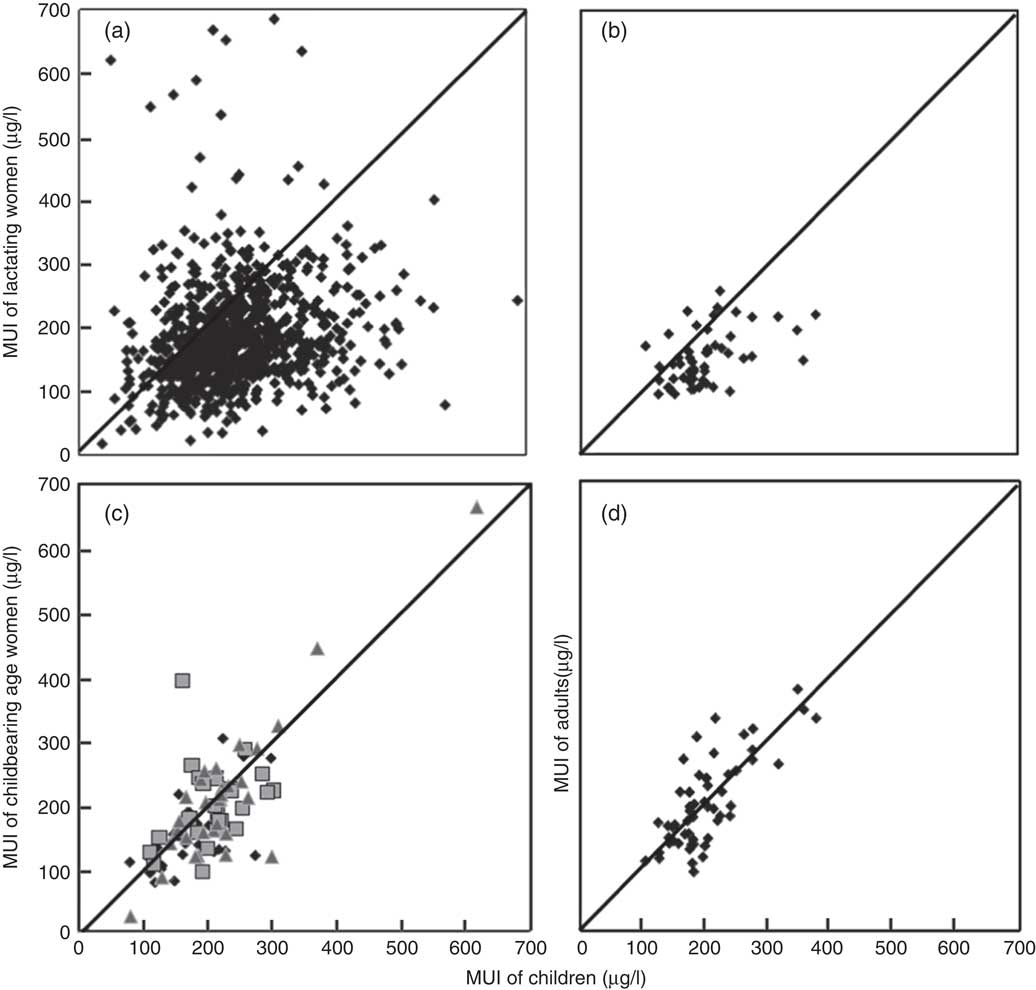
Fig. 3 Scatter plot of county median urinary I concentrations (MUI) between children and (a) lactating women from the 2011 National Iodine Deficiency Disorders (IDD) Survey (n 876, r 0·18, P<0·05), (b) lactating women from 2009 Coastal Provinces Survey (n 54, r 0·48, P<0·05), (c) women of childbearing age from 2009–2011 High Risk Area Surveys (n 86, r 0·77, P<0·05; ![]() , 2009;
, 2009; ![]() , 2010;
, 2010; ![]() , 2011) and (d) adults from the 2009 Coastal Provinces Survey (n 54, r 0·76, P<0·05). Each dot is one county, diagonal lines are y=x.
, 2011) and (d) adults from the 2009 Coastal Provinces Survey (n 54, r 0·76, P<0·05). Each dot is one county, diagonal lines are y=x.
The proportion of counties with concordant pairs of MUI of lactating women and SAC classified in the same I status was 36·5 and 59·2 %, respectively. The κ values were also low (<0·2).
Women of childbearing age and school-aged children
The 2009–2011 High Risk Areas Surveys were used to compare MUI between women of childbearing age and SAC (4611 women of childbearing age and 23 868 children). A strong correlation was observed between MUI of women of childbearing age and SAC (r 0·77, P<0·05, Fig. 3(c)). The Bland–Altman plots showed that the mean difference in MUI between women of childbearing age and SAC was small (−18·9 µg/l), and the range of agreement limits was narrow (178·3 µg/l). The proportion of concordant pairs between women of childbearing age and SAC classified within the same MUI category was high (59·3 %, Tables 2 and 3). The agreement was stronger between women of childbearing age and SAC (κ=0·32), compared with that between pregnant women and SAC and between lactating women and SAC.
Table 3 Proportion of concordant and discordant pairs for categorised MUI levels between pregnant women, lactating women, childbearing age women, adults and school-aged childrenFootnote *
MUI, median of urinary iodine; SAC, school-aged children; IDD, I deficiency disorders; PW, pregnant women; LW, lactating women; CAW, childbearing age women.
* Concordant pairs.
† Concordant pairs.
‡ Concordant pairs.
§ Concordant pairs.
Adult men and women and school-aged children
The data set from the 2009 Coastal Provinces Survey was used to compare MUI of adult men and women and SAC (1295 adult men and women and 2714 children). Pearson’s correlation showed that the relationship between MUI of adults of both sexes and SAC was strong (r 0·76, P<0·05, Fig. 3(d)). The Bland–Altman plots showed that the mean difference was close to 0 (−4·41 µg/l), and the range of agreement limits was narrow (178·4 µg/l). The proportion of concordant pairs classified in the same I level for the two populations was high (69·6 %, Table 3). The κ value was high (0·45), indicating moderate agreement between the adult population and SAC.
Data matched and analysed at the provincial level
In the above analysis, the MUI of SAC and the MUI of the other population were matched at the county level. In order to determine whether data aggregated at different geographic levels affect the correlation coefficient, data of the two national surveys were also analysed at the provincial level. We found that the correlation coefficient between MUI of pregnant women and MUI of SAC was 0·56 and between MUI of lactating women and MUI of SAC was 0·54 in the 2011 National IDD Survey, and the correlation coefficient was 0·74 between MUI of pregnant women and MUI of SAC in the 2014 National IDD Survey. Both showed improved correlation when data were aggregated at a higher level with larger sample sizes.
Discussion
In this article, we attempted to answer the question whether MUI of SAC is the most appropriate proxy indicator for measuring I intakes of several adult populations. We used three methods – scatter plots, Bland–Altman plots and proportion of concordant pairs and κ and presented consistent results when comparing the ‘strong correlation’ pairs (women of childbearing age and SAC, adults and SAC) with the ‘weak correlation’ pairs (pregnant women and SAC, lactating women and SAC) using a correlation coefficient of 0·7 as the cut-off value. Meanwhile, several factors that could possibly affect the correlation or agreement of the results should be considered.
Using the current WHO criteria for assessing I nutrition in SAC and pregnant women, only 13·8 % counties in the 2011 and 19·1 % counties in the 2014 National IDD Surveys had MUI of SAC and pregnant women that were within the adequate levels simultaneously. If the ‘adequate’ I nutrition range for SAC was increased from 100–199 µg/l to 100–299 µg/l as suggested( Reference Zimmermann, Aeberli and Andersson 21 ), these proportions will increase to 41·2 and 38·9 %, respectively (Table 2). Similarly, if the ‘adequate’ I nutrition range for pregnant women was increased from 150–249 to 100–249 µg/l as recommended for countries where USI has been effective for at least 2 years with salt adequately iodised and consumed by >90 % of the population( 22 ), the proportion will be 22·1 and 41·9 %, respectively. The third scenario is that if the ‘adequate’ I nutrition ranges for children and pregnant women were increased at the same time (for children, 100–299 µg/l, and for pregnant women, 100–249 µg/l), the proportion will be 57·8 and 74·4 % for the 2011 and the 2014 National IDD Surveys, respectively. Thus, the proportion of concordant pairs is sensitive to the change of cut-off points that were used to define the I status. Determination of I nutritional status of a population is currently performed by measuring UIC in spot samples obtained from SAC, from which a MUI is calculated to define that entire population. The validity of calculations or extrapolations from spot urine to define the severity of I deficiency is questionable. Our viewpoint is that the cut-offs of MUI concentration should be reviewed and modified by international organisations, taking habitual dietary I intake and thyroid function status of the surveyed population into consideration.
Data aggregated at the provincial level, rather than the county level, resulted in higher correlation coefficients in this study, and this could be the result of increased sample size. However, studies have shown different correlation coefficients when data were aggregated at sub-national, community and household levels. For example, two studies by Wong et al.( Reference Wong, Sullivan and Perrine 8 ) and Yan et al.( Reference Yan, Chen and Yang 9 ) matched data at the sub-national or provincial level and obtained a higher correlation coefficient, r>0·8; another study matched the data at the settlement level (similar to the county level in this study), and the correlation coefficient was 0·63( Reference Roza, Svetlana and Frits 10 ). However, when data were matched at the household level, the reported correlation coefficients were much lower, 0·43( Reference Gowachirapant, Winichagoon and Wyss 11 ) and 0·16( Reference Jaiswal, Melse-Boonstra and Sharma 12 ). The correlation coefficient of urinary I concentrations between SAC and their mothers of childbearing age was also weak (r 0·17)( Reference Vandevijvere, Mourri and Amsalkhir 23 ). These studies indicate that the level of data matching is a strong influencing factor, which determines the degree of association by impacting on the correlation coefficient.
Urinary sample size influences the median precision of the estimates( Reference Andersson, De Benoist and Rogers 24 ). The number of urine samples collected from each county was different in 2011 and 2014 National IDD Surveys – they were twelve and fifty for SAC and fifteen and twenty for pregnant women from each sample unit (children from schools and pregnant women from communities surrounding the schools), respectively. When the sample size is close to thirty, the variance of the median will be 20 %, and when the sample size is close to fourteen the variance will be 30 %( Reference Andersen, Karmisholt and Pedersen 25 ). This might be partly reflected in the results, as the 2014 survey had a relatively high correlation coefficient compared with the 2011 survey.
The environmental I background (iodised salt supply, food and water I level and food component) among these surveys may vary. For example, the 2009 Coastal Provinces Survey was targeted at coastal regions as it was thought that people in those areas might consume more sea foods, and therefore their I intakes could potentially be high, whereas the 2009–2014 High Risk Area Surveys were focused on regions where people’s I intake could potentially be low because of relatively low iodised salt coverage rates. Counties from the sub-national survey are more homogeneous regarding iodised salt supply, food and water I level, food compositions and dietary habits, etc. compared with counties included in the national survey. Furthermore, between 2000 and 2012, the Chinese salt I fortification standard was 35 (sd 15) mg/kg across the whole nation. However, in 2012, the new salt iodisation standards were released. Provinces now have the autonomy to choose from one of the three salt iodisation standards 20, 25 or 30 mg/kg±30 %( 26 ). Despite these variations, in this study, populations were matched at the county level, and all adult population groups were recruited from the same community from where SAC were selected. This means that the two matched population groups are likely to have similar environmental I background and exposure to similar I content in table salt.
In summary, the level of the correlation and agreement between MUI of children and other adult populations might be influenced by factors such as the cut-off values used for the determination of I adequacy, the level of data aggregation and the sample size from each county, while environmental I background and I content in salt may not.
The main strength of this study is that we included data sets from the most recent 2011 and 2014 Chinese National IDD Surveys, as well as two other sub-national surveys, for determining the correlation and agreement of MUI concentrations between SAC and several adult population groups. Inclusion of a mix of different types of surveys also enabled us to explore possible factors that influence whether surveys of SAC are appropriate indicators to monitor the I status of the entire population. We examined MUI as a continuous variable as well as a categorical variable by comparing populations according to the WHO I nutrition status criteria. Furthermore, in this study, we not only compared MUI between SAC and pregnant women, which has attracted a lot of attention in recent years, but also assessed MUI between SAC and lactating women, women of childbearing age and adult men and women, which has rarely been evaluated or reported.
In conclusion, the comprehensive data analysis of several large national and sub-national data sets indicates that the MUI of SAC is not a reliable indicator for representing I nutrition of the most vulnerable populations for I deficiency – namely, pregnant and lactating women. The findings of this study strongly suggest that urinary I concentrations of pregnant women and lactating women and possibly young children should be included in future IDD programme monitoring in addition to SAC.
Acknowledgements
The authors appreciate all the organisations and people who participated in these surveys, the provincial Centers for Disease Control and Prevention and the Centers for Endemic Disease Control in thirty-one provinces and Xinjiang construction corps. The authors thank Professor Creswell J. Eastman for his constructive suggestions and comments and Yunfeng Han for his suggestions on statistical methods.
All the surveys were funded by the National Health and Family Planning Commission of China. UNICEF partially contributed to the Coastal Provinces Survey. The funders had no role in the design, analysis or writing of this article.
The author contributions are as follows: X. S., Mu L., H. S., J. Y., S. L. and D. S. designed the research; P. L., F. M., L. L., L. F., Ming L. and P. J. K. collected and analysed the data; P. L. and Mu L. wrote the paper; S. L. and D. S. had primary responsibility for the final content. All the authors read and approved the final version of the manuscript.
The authors have no conflicts of interest to declare.


