


INTRODUCTION
Hendra virus (HeV) is a highly lethal zoonotic paramyxovirus identified in 1994 in Australia after an outbreak of novel disease in horses [Reference Murray1, Reference Baldock2]. Infection in horses is attributed to exposure to infectious excretions from pteropid bats (Chiroptera: Pteropodidae), commonly known as flying foxes, which are the natural host of the virus [Reference Young3–Reference Halpin6]. Fifty-two known HeV incidents have occurred in the adjoining eastern Australian states of Queensland (QLD) and New South Wales (NSW) up to 30 December 2015, involving 94 confirmed or possible equine cases [7]. There have been seven human cases (four of which had fatal outcome), all attributed to close contact with infected horses [Reference Playford8, Reference Mahalingam9].
The winter of 2011 saw an ‘unprecedented’ 18 separate HeV incidents involving 23 equine cases in QLD and NSW in a 12-week period, in stark contrast to the 14 incidents and 45 equine cases reported in total in the previous 16 years [Reference Field10]. Prior to 2011, only one incident had been recorded in NSW, the highest number of incidents in any year was two, and multiple years had no reported incidents (1995–1998, 2000–2003, 2005). The 2011 incidents clustered in south-east QLD and northern NSW, with only one incident occurring outside of these regions. It was hypothesized that the high number of incidents reflected a concurrent atypical spike in HeV infection and excretion in flying foxes [Reference Field10]. Post-2011, the number of reported incidents has remained elevated relative to pre-2011 numbers with eight, seven and four reported in 2012, 2013 and 2014, respectively [7].
An early study exploring possible risk factors for HeV infection in horses compared the index cases from the first two recorded incidents [Reference Baldock2]; common features included older pregnant mares at pasture in late winter to early spring. A more recent review of HeV incidents in NSW showed that all index cases were horses at pasture on properties visited by flying foxes [Reference Ball11]. Interestingly, that study noted that around 50% of case horses were found dead or dying on a fence line, suggesting that the clinical manifestation of infection compromised their ability to identify or avoid such barriers. McFarlane et al. [Reference McFarlane, Becker and Field12] identified a positive statistical association between incidents and the dry season in eastern Australia (May to October) and postal areas where flying-fox roosts occur. More recently, Smith et al. [Reference Smith13] showed a positive association between incidents and the density of Pteropus alecto and P. conspicillatus. Other hypothesized risk factors for infection in horses include property attributes, husbandry and management practices [Reference Smith13–Reference Field15], pathogen shedding and survival, spillover host exposure and susceptibility [Reference Plowright16, Reference Scanlan17].
We undertook an analysis of equine submissions to the Queensland Government veterinary reference laboratory for HeV testing over a 20-year period in order to identify and investigate any patterns. The primary aim was to identify trends in submission, testing and detection rates, and drivers for submissions. A secondary aim was to identify submission and horse-level attributes associated with the detection of HeV in horses.
METHODS
Laboratories and tests
The Biosecurity Sciences Laboratory (BSL), as the state veterinary reference laboratory, has primary responsibility for HeV testing of horses in QLD. BSL (previously Yeerongpilly Veterinary Laboratory) is a Queensland Government facility managed and operated by Biosecurity Queensland (BQ), an agency of the Department of Agriculture and Fisheries (DAF). Submissions were received, managed and tested in accordance with NATA-accredited protocols (http://www.nata.com.au/nata). Prior to July 2008, BSL forwarded submissions from attending veterinarians requesting HeV testing, plus any additional submissions assessed by BSL pathologists as meeting the HeV clinical case definition, to the national veterinary reference laboratory (CSIRO Australian Animal Health Laboratory; AAHL) for testing. AAHL employed quantitative reverse transcription–polymerase chain reaction (qRT–PCR) assays based on both the HeV P and N genes to detect HeV RNA. From July 2008, coincident with a revised and broadened case definition, the testing was conducted in QLD, initially at the Queensland Health Forensic and Scientific Services (FSS) laboratory, and from May 2009, at BSL, using a qRT–PCR targeting the HeV M gene [Reference Smith18]. Samples testing positive by FSS or BSL were forwarded to AAHL and/or FSS for corroboration and for possible further investigation including virus isolation and genetic analysis.
Submissions
A total of 19 690 equine submissions were received by BSL between July 1994 and June 2014. Of these, 2552 submissions from clinically ill horses were tested for HeV, with 1349 having sufficient data recorded on the accompanying specimen advice sheet to support statistical analysis. Submissions requesting HeV testing in clinically healthy horses as a component of general health screening (e.g. for sale or export purposes, or where companion horses on a HeV case property were being monitored) were not included in the analysis.
HeV webpage visits
The DAF HeV webpage visitation statistics were compiled by DAF Media and Communications personnel (https://www.daf.qld.gov.au/biosecurity).
Data and analysis
The pattern of HeV testing before and after strategic time-points was examined in the context of total equine submissions. Weekly equine submission data and HeV testing data was subjected to a two-sample F test to establish variance, and subsequently a two-sample t test assuming unequal variances. The mean and range are reported. The relationship between reported equine cases and visitations to the DAF HeV webpage is illustrated.
Potential associations with HeV test outcome were explored by subjecting descriptive submission data (location, year, season) and horse data (age, type) from 1349 submissions (above) to a generalized linear model (GLM) [Reference McCullagh and Nelder19] under the binomial distribution and logit link, using GenStat [20]. Adjusted mean HeV prevalence and standard errors were estimated and reported for statistically significant variables and variables of interest. The variable ‘location’ classifies the submission property location north or south of the Tropic of Capricorn (23° 26′ S), which bisects the state, with the temperate zone to the south and the tropical zone to the north (after [Reference Plowright16]). ‘Year’ and ‘season’ were derived from the date of submission; ‘season’ in the Southern Hemisphere was defined as spring (September–November), summer (December–February), autumn (March–May) and winter (June–August). ‘Age’ was categorized into quartiles of 0–4, 5–9, 10–16 and 17–40 years. ‘Type’ was categorized as Arabian (Arab, Anglo-Arab, Arab-X), Draft (Clydesdale, Percheron, Percheron-X, Shire), Miniature and Pony (Miniature, Shetland pony, Welsh mountain pony, Welsh mountain pony-X), Quarterhorse and Thoroughbred, Standardbred, Miscellaneous (Appalousa, Australian stockhorse, Crossbred, Warmblood), and stockhorse. ‘Australian stockhorse’ is a recognized breed type; ‘stockhorse’ is a general description commonly used for horses that work stock and may include horses of various breed types.
A derived dataset comprising all 37 HeV-positive submissions and 148 randomly selected HeV-negative submissions that had sufficient data was analysed as a case-control study to identify any association between presenting clinical signs and HeV test outcome. A veterinarian classified submissions as neurological (Nr), respiratory (Rn), neurological and respiratory (NR), or neither neurological nor respiratory (nr) on the basis of clinical history reported on the specimen advice sheet. A ratio of four controls to one case was used, there being generally little increase in precision above this ratio [Reference Wacholder21]. GLM analysis adjusted mean HeV prevalence and standard error were estimated and reported.
RESULTS
Figure 1 illustrates the weekly HeV testing rate and reported HeV incident occurrence against the background of all equine submissions to BSL over the 20-year period. Eighty-five submissions fitting the original case definition were tested in the 14 years prior to July 2008; 2467 submissions fitting the revised case definition were tested in the subsequent 6 years to June 2014. The marked spike in submissions in late 2007–early 2008 reflects an anomalous increase in non-HeV submissions associated with the detection and eradication of equine influenza (EI) in Australia at the time [Reference Cowled22]. Excluding these EI submissions, there was no significant difference between the average weekly total number of equine submissions before and after July 2008 (P = 0·22).
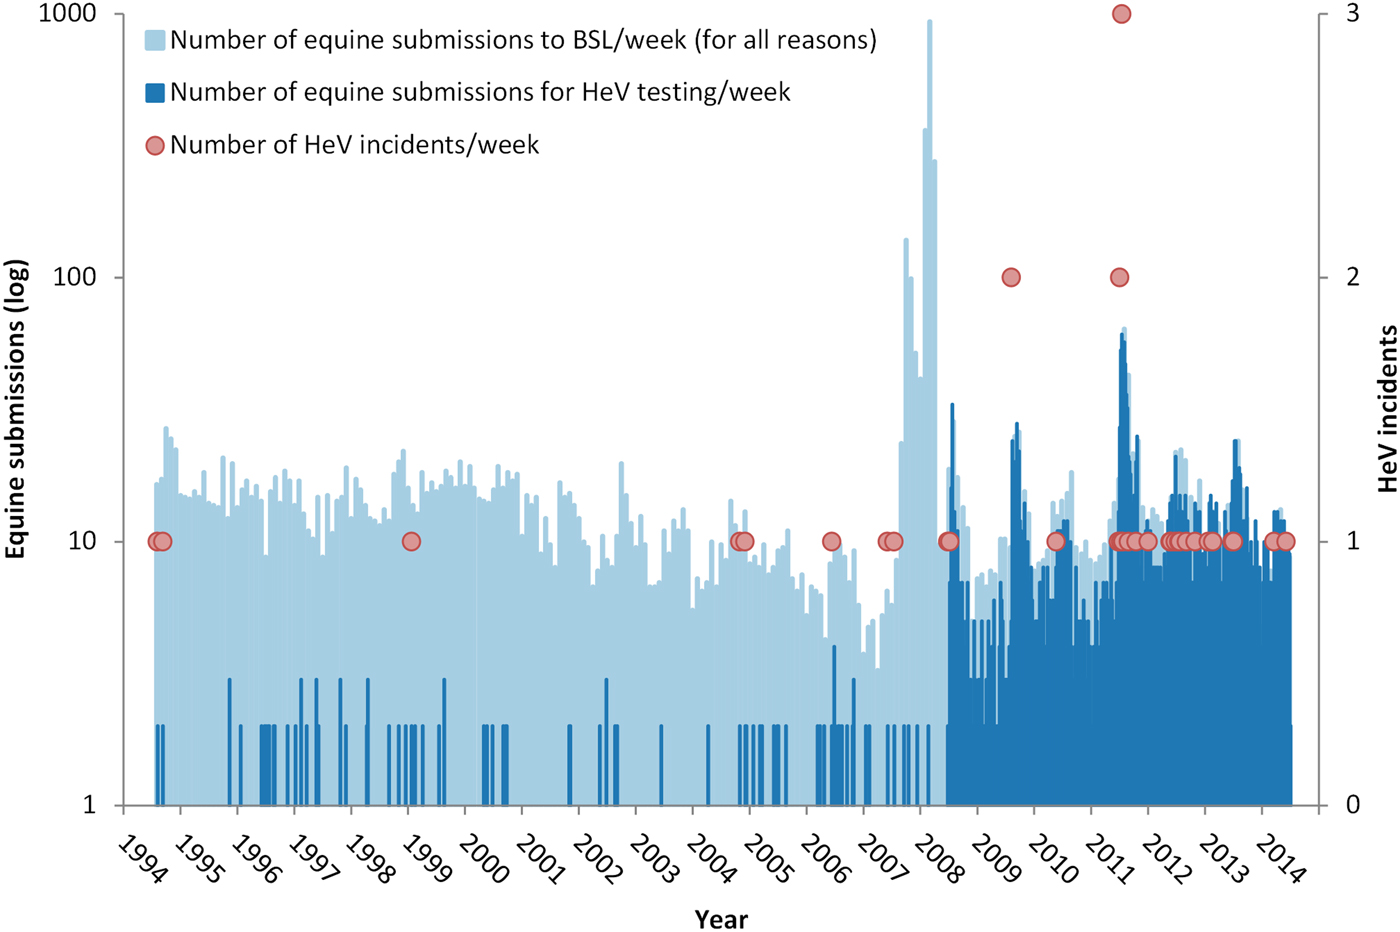
Fig. 1. Weekly Hendra virus (HeV) testing rate and reported HeV incidents against the background of all equine submissions to the Biosecurity Sciences Laboratory (BSL) for the 20 years from 1994 to 2014. The marked spike in submissions late 2007–early 2008 reflects an anomalous increase in submissions associated with the detection and eradication of equine influenza at that time. (Note the y-axis log scale.)
Figure 2 illustrates the weekly HeV testing rate and reported HeV incident occurrence against the background of the visitation rate to the DAF HeV webpage for the period July 2008–June 2014. Prior to July 2008, BSL conducted an average of one HeV test every 2 months. Between 2008 and 2011, the average rate was 2·6 (range 1·8–3·4) tests per week in the month preceding the first reported winter case, increasing to an average of 21·8 (range 13·4–30·2) per week in the following month (P < 0·01). Between 2012 and 2014, this trend continued (although non-significantly, P = 0·17) with the average testing rate increasing from 9 (range 7·3–10·7) horses per week in the month preceding the first reported winter case to an average of 11·8 (range 8·1–15·5) per week in the following month. Visits to the webpage show a marked spike following a reported incident.
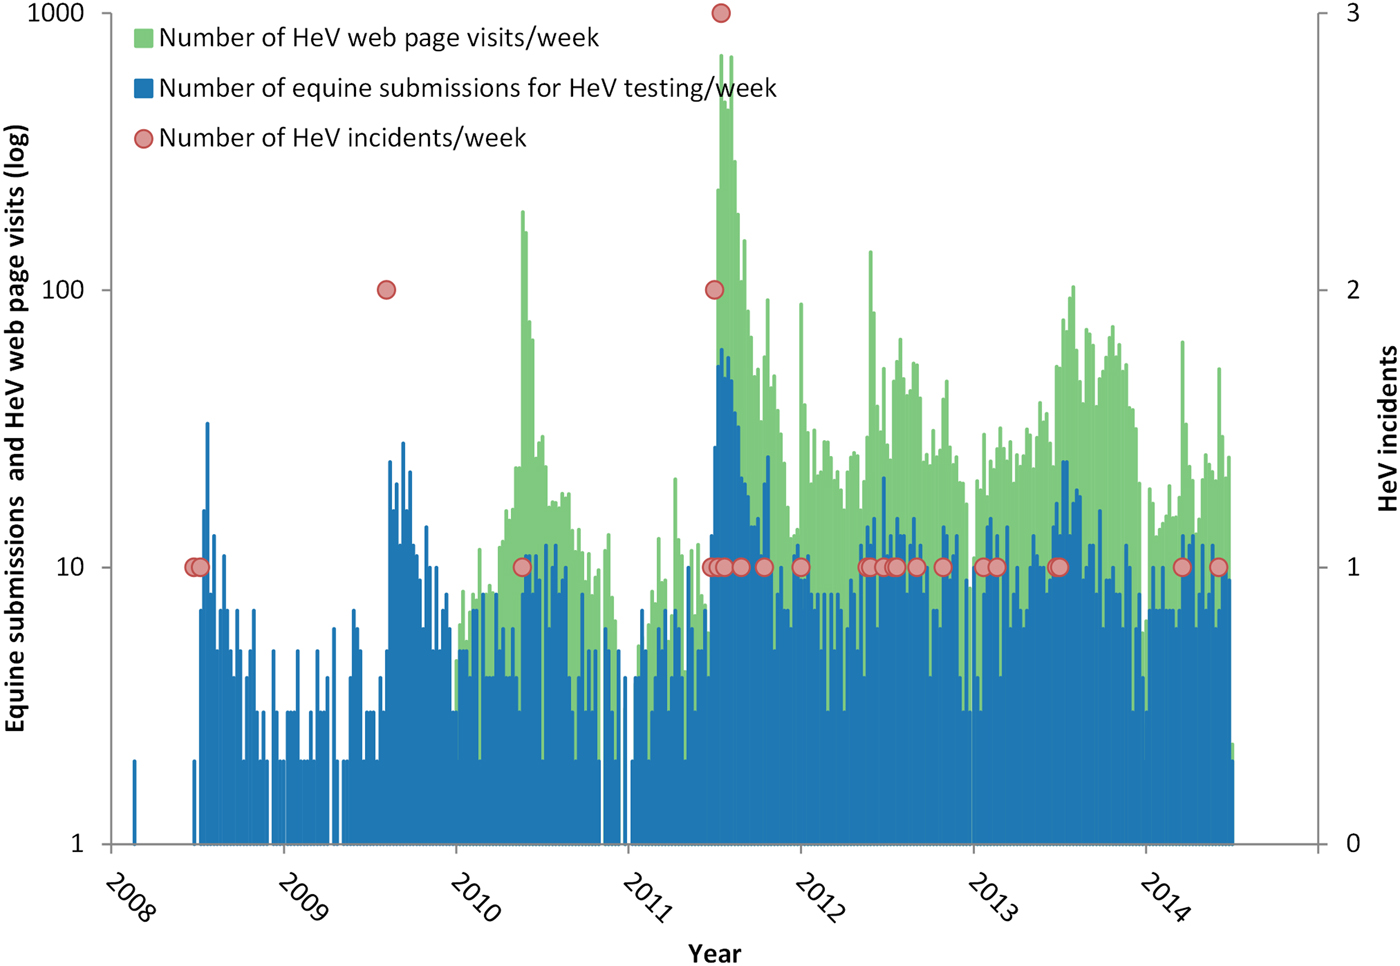
Fig. 2. Weekly Hendra virus (HeV) testing rate and reported HeV incidents against the background of the visitation rate to the Department of Agriculture and Fisheries HeV webpage for the period July 2008–June 2014. (Note the y-axis log scale.)
The adjusted mean HeV prevalence in tested submissions between 1994 and 2014 was 2·1% (range 2·0–2·1%). Adjusted mean HeV prevalence in 2011 was 2·4% (range 2·3–2·5%). The variables location, season, type, and the interaction term year*location were statistically significant (P < 0·01, 0·04, <0·01, <0·01, respectively). The variables age and year were not (P = 0·21 and 0·76, respectively) (Fig. 3a–d ).
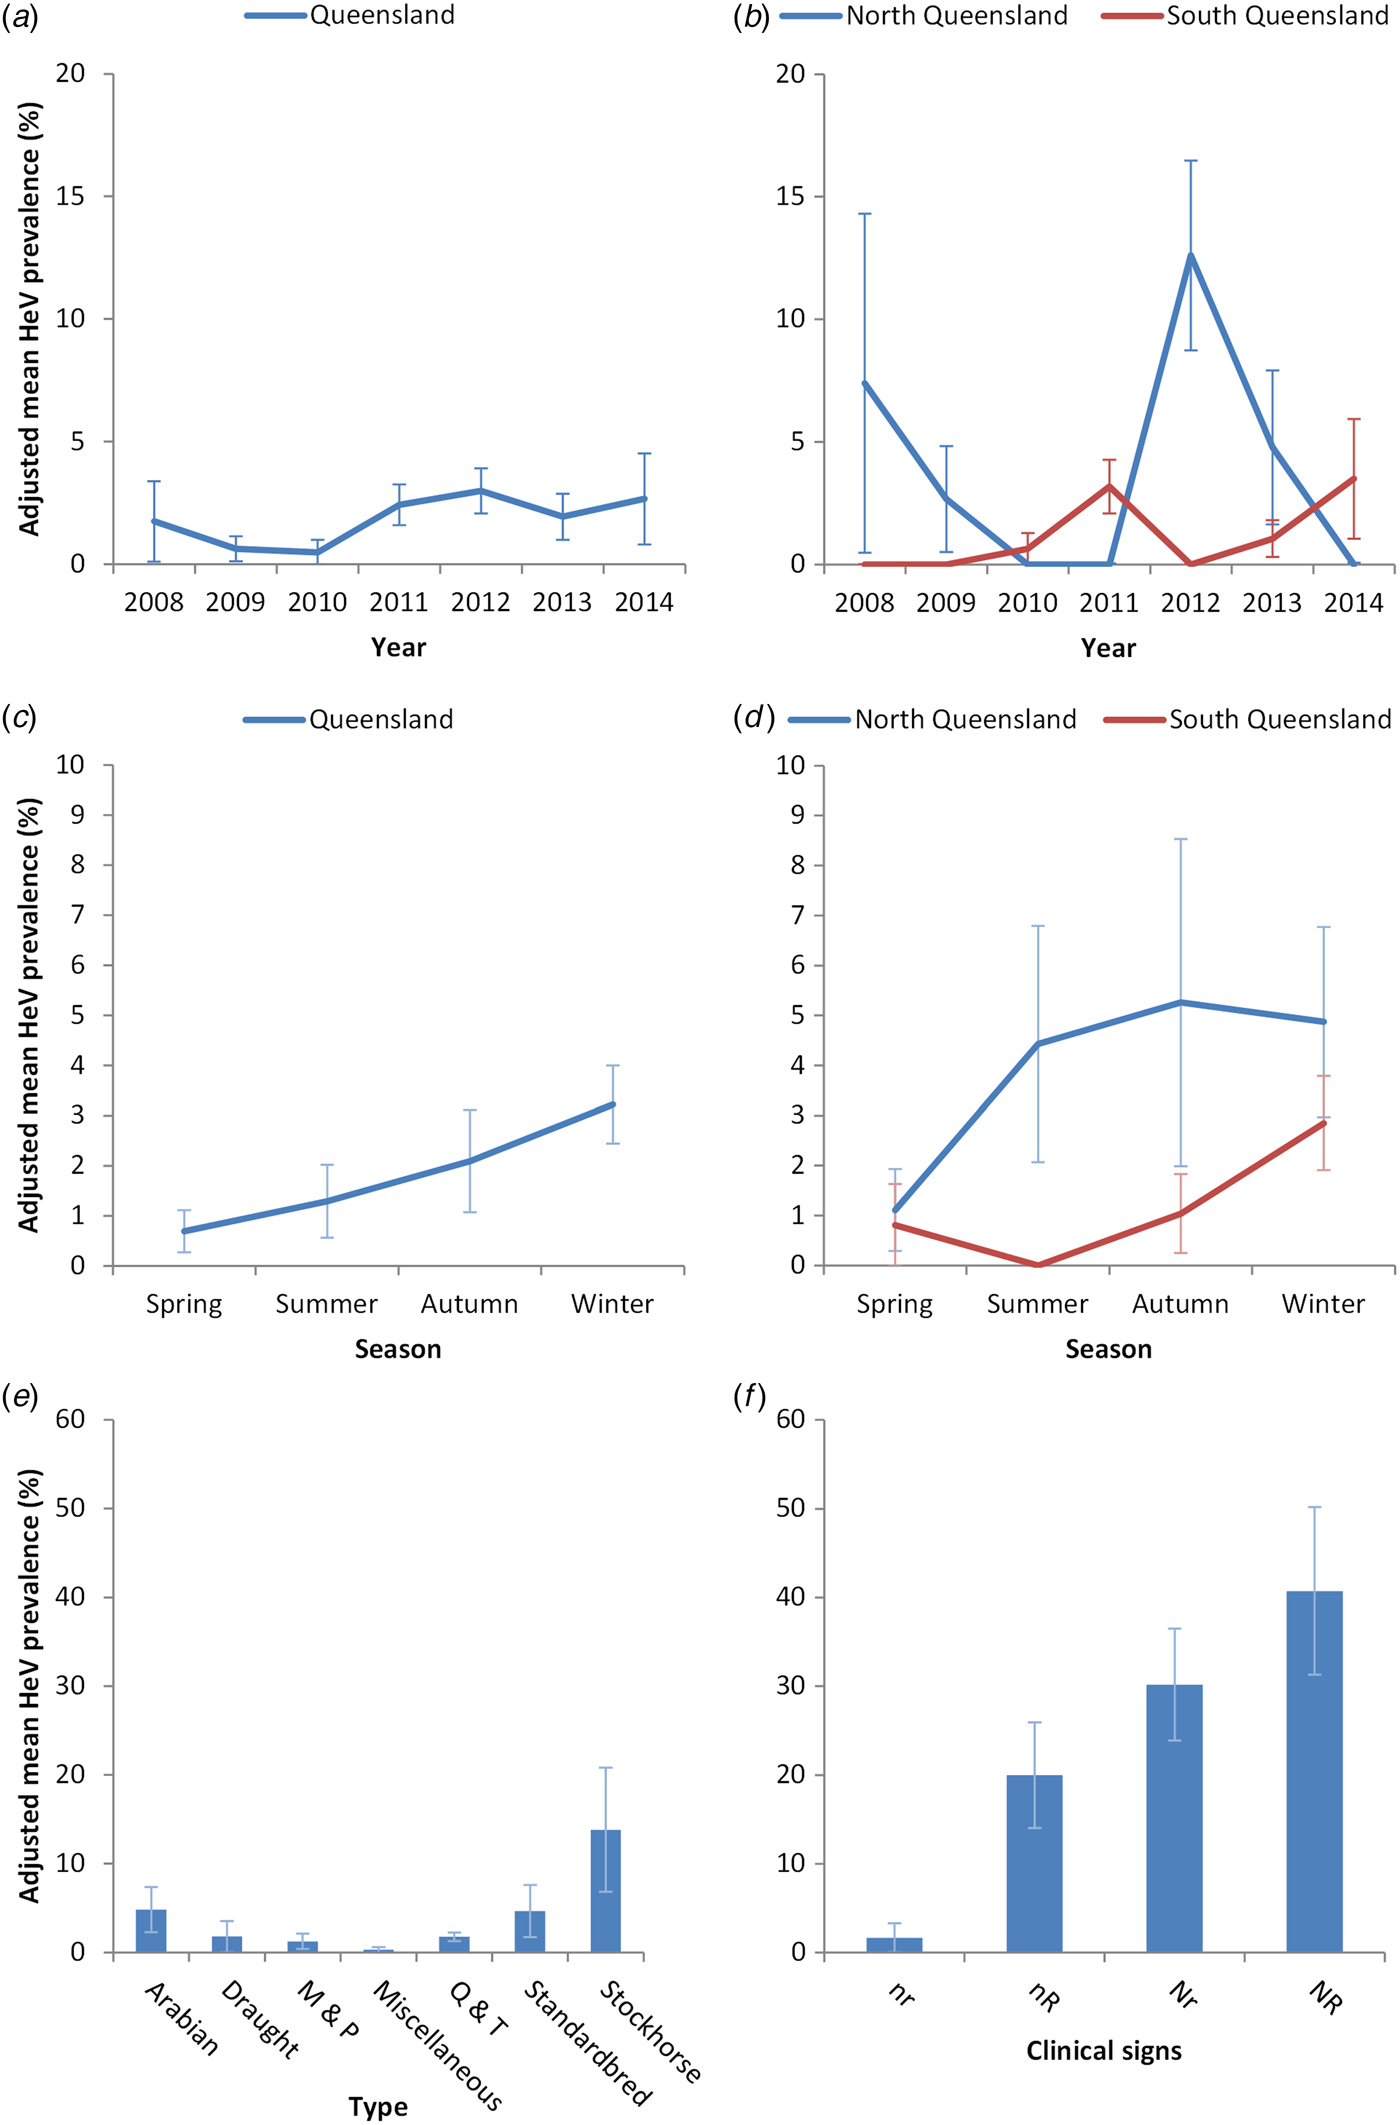
Fig. 3. Hendra virus (HeV) prevalence in equine submissions to the Biosecurity Sciences Laboratory for the period July 2008–June 2014. (a) Year (P = 0·76), (b) year*location (P < 0·01), (c) season (P = 0·04), (d) location*season (P = 0·20), (e) type (P < 0·01), (f) clinical signs (P < 0·01). Adjusted means and standard errors are presented.
Detection prevalence was significantly higher in submissions from horses exhibiting both neurological and respiratory (NR) signs (40·1%, range 31·3–50·2%), compared to those from horses exhibiting neurological (Nr) signs only (30·2%, range 23·9–36·5%), respiratory signs (nR) only (20·0%, range 14·0–26·0%), and neither neurological nor respiratory (nr) signs (1·7%, range 0·0–3·3%) (Fig. 3f ).
DISCUSSION
This study provides a unique insight into the dynamics and drivers of equine submissions and HeV testing in QLD over a 20-year period. It shows marked increases post-July 2008 in the overall rate of HeV testing, and in the rate of submission and testing following reported HeV incidents. It also identifies spatio-temporal, seasonal and clinical attributes associated with the detection of HeV in horses.
Figure 1 shows that the total weekly equine submission rate (for all reasons) over the 20 years has been relatively constant, with the exception of the marked peak in 2007–2008 associated with EI submissions [Reference Cowled22]. Thus the increased number of submissions for HeV testing post-July 2008 is unrelated to the total number of submissions. Two other factors likely contributed to the increase. The first, and most fundamental, was a broadening of the clinical case definition of HeV infection in horses circulated by (now) DAF on 9 July 2008 [Reference Perkins23]. This effectively meant that samples from any febrile horse submitted to BSL exhibiting either respiratory or neurological signs were tested. The second factor was a cluster of HeV cases at an equine veterinary practice in the greater Brisbane area in late June and July 2008 [Reference Playford8, Reference Field24]. This incident had sustained public profile because it was readily accessible to statewide media, involved multiple horses and two human cases, and had an extended quarantine period. Thus, it likely precipitated a cascade of awareness- and concern-driven submissions from veterinarians wishing to exclude HeV infection in sick horses which they were concurrently or subsequently treating, when previously they may not have considered HeV as a differential diagnosis. A second separate incident in north QLD in July likely extended awareness and concern in horse-owners and treating veterinarians.
Two clear trends are evident post-2008. First, the ‘background’ average number of HeV tests per week in the month preceding the first reported winter case increased from 2·6 (2008–2011) to 9·0 (2012–2014) in the absence of an increase in the total number of equine submissions. This increase in testing likely reflects increased consideration of HeV infection as a differential diagnosis in clinically ill horses attributable to active government and industry efforts to communicate HeV risks to horse-owners and veterinarians, periodically reinforced by intense media coverage of new HeV incidents. Second, there has been a marked increase in the number of equine submissions for HeV testing following the detection and public reporting of a new HeV incident. This association is most markedly illustrated in 2011 and is plausibly explaind by the psychological phenomenon of social amplificaion of risk, wherein a relatively small risk provokes ‘strong public concerns and results in substantial impacts upon society and economy’ [Reference Kasperson25]. The episodic-heightened public interest in HeV is additionally illustrated by the surge in visits to the DAF HeV webpage following an incident. Degeling & Kerridge [Reference Degeling and Kerridge26] commented that the ‘unprecedented number of [HeV] incidents in 2011 seems to have served as a “focusing event” that raised the public visibility of both HeV and flying-fox management and made them a pressing public health issue’. Further, they suggested that while total HeV media coverage was higher in 2011 than in previous years, there was also a shift in focus from ecological drivers for emergence to scientific uncertainty about the transmission and behaviour of the virus, contributing to a heightened public concern that HeV was ‘out of control’.
Interestingly, while 2011 is frequently referred to as an ‘unprecedented’ year for HeV incidents, the overall HeV prevalence in equine submissions for the year (2·4%) was only modestly above the average of all years (2·1%). While there is evidence of increased HeV excretion prevalence in multiple flying-fox colonies in central and southern QLD in 2011 [Reference Field27], the increase in HeV detection in horses could plausibly reflect increased surveillance as a consequence of the increased submission rate, and prompts consideration of the effect of the high number of submissions on detection prevalence. As veterinary awareness and horse-owner concern increases with reported incidents, the number of submissions increases, and cases that may otherwise have been missed may be detected. While this scenario may be concerning given the consequences of HeV infection, it should not be unexpected given the non-specific nature of clinical signs of HeV infection in horses and the effect of sample size on surveillance. Thus while infection and excretion prevalence in flying foxes may fundamentally underpin equine exposure risk [Reference Field27], we suggest that veterinary awareness and horse-owner concern influences equine submission rates, and therefore the number and clustering of detected equine HeV cases.
With a paucity of HeV incidents (1995–1998 and 2000–2004), early attempts at describing spillover dynamics involved cautious extrapolation of possible predisposing characteristics of the equine index cases, such as breed, age and sex [Reference Baldock2, Reference Field28]. The accumulation of cases over the last 20 years provides a more substantial dataset for interrogation of horse-level variables associated with HeV infection. In this study, we found a significant statistical association with type, with stockhorses over-represented as cases. However, interpretation of this finding needs to be made with care, as the term ‘stockhorse’ is often used colloquially to describe a horse of any breed that is used primarily for working livestock. A plausible explanation may be that stockhorses are more likely to be paddocked at night than stabled, and thus recommended exposure-risk mitigation strategies (such as excluding horses from the vicinity of trees in which flying foxes are feeding) [29] may be more difficult to implement, resulting in increased exposure risk.
Our finding of significantly different between-year frequency of HeV detection in submissions from north and south QLD suggest a spatio-temporal variable exposure risk for horses. While the latter could have multiple components, there is empirical evidence of spatio-temporal variation in flying-fox excretion prevalence [Reference Field27], and by extension, equine risk exposure probability [Reference Plowright16]. However, it is possible that the evident association is confounded by submission rates. For example, it may be that the additional effort and cost of forwarding submissions from north QLD (to BSL in south QLD) means that potential submissions undergo a more rigorous clinical and/or logistical pre-screening by the attending veterinarian, and consequently, that submissions from northern QLD have a higher pre-test probability of detecting HeV.
Finally, the finding that equine submissions with both neurological and respiratory clinical signs are more likely to test positive for HeV is consistent with previous findings [Reference Marsh30], and informs relative clinical risk assessment. However, the detection of HeV in horses with neither neurological nor respiratory signs (albeit less frequently) poses an exposure-risk management challenge for attending veterinarians and laboratory staff, reinforcing animal health authority recommendations that appropriate risk management strategies are employed for all sick horses and for anyone handling sick horses or derived biological samples.
CONCLUSION
We sought to identify trends in equine HeV submission, testing and detection rates, and submission and horse-level attributes associated with HeV detection. The marked increase in submissions from July 2008 onwards undoubtedly reflects, in large part, the broadening of the clinical case definition. The trend line for submissions post-2008 has increased steadily, likely reflecting enhanced public awareness; peaks in submissions and visitations to the DAF HeV webpage are clearly associated with reported incidents, indicating that risk perception is heightened at these times. The significantly differing between-year HeV prevalence in north and south QLD suggests a fundamental difference in risk exposure between the two regions that warrants further investigation. The association between HeV detection and stockhorse type (typically paddocked at night) suggests that husbandry may be a more important risk determinant than breed per se. The finding that horses with both neurological and respiratory clinical signs are more likely to be HeV-positive informs relative clinical risk assessment; however, the detection of HeV in horses with neither neurological nor respiratory signs, albeit infrequent, poses a risk-management challenge for attending veterinarians and laboratory staff, reinforcing animal health authority recommendations that appropriate risk-management strategies be employed for all sick horses, and by anyone handling sick horses or associated biological samples.
While the study focused on HeV, the approach and issues have broader relevance to emerging disease surveillance in the context of drivers for laboratory submissions, and particularly the likely growing impact of social amplification with evolving social media and mainstream media platforms.
ACKNOWLEDGEMENTS
The authors gratefully acknowledge the staff of Biosecurity Sciences Laboratory, Biosecurity Queensland, and the Queensland Department of Agriculture and Fisheries, especially Dr Louise Jackson (BSL Manager) who facilitated access to the BSL equine submission data, Mr Chris Hollingdrake (Media and Communications Officer) who provided data on the Department's Hendra virus webpage visits, and Dr Binendra Pratap (Senior Veterinary Officer) and Mr Perry Jones (District Biosecurity Inspector) for information on Hendra virus incidents and equine cases. This research was partly funded by the State of Queensland, the State of New South Wales and the Commonwealth of Australia under the National Hendra Virus Research Program.
DECLARATION OF INTEREST
None.


