

What Is a Shale Play?
The oil and gas shale plays in the lower 48 states have been identified across the country, concentrated between the Rocky Mountains and the Appalachians (Figure 1). A “play” is a set of known or postulated oil and/or gas accumulations sharing similar geologic, geographic, and temporal properties such as source rock, migration pathways, timing, trapping mechanism, and hydrocarbon type (Biewick, Gunther, and Skinner, Reference Biewick, Gunther and Skinner2002). These plays have produced a significant amount of oil and gas supply through the use of horizontal drilling and hydraulic fracturing. The technology has been around since the 1950s but wasn’t recognized as a way to profitably produce natural gas until the Barnett Shale in North-Central Texas and results in the Fayetteville Shale in Arkansas (EIA, 2011). The rapid development of shale plays resulted in an influx of people to these areas, most notably Utica, Marcellus, Bakken, and Eagle Ford (Figure 1). Significant infrastructure build out paralleled and in most cases had to accelerate past the rate of the well development. Many of these plays are in rural areas with very little infrastructure to support the rapid pace of development. With each new well came damaged roads, more trains and trucks, electricity needs, housing needs, restaurants, and commercial development, and the list goes on and on. Not only were these small towns ill-equipped to handle the influx of people and equipment but neither was the electric system, and significant—and rapid—development needed to occur as a result.

Figure 1 U.S. EIA Lower 48 States Shale plays (available at http://www.eia.gov/oil_gas/rpd/shale_gas.pdf).
Bakken Case Study
One of my favorite stories coming out of the work we did in the Bakken was from a coworker who was working onsite with the electric cooperative in a large, blue trailer set up in the cooperative’s parking lot that served as an office for the cooperative and its contractor’s staff. They were there in January, and it was 25 below zero one morning when the power in the trailer went out—and the temperature started to drop with no heat to warm them. Our project manager then walks quickly down the hall of the trailer toward my coworker’s office and stands at the door,pointing at her saying “That’s why we’re here!” It really was about keeping the lights and the heat on for the residents served by this cooperative that are suddenly in the middle of one of the largest known largest known reserves of crude in North America.
Many of the news stories didn’t speak much about the power shortages and needs that come with development like what was happening in the Bakken. Typical growth prior to the “boom” was 1 to 2 percent annually. These were rural towns in the Bakken that didn’t change much as far as electricity needs. Williston, North Dakota, is a great example of one of these towns. In 2010 the population was just 14,716 people (U.S. Census Bureau, 2015). According to the Bismarck Tribune, the mayor last year estimated the service population of the Williston area was around 50,000 people (including workers who come in and out of the region; Wood, Reference Wood2014).
When you have an influx of people and electric loads from industrial growth, you need electricity. Figure 2 below shows the most recent load forecasts for one of our clients in the Bakken. One can see how each year the forecast has changed significantly. This happens due to the difficulty in determining what loads to predict as the utility must get this information from the developers, and given the competitive nature of these shale plays, there’s a reluctance to share too much, too fast. Transmission planners are constantly adjusting these forecasts and in turn, having to identify the appropriate investments for the utility to meet the ever-increasing demands associated with the oil development. These demands weren’t only due to wells but also industrial, commercial, and residential development that was occurring as a result of the boom. These large new loads, sometimes as large as 30 megawatts, would develop quickly and would just as quickly change well-laid plans. To understand how much load 30 megawatts represents, if you were to measure by number of homes, you could serve approximately 30,000 homes. As a result, the transmission system in this rural area changed significantly and rapidly.
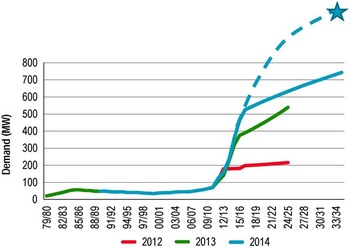
Figure 2 Bakken load demand forecast as of October 6, 2014.
As Figure 3 shows, much of the cooperative’s transmission system was 69 kV prior to the boom and 60 years old. Afterward, their system had to be “bulked up” to address the loads in the region and their system went from having one mile of 115 kV to over 215 miles.

Figure 3 Miles of transmission constructed for one cooperative in the Bakken as of October 6, 2014.
Additionally, to support the line infrastructure, several substations also needed to be constructed. As one can see in Figure 4 below, both the number of substations and their capacity increased by over 500% over 7 years and is projected to increase an additional 119% over 2014 numbers in 2016.

Figure 4 Substation capacity of one cooperative in the Bakken as of October 6, 2014. Represents both total MVA as well as the number of substations constructed.
Environmental and Permitting Impact
With all these changes occurring to the electrical grid, the permitting and environmental due diligence for these lines was equally challenging and dynamic. It was also a significant culture shift for the cooperatives in the region. It’s important to understand that in this part of the country there’s little federal land in North Dakota, which means there are few approvals for transmission line infrastructure. Federal lands that are present are easement lands held by agencies such as the U.S. Fish and Wildlife Service (USFWS) and the Natural Resources Conservation Service. As a result, much of the permitting done for these projects is done locally with the zoning boards. State level permits are rare since Public Service Commission approvals are only required for transmission lines over 200 kV. Many of the permitting organizations we worked with were understaffed for the volume of work coming through the doors.
The county zoning process in one of the most heavily developed areas is indicative of the change in regulatory attitudes in the state through the boom. Prior to 2011 there was typically no permitting completed by the electric cooperatives for zoning, road approach permits (unless on a state or federal highway), storm water permits, or utility crossing permits. Additionally, verbal permission from landowners was acceptable to start construction and easements were secured at some point by the utility. By late 2011 and into 2012, approach permits for county roads were completed and utility permits were obtained. Additionally, easement or purchase agreements were secured by the cooperative before construction was allowed to start on-site. Zoning approvals and storm water permits were still not required for substation construction. By 2013, the county required Conditional Use Permits (CUP) for zoning of substations. Through the permitting of the first few substations, we found the CUP requirements would change every 4-6 months. Additionally, the zoning process would take 3 to 4 months. As the pressure of the increasing volume of approvals grew, the county started denying CUP permits for missing data due to their changing requirements toward the latter half of 2014; the zoning process timing increased to 4 to 7 months due to meetings filling up. The county is also behind in providing written approvals for construction. In the last quarter of 2014 into the first quarter of 2015, HDR has been working with our client to move substations to an allowed use versus a CUP (Smith, Reference Smith2015).
Environmental issues were relatively unknown to the cooperatives prior to the boom. As a result, HDR had to work with them to identify a way to minimize their risk while addressing key issues in the area. While wetlands are ubiquitous in the prairie pothole region these projects lie in, the main environmental issue that arose for the cooperatives was the endangered whooping cranes. All the new transmission lines that were constructed in the Bakken are in the spring and fall migration habitat for endangered whooping cranes (Figure 5).

Figure 5 Whooping crane migration corridor in relation to the Bakken shale play.
Consultation with the USFWS was challenging given the volume of projects across their desks and a focus on oil and gas infrastructure. HDR developed a critical issues analysis and line marking plan to help the cooperatives understand their risks to their projects and where potential permitting was needed. While these documents were initially sent to the USFWS, their objective was to advise the cooperatives of their risks and help identify where bird flight diverters were needed by following the 2010 USFWS Guidelines (USFS, 2010). Due to the relatively homogeneous nature of the project area, the memos became duplicative, and were not very useful to the client. At this point, the environmental staff began working more closely with the engineering staff, to identify which spans were appropriate for marking during the planning process, and providing them directly with CAD and GIS data of these spans (Schubbe, Reference Schubbe2015).
Conclusions
Working in dynamic environments such as the shale plays requires creativity and flexibility to help manage risk for all parties. These environments are stressful for all parties and change management is important for identifying solutions to the communication and timing issues you’ll inevitably have. Additionally, understanding that regulators in these situations are largely understaffed could help lead to productive conversations up front about hiring and funding an industry/project-specific staff person to process your needs quickly. However, this takes a lot of up-front planning and a commitment of money that cooperatives may have difficulty justifying given the variety of unknowns that result in the development of infrastructure in these shale plays.
Acknowledgements
Thanks to Kirk Dewey and Matt Smith for their data and on the ground experiences. Also thanks to Kirk, Jon Schubbe, Kelly Garvey, and James Gregory for their respective reviews of this extended abstract.


