Health benefits have been associated with plant-based dietary patterns; however, the mechanisms by which plant foods promote health are not entirely clear( Reference Rajaram and Sabate 1 ). Long-term vegetarian diets are associated with reduced mortality( Reference Orlich, Singh and Sabaté 2 ) and incidence of CVD( Reference Crowe, Appleby and Travis 3 ). Furthermore, increased adherence to a vegetarian diet has demonstrated greater risk reduction for chronic diseases( Reference Tonstad, Butler and Yan 4 ). Vegetarian diets are typically higher in fruits, vegetables, legumes, soya, whole grains, nuts and seeds and lower in animal products, refined grains and non-water beverages compared with omnivorous diets( Reference Orlich, Jaceldo-Siegl and Sabaté 5 ). Phytochemicals, dietary fibres and several micronutrients are abundant in whole grains, soya, nuts, fruits and vegetables( Reference Alissa and Ferns 6 ). These foods represent common staples of a plant-based diet, and thus may contribute to the health benefits observed in vegetarian populations( Reference Tonstad, Butler and Yan 4 , Reference Craig 7 ).
Polyphenols are the largest group of phytochemicals in the plant kingdom, with over 8000 known phenolic structures and several hundred concentrated in edible plants( Reference Pérez-Jiménez, Hubert and Hooper 8 ). Major sources of polyphenols include fruits and vegetables, coffee, cereal grains, soya, tea, red wine and cocoa. In plants, phenolic compounds are products of secondary metabolism and play many physiological roles including UV protection, pigmentation and defence against micro-organisms( Reference Del Rio, Rodriguez-Mateos and Spencer 9 ). These phenolic compounds can be classified according to their complexity and chemical structure into one of five major classes, including flavonoids, phenolic acids, lignans, stilbenes and other polyphenols (e.g. alkylphenols, curcuminoids, tyrosols). Owing to their biological activity, it is possible that phenolics in general or perhaps one or more of the classes of phenolic compounds contribute to the protection offered by plant-based diets against mortality and disease risk. It is therefore important to understand the relative intakes of total polyphenols and individual phenolic classes from foods among different diet patterns in order to elucidate the mechanisms behind the observed health benefits of plant-based diets.
Only limited research has focused on the influence of diet pattern on the level of polyphenol intake( Reference Zamora-Ros, Knaze and Luján-Barroso 10 ). Polyphenol intakes in various European regions( Reference Brat, Georgé and Bellamy 11 – Reference Tennant, Davidson and Day 14 ) have been examined, but a comprehensive comparison of polyphenol intakes of a US cohort consuming a range of meatless to omnivorous diets has not been previously reported. The aims of this study were to characterise polyphenol intake by dietary pattern and plant source and to explore relative intakes of the major classes of polyphenols.
Methods
Study population
The Adventist Health Study-2 (AHS-2) is comprised of over 96 000 participants enrolled during February 2002 to May 2007, where 62 500 are females and 25 500 are black. Participants were recruited from English-speaking congregations in the USA and Canada, including Caucasian, African-American and Caribbean, Latino and Asian members. The AHS-2 cohort is unique in that participants have a wide range of dietary patterns, where 8 % are vegan, 28 % are lacto-ovo-vegetarian, 16 % are semi- or pesco-vegetarian and 48 % are non-vegetarian. In addition, there is substantial diversity in the types of plant foods consumed by this study population, including soya foods, grains, legumes and nuts. A full description of the AHS-2 is provided elsewhere( Reference Butler, Fraser and Beeson 15 ). Of the 96 469 participants of the AHS-2 cohort, there were 77 685 with currently processed and usable dietary intake data. Individuals with extreme energy intakes of <2092 kJ/d (<500 kcal/d) or >18 828 kJ/d (>4500 kcal/d) (n 211) were excluded; from the remaining cases, those with implausible dietary data (n 33) were also excluded. The present analysis included 77 441 participants from the AHS-2 cohort (mean age 57·1 years, 65 % female) (see Fig. 1). Participants with missing data on sex (n 26), race (n 818) or BMI (n 1966) were excluded when these variables were covariates in ANCOVA models.
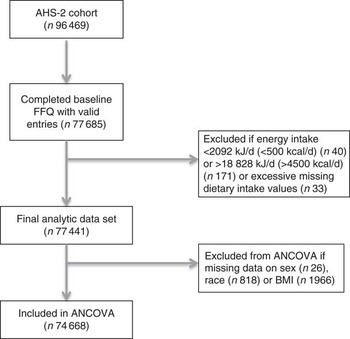
Fig. 1 Study design and flow chart. AHS-2, Adventist Health Study-2.
Assessment of demographic and lifestyle information
At baseline and follow-up, each participant completed a fifty-page, self-administered AHS-2 questionnaire that aimed to assess diet, physical activity, reproductive history, supplement use and medical history( Reference Butler, Fraser and Beeson 15 ). Participants were asked to report their weight and height in the baseline questionnaire, and these values were used to calculate BMI. Physical activity status was based on the average number of hours per week spent engaging in energetic physical exercise combined with physical activity level at work. Participants self-identified race, and those reporting black/African-American, West Indian/Caribbean, African or other black were considered as black and all others were considered as non-black for this analysis.
The food frequency section is a twenty-two-page instrument containing a food list of 204 hard-coded items, write-ins for thirty-nine open-ended items and questions about food preparation methods. The survey provides information on food item, frequency of consumption (seven to nine categories) and portion size (standard, half or less or one and a half or more), which are necessary to estimate mean daily food and nutrient intakes. The questionnaire was mailed to participants and then returned to AHS-2, where responses were reviewed and incomplete information was clarified by telephone follow-up. Dietary pattern refers to the distinct dietary practices of vegans, lacto-ovo-vegetarians, pesco-vegetarians, semi-vegetarians and non-vegetarians as classified by FFQ data. AHS-2 has characterised diet according to the level of animal product intake( Reference Orlich, Singh and Sabaté 2 ): vegans consumed eggs, dairy products, fish and all other meats less than once per month; lacto-ovo-vegetarians consumed milk and/or eggs at least once per month but red meat, fish or poultry less than once per month; pesco-vegetarians consumed fish (but not only fish) at least once per month but red meat or poultry less than once per month; semi-vegetarians consumed red meat, poultry and fish less than once per week but more than once per month; and non-vegetarians consumed red meat, poultry and fish more than once a week. Questionnaires were scanned using the Nilson Candle Scanner 5000i Image Scanner with ScanTools Plus software (Pearson NCS). The FFQ has been validated previously using a total of six 24-h dietary recalls collected from AHS-2 calibration study participants – one set of three during the first 2 months and the second approximately 6 months later( Reference Jaceldo-Siegl, Knutsen and Sabate 16 ). To address research ethics, the study was conducted according to the Declaration of Helsinki, and approval for the AHS-2 study was obtained from the Loma Linda University Human Subjects Committee Institutional Review Board. Written informed consent was obtained from all AHS-2 participants upon enrolment; their confidentiality is protected as secondary data contain no subject identifiers.
Polyphenol food composition data
Polyphenol content of foods in the AHS-2 cohort was generated using a combination of all currently available data on polyphenol concentrations in foods derived from chromatography analysis. The concentrations of polyphenols in various foods were gathered from the Phenol-Explorer 3.6 database( Reference Neveu, Perez-Jimenez and Vos 17 ) and the US Department of Agriculture (USDA) flavonoid and( Reference Bhagwat, Haytowitz and Holden 18 ) the USDA isoflavones( Reference Bhagwat, Haytowitz and Holden 19 ) databases. Individual literature was consulted for polyphenol concentrations of a select few foods including okra( Reference Arapitsas 20 ), rice flour( Reference Nakamura, Kayahara and Tian 21 ), oat bran, millet and wheat bran( Reference Mattila, Pihlava and Hellström 22 ). Rather than relying exclusively on the existing Phenol-Explorer database, we chose to expand these data in order to thoroughly capture phenolic intake from important ingredients consumed by our population that are not presented in Phenol-Explorer. Our complete database is comprised of approximately 78 % of data from Phenol-Explorer, 21 % from USDA databases and 1 % from individual studies. Phenol-Explorer was the primary consulting database, because concentrations of all measured polyphenol classes are provided for each food and most of them are presented as glycosides and esters of compounds; USDA databases provide data only on flavonoids or isoflavones, usually reported as aglycones. The USDA isoflavones database provided data for a variety of soya foods, which was particularly necessary in order to comprehensively estimate polyphenol intake in the AHS-2. Data obtained refer to intact polyphenols (i.e. glycosides and esters) for most compounds, except for values obtained from analysis using chromatography after hydrolysis or from USDA databases. For foods that contain lignans and phenolic acids that are only detectable after hydrolysis (i.e. beans, olives and cereals), data obtained using chromatography after hydrolysis were also included. AHS-2 foods were carefully matched to the compiled polyphenol composition data based on the following guidelines: all foods with 0 or unknown polyphenol concentrations were assigned 0; recipes were separated according to individual ingredients; and when the polyphenol concentration of a processed food was not presented in Phenol-Explorer or USDA databases, the concentration of the raw food was used in its place. For quality assurance, values entered into the compiled database were checked for accuracy on three separate occasions by comparing entered values with the original source. Each food item or ingredient in the compiled database was assigned a Food ID and corresponding value of total polyphenols in mg/100 g. The data acquired were expanded to include calculation of recipes as well as estimations of missing values. When available, concentrations of separate polyphenol classes (i.e. flavonoids, phenolic acids, lignans, stilbenes and other polyphenols) were also collected, and these values were summed to determine total polyphenols from a food. However, this level of specificity was not available for all foods and ingredients reported in the FFQ, and therefore flavonoids or total polyphenols are the only available data for some foods. This is particularly true for polyphenol concentrations in foods derived from USDA databases, which only provide data on flavonoid and isoflavone content of foods. Certain food items and ingredients that may contain polyphenols reported in the AHS-2 FFQ were not found in existing databases or the literature, including cottonseed oil, wheat gluten, coconut milk and cola drinks, and thus polyphenol content of these foods is considered to be unknown. It is likely that phenolic content or consumption of these foods was minimal; thus, contribution of these foods to total polyphenol intake is considered minimal.
Estimating polyphenol intake
Total dietary polyphenol intake was estimated using the following formula: $\mathop{\sum}{P_{n} {\times}F_{n} {\times}G_{n} {\times}S_{n} } $
, where P=mg phenolic compounds/100 g of food
n
, F is the reported frequency of intake of food
n
, G the standard serving size of food
n
(g) and S the reported servings of food
n
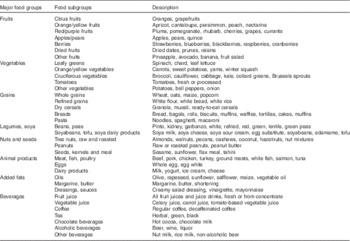
. Polyphenol food group variables were created to determine contributing food sources to total polyphenol intake. Each major and minor food group category is mutually exclusive so that the sum of polyphenol intake from all major food groups is equivalent to total polyphenol intake from the baseline FFQ. Table 1 defines each major and minor food group.
$\mathop{\sum}{P_{n} {\times}F_{n} {\times}G_{n} {\times}S_{n} } $
, where P=mg phenolic compounds/100 g of food
n
, F is the reported frequency of intake of food
n
, G the standard serving size of food
n
(g) and S the reported servings of food
n
. Polyphenol food group variables were created to determine contributing food sources to total polyphenol intake. Each major and minor food group category is mutually exclusive so that the sum of polyphenol intake from all major food groups is equivalent to total polyphenol intake from the baseline FFQ. Table 1 defines each major and minor food group.
Table 1 Polyphenol food groups, subgroups and foods within each category
Statistical analysis
Dietary patterns were compared according to demographic variables to determine relevant covariates. Percentiles (5th, 50th and 95th) of polyphenol intakes stratified by dietary pattern were examined. The variable total polyphenol intake was transformed using natural log and energy adjusted using the residual method for statistical analyses. ANCOVA was used to test whether mean polyphenol intakes were different between diet groups after adjusting for age, sex, race, BMI and physical activity level, with Bonferroni adjustment for multiple comparisons. A significant interaction between dietary pattern, coffee consumption and total phenolic intake (P<0·0001) was observed, and therefore a sub-group analysis between coffee consumers and non-consumers was conducted. Mean intake of polyphenols from various food groups as well as percentage contribution of each food group to total polyphenol intake were evaluated. For each dietary pattern, mean intakes of individual polyphenol classes (i.e. flavonoids, phenolic acids, stilbenes, lignans and other polyphenols) were also estimated. All the analyses were performed using IBM SPSS version 2.1 (SPSS Inc.).
Results
Total dietary polyphenol intakes
The 5th, 50th and 95th percentiles of total polyphenol intake for the cohort stratified by dietary pattern are reported in Table 2, provided in units of mg/d. The unadjusted mean polyphenol intake for the present study population was 801 (sd 775) mg/d. Significant differences in mean adjusted total polyphenol intakes were observed between dietary patterns (see Table 3). In the study population, 34 % of the participants reported coffee consumption in the FFQ. Among non-coffee consumers, the unadjusted mean polyphenol intake was 541 (sd 368) mg/d; vegans reported the highest intake of total polyphenols followed by pesco-vegetarians, lacto-ovo vegetarians, semi-vegetarians and non-vegetarians. The unadjusted mean intake for coffee consumers was 1370 (sd 1069) mg/d, with non-vegetarians reporting the highest intakes, followed by vegans, semi-vegetarians, pesco-vegetarians and lacto-ovo-vegetarians.
Table 2 Percentiles of unadjusted total polyphenol intake stratified by dietary pattern (Numbers and 5th, 50th and 95th percentiles)

Table 3 Estimated mean total dietary polyphenol intake (mg/d) in coffee consumers and non-coffee consumers in the Adventist Health Study-2 cohort stratified by diet patternFootnote * (Mean values and 95 % confidence intervals)

a,b,c,d Mean values within a column with unlike superscript letters indicate that pair-wise comparisons were significantly different (P<0·01).
* ANCOVA was used to determine differences in energy-adjusted total dietary polyphenol intake between diet groups with covariates age, sex, race, BMI level and physical activity level. Mean polyphenol intake was transformed using natural log and energy adjusted using the residual method for analysis; anti-logged means adjusted for energy and covariates are reported. Bonferroni adjustment was applied for multiple comparisons.
Food group contributions to total polyphenol intake
The contribution of major food groups to total polyphenol intake are reported in Table 4 as means (mg/d) and percentages of total polyphenol intake. As in other studies, coffee was identified as a major source of dietary polyphenols, but only for the AHS-2 participants who reported coffee consumption. The proportional contributions of food groups between coffee consumers and non-consumers are illustrated graphically in Fig. 2.

Fig. 2 Contribution (%) of food groups to total polyphenol intakes stratified by non-coffee consumers and coffee consumers. Mean phenol intakes from food groups contributing to total polyphenol intake are displayed. Other category includes grains, nuts and seeds, other beverages and animal products.
Table 4 Contribution of food groups to intake of polyphenols (Mean values and standard deviations)

Comparison of intakes of major polyphenol classes
Estimated intakes of the major polyphenol classes (i.e. flavonoids, phenolic acids, stilbenes, lignans and other phenolics) are displayed in Fig. 3. Across all dietary patterns, non-coffee consumers obtained higher mean levels of flavonoids than coffee consumers (305 (sd 238), 273 (sd 213) mg/d, respectively). The subclass flavonoids represented 69 % of total polyphenol intake in non-coffee drinkers and 21 % of the total for coffee drinkers. Conversely, the mean phenolic acid intake was higher in coffee consumers (986 (sd 1030) mg/d, 77 % of total polyphenol intake) compared with non-coffee consumers (125 (sd 106) mg/d, 28 % of total), and the mean phenolic acid intake of non-vegetarian coffee consumers (1061 mg/d) was higher than that of all vegetarian dietary patterns.
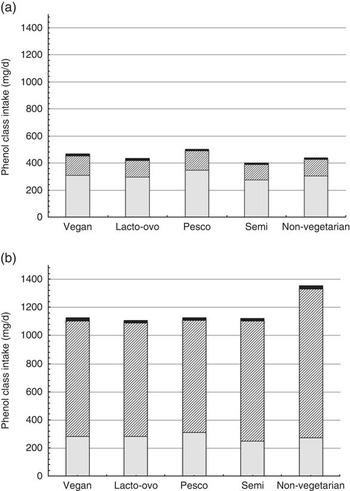
Fig. 3 Unadjusted mean intakes of phenol classes by dietary pattern (mg/d) among non-coffee consumers (a) and coffee consumers (b). ![]() , Flavonoids;
, Flavonoids; ![]() , phenolic acids;
, phenolic acids; ![]() , stilbenes, lignans, other phenolics.
, stilbenes, lignans, other phenolics.
Polyphenol intakes stratified by race
In the AHS-2 cohort, black participants had significantly lower mean energy-adjusted polyphenol intakes compared with non-blacks (665 (sd 532) v. 818 (sd 847) mg/d, respectively). However, sub-group analysis of non-coffee consumers revealed a higher mean energy-adjusted polyphenol intake among blacks (565 (sd 314) mg/d) compared with non-blacks (474 (sd 229) mg/d), and these differences were significant (P<0·001) after adjustment for age, sex and BMI (results not shown). Evaluation of polyphenol intake contributions from various food sources among non-coffee consumers revealed that mean polyphenol intakes were higher in blacks than in non-blacks from fruit juice (blacks, 221 (sd 312) mg/d, non-blacks, 112 (sd 167) mg/d), vegetables (blacks, 86 (sd 89) mg/d, non-blacks, 70 (sd 62) mg/d), red/purple fruits (blacks, 64 (sd 115) mg/d, non-blacks, 48 (sd 74) mg/d) and tea (blacks, 24 (sd 60) mg/d, non-blacks, 17 (sd 93) mg/d).
Discussion
This is the first study to assess polyphenol intakes by dietary pattern and food source among a large North American population. Previous studies on polyphenol intake were carried out in European cohorts( Reference Grosso, Stepaniak and Topor-Mądry 12 , Reference Ovaskainen, Törrönen and Koponen 23 – Reference Gonzalez, Fernandez and Cuervo 25 ), or focused only on the flavonoid class of polyphenols( Reference Zamora-Ros, Knaze and Luján-Barroso 10 , Reference Chun, Chung and Song 26 ). As the other polyphenol classes have demonstrated biological activity as well, it is important to also explore total polyphenol intake and the relative contributions of phenolic acids, stilbenes, lignans and other phenolics to total intake. The present study offers useful insight regarding the relationship between several plant-based diets and intake of total polyphenols as well as individual polyphenol classes.
European studies that evaluated dietary polyphenol intakes reported means ranging from 326( Reference Gonzalez, Fernandez and Cuervo 25 ) to 1193 mg/d( Reference Pérez-Jiménez, Fezeu and Touvier 13 ).This represents great variability, and the differences may be due to dietary diversity in study populations and different nutritional assessment methods. The main sources of polyphenols in European studies are coffee, red wine, tea and fruits, with means up to 1000 mg/d coming from coffee( Reference Grosso, Stepaniak and Topor-Mądry 12 ). Although polyphenol intake from fruits in the AHS-2 cohort (139 (sd 149) mg/d) was comparable with that of other studies (48·3–206 mg/d)( Reference Pérez-Jiménez, Fezeu and Touvier 13 , Reference Ovaskainen, Törrönen and Koponen 23 ), mean phenolic intakes from other concentrated sources (e.g. coffee and red wine) were substantially lower in our population. In European cohorts, coffee drinkers comprised approximately 83–92 %, alcoholic beverage consumers 75–96 % and tea drinkers 52–97 % of subjects( Reference Grosso, Stepaniak and Topor-Mądry 12 , Reference Pérez-Jiménez, Fezeu and Touvier 13 , 27 ). Along with avoidance of meat consumption, it is an Adventist custom to abstain from caffeine and alcohol. Therefore, the AHS-2 cohort has relatively low coffee, tea and alcoholic beverage intakes, where only 34, 37 and 4·6 % of the cohort consumed these items, respectively( Reference Orlich, Jaceldo-Siegl and Sabaté 5 ). The present study revealed that coffee contributes 35 %, tea contributes 3 % and alcoholic beverages contribute <1 % to total polyphenol intake. Interestingly, non-vegetarians comprise 70 % of the coffee-drinking sub-group, suggesting that coffee consumption may accompany reduced compliance with traditional Adventist dietary practices. As coffee is such a concentrated source of phenolic compounds (214·85–280·84 mg/100 ml), it is feasible to obtain 1000–1500 mg polyphenols/d from just three to four 6 oz servings of coffee. However, as a relatively small percentage of the AHS-2 cohort drinks coffee, mean polyphenol intake for this population is perhaps lower than that expected, considering that half of the participants consumed a plant-based diet. Nonetheless, the overall mean polyphenol intake of the cohort (801 mg/d) is comparable with other populations, and the mean intake for the coffee-consuming sub-group (1370 mg/d) is higher than that reported in other studies( Reference Brat, Georgé and Bellamy 11 – Reference Pérez-Jiménez, Fezeu and Touvier 13 ).
Substantial differences in the intakes of a wide variety of plant foods have been previously observed for vegetarian diet patterns( Reference Orlich, Jaceldo-Siegl and Sabaté 5 ), and thus it is expected that mean polyphenol intakes also vary. Certain foods are concentrated sources of a particular class of polyphenols. For example, fruits and vegetables are good sources of flavonoids, whereas coffee and whole grains contain particularly high concentrations of phenolic acids. In the AHS-2 cohort, vegetarians consumed greater amounts of fruits, vegetables and soya foods( Reference Orlich, Jaceldo-Siegl and Sabaté 5 ). Consistent with this, we observed the highest flavonoid intakes in the vegetarian dietary patterns. Mean intake of flavonoids was greatest in pesco-vegetarians, followed by vegans. Although vegans consumed greater amounts of fruits and vegetables compared with other dietary patterns, pesco-vegetarians’ intake of fruits and vegetables was the second highest and their intake of fruit juices was higher than that of all other dietary patterns( Reference Orlich, Jaceldo-Siegl and Sabaté 5 ); thus, their greater flavonoid intake is reasonable. Intake of legumes and soya was also highest among vegans and pesco-vegetarians compared with other dietary patterns( Reference Orlich, Jaceldo-Siegl and Sabaté 5 ). Legumes( Reference Bazzano and Winham 28 ) and soya( Reference Messina and Messina 29 ) have previously been associated with various health benefits, and represent good dietary sources of phenolic acids and isoflavones, respectively. Our findings demonstrate that legumes and soya contribute 13·8 % to total polyphenol intake for non-coffee consumers and 5 % for coffee drinkers. In the coffee-drinking sub-group, phenolic acids comprised the dominant group of polyphenols consumed (77 % of total intake) and were the greatest source of variation across dietary patterns. It may be expected that a non-vegetarian diet, which includes meat and other animal products that tend to displace plant foods, would result in reduced phenolic intake. However, the greater frequency and volume of coffee intake among non-vegetarians and the high concentration of phenolics in coffee contributed to non-vegetarians’ increased polyphenol intake. Despite being a rich source of phenolic acids, coffee lacks the diversity of nutrients found in other plant foods, which not only contain polyphenols, but also many vitamins (e.g. vitamins C and E), other phytochemicals (e.g. carotenoids) and dietary fibre. These added nutrients offer additional health benefits, representing a possible advantage of the consumption pattern observed for non-coffee drinkers in this study. Although previous research has indicated health benefits from moderate coffee intake, extreme coffee intake may be harmful( Reference George, Ramalakshmi and Mohan Rao 30 , Reference Jacobs, Haddad and Lanou 31 ). Nonetheless, given the significant contribution of coffee to dietary polyphenol intake in our Adventist cohort and the popularity of coffee in the non-Adventist culture, further evaluation of this food product alone might offer insight to benefits of phenolic acids.
Limitations of this study include the inability to adequately characterise or quantify the polyphenol content of some foods. Certain food items and ingredients present in the AHS-2 FFQ that may contain polyphenols were not found in existing databases or reliable literature because consistent analytic methods are currently unavailable. Among these foods are cottonseed oil, wheat gluten, coconut milk and cola beverages. The potential contribution of these foods to total polyphenol intake in our study was likely minimal because of low overall consumption or low phenolic concentration. In addition, data on some foods known to contain high polyphenol concentrations, such as chocolate, herbs and spices, were limited because of lack of reporting by our cohort or inadequacy of the FFQ to capture intake of these foods. Finally, data on processed foods were unavailable for certain food items, which is important because of known gains or losses in polyphenol concentrations due to processing. Substitution of the corresponding raw food in our analysis possibly resulted in underestimation or overestimation of polyphenol intakes from the consumption of processed foods.
In conclusion, this study provided a comprehensive description of polyphenol intake in a large cohort of Adventists. Our results are consistent with European studies that have identified coffee, fruits and fruit juices as major sources of polyphenol intake. Vegans and pesco-vegetarians had the highest mean polyphenol intakes among non-coffee consumers, and the relative food group contributions to total polyphenol intake among this subgroup are more consistent with current dietary recommendations, which include an emphasis on increased consumption of fruits, vegetables and legumes( Reference Jacobs, Haddad and Lanou 31 ). Coffee consumers were more likely to be non-vegetarians, and to some extent our results suggest that phenolic intake corresponds to coffee consumption. Polyphenols may prove to be an important component of plant-based diets that contribute to disease prevention and positive health outcomes. Furthermore, because of the potential impact on nutritional epidemiology, evaluating polyphenols from specific food sources warrants further study.
Acknowledgements
The authors thank Andrew Mashchak, Statistical Programmer Analyst, Adventist Health Studies, School of Public Health, Loma Linda University for programming the polyphenol food composition data.
This work was supported by National Cancer Institute grant no. 1U01CA152939. The funding agencies had no role in the design and analysis of the study or in the writing of this article.
The authors’ responsibilities were as follows – N. B.-C., K. J.-S., S. R., E. H. and G. E. F. designed the study, provided input on data interpretation and analysis; G. E. F. gathered specimens and was responsible for funding; N. B.-C. analysed the data and wrote the paper. All the authors read and approved the final version of the manuscript.
The authors declare that there are no conflicts of interest.