


Introduction
The Mesozoic Era witnessed the rise of tetrapods as dominant components in marine ecosystems (Kelley and Pyenson Reference Kelley and Pyenson2015). The emergence of a diverse assemblage of marine reptiles in the Triassic marked the establishment of ecosystem complexity on a par with modern oceans (Fröbisch et al. Reference Fröbisch, Fröbisch, Sander, Schmitz and Rieppel2013; Liu et al. Reference Liu, Hu, Rieppel, Jiang, Benton, Kelley, Aitchison, Zhou, Wen, Huang, Xie and Lv2014). During faunal recovery following the devastating Permo-Triassic mass extinction (PTME), sauropterygians, ichthyosaurs, and thalattosaurs diversified within the marine realm, creating and filling trophic niches that had not been widely exploited in the Paleozoic (Benton et al. Reference Benton, Zhang, Hu, Chen, Wen, Liu, Huang, Zhou, Xie, Tong and Choo2013). Although most marine reptile lineages disappeared in the Late Triassic, secondary Jurassic and Cretaceous radiations occurred among the surviving plesiosaurs and parvipelvian ichthyosaurs (Motani Reference Motani2005; Benson et al. Reference Benson, Evans and Druckenmiller2012). Other independent invasions of the oceans by thalattosuchian crocodylomorphs, marine turtles, and mosasaurs in the Jurassic and Cretaceous meant that reptiles remained at the apex of marine ecosystems throughout the entire Mesozoic (Young et al. Reference Young, Brusatte, Ruta and De Andrade2010; Benson and Butler Reference Benson and Butler2011; Polcyn et al. Reference Polcyn, Jacobs, Araújo, Schulp and Mateus2014).
The PTME devastated preexisting biotas, and the subsequent Triassic biotic recovery has been recognized as an exceptional period in the diversification of life (Chen and Benton Reference Chen and Benton2012). The rise of marine reptiles as an adaptive assemblage is considered one of the most significant components of this recovery (Liu et al. Reference Liu, Hu, Rieppel, Jiang, Benton, Kelley, Aitchison, Zhou, Wen, Huang, Xie and Lv2014; Motani et al. Reference Motani, Chen, Jiang, Cheng, Tintori and Rieppel2015a). Numerical studies show that marine reptile species diversity first peaked in the Anisian, just 10 Myr into the Triassic (Benson et al. Reference Benson, Butler, Lindgren and Smith2010; Benson and Butler Reference Benson and Butler2011). In addition, qualitative observations from the fossil record reveal that marine reptiles broadly diversified into a variety of trophic strategies in their first 20 Myr of evolution (Motani et al. Reference Motani, Chen, Jiang, Cheng, Tintori and Rieppel2015a). These included large-skulled macropredatory ichthyosaurs (Fröbisch et al. Reference Fröbisch, Fröbisch, Sander, Schmitz and Rieppel2013), small suction-feeding edentulous ichthyosauromorphs (Motani et al. Reference Motani, Jiang, Chen, Tintori, Rieppel, Ji and Huang2015b), shell-crushing placodonts (Neenan et al. Reference Neenan, Li, Rieppel, Bernardini, Tuniz, Muscio and Scheyer2014), long-necked and fanged nothosaurs (Rieppel Reference Rieppel2002), bizarre heterodont thalattosaurs (Benton et al. Reference Benton, Zhang, Hu, Chen, Wen, Liu, Huang, Zhou, Xie, Tong and Choo2013), and enigmatic apparent filter-feeders, such as Atopodentatus (Cheng et al. Reference Cheng, Chen, Shang and Wu2014). These disparate dietary habits were associated with an exceptional array of ecomorphological specializations, most linked to feeding and prey acquisition.
Recent research has emphasized that a broad-based ecological approach is essential for understanding marine reptile evolution (Motani et al. Reference Motani, Chen, Jiang, Cheng, Tintori and Rieppel2015a). Thus far, studies have focused on body-size trends and trophic web establishment in the first 5–10 Myr of the Mesozoic (Liu et al. Reference Liu, Hu, Rieppel, Jiang, Benton, Kelley, Aitchison, Zhou, Wen, Huang, Xie and Lv2014; Scheyer et al. Reference Scheyer, Romano, Jenks and Bucher2014), while others have examined the proportions of categorical ecomorphs and guilds through the whole Triassic (Benton et al. Reference Benton, Zhang, Hu, Chen, Wen, Liu, Huang, Zhou, Xie, Tong and Choo2013; Kelley et al. Reference Kelley, Motani, Jiang, Rieppel and Schmitz2014; Motani et al. Reference Motani, Chen, Jiang, Cheng, Tintori and Rieppel2015a). However, no study has examined whether the Triassic was truly a time of unusual trophic proliferation or whether the accumulated diversity of forms was any greater than at other points in the Mesozoic – was the first wave of marine reptile evolution in the aftermath of the PTME really exceptional? A robust quantitative approach is required to test this, and trends of marine reptile ecomorphological diversity through the whole Mesozoic must be quantified. In this study, we focus on two elements of phenotypic diversity. We quantify patterns of functional disparity in the jaws and dentition, focusing on the diversity of forms associated with feeding and prey acquisition (Anderson Reference Anderson2009; Anderson et al. Reference Anderson, Friedman, Brazeau and Rayfield2011; Stubbs et al. Reference Stubbs, Pierce, Rayfield and Anderson2013), and separately examine the diversity of skull sizes.
The transitions from land to sea in Mesozoic marine reptiles represent excellent case studies for exploring the macroevolutionary consequences of ecological opportunity. Invasion of new habitat opens up previously unexplored niche space and is considered one of the major ecological opportunities in nature (Schluter Reference Schluter2000). Such opportunities are the primary catalysts for bursts of phenotypic evolution and adaptive radiation (Simpson Reference Simpson1953; Yoder et al. Reference Yoder, Clancey, Des Roches, Eastman, Gentry, Godsoe, Hagey, Jochimsen, Oswald, Robertson, Sarver, Schenk, Spear and Harmon2010). Mesozoic marine reptiles are a polyphyletic assemblage, made up of species from independent evolutionary invasions of the marine realm from different parts of the neodiapsid tree (Bardet et al. Reference Bardet, Falconnet, Fischer, Houssaye, Jouve, Suberbiola and Vincent2014). These individual diversifications provide a chance to contrast patterns of evolution associated with the ascent of several distinct clades in response to the same ecological opportunity. As ecological opportunity drives adaptive radiation, one could hypothesize that niche filling or “early-burst” diversification patterns should be universal in marine reptiles. However, there are a number of confounding factors. For example, not all marine reptiles diversified simultaneously. Do clades originating in the immediate aftermath of major extinction events show similar trajectories and rates of evolution as those diversifying at times when there were no major biotic perturbations?
There are two commonly applied quantitative methods to identify the signatures of adaptive radiation in deep-time data. Most attention has focused on examining time-series trends of lineage diversity and morphological disparity (e.g., Erwin Reference Erwin2007; Ruta et al. Reference Ruta, Angielczyk, Fröbisch and Benton2013; Hughes et al. Reference Hughes, Gerber and Wills2013). When maximum numerical and morphological diversity is seen early in a clade’s history, this indicates early diversification and morphospace expansion and can be used to infer an adaptive radiation (Benton et al. Reference Benton, Forth and Langer2014). Recently, focus has switched to explicitly modeling evolutionary rates in ecologically relevant traits in a phylogenetic framework (e.g., Benson et al. Reference Benson, Campione, Carrano, Mannion, Sullivan, Upchurch and Evans2014). Under a model of adaptive radiation, rapid evolutionary rates are seen early in a clade’s history, and these decelerate through time, a trend formalized as the “early-burst” model (Harmon et al. Reference Harmon, Losos, Davies, Gillespie, Gittleman, Jennings, Kozak, McPeek, Moreno-Roark, Near, Purvis, Ricklefs, Schluter, Schulte, Seehausen, Sidlauskas, Torres-Carvajal, Weir and Mooers2010). Here, we use a comparative approach to explore trends of lineage diversity, functional disparity, skull-size diversity, and rates of evolution in the most diverse marine reptile clades to test the prediction of universal early high diversity and disparity and early burst.
Two major turnover events are believed to have significantly impacted Mesozoic marine reptile macroevolution. The first occurred during the Late Triassic, when species diversity crashed and whole clades and morphotypes disappeared, including placodont sauropterygians, nothosaurs, thalattosaurs, and all nonparvipelvian ichthyosaurs (Benson et al. Reference Benson, Butler, Lindgren and Smith2010; Benson and Butler Reference Benson and Butler2011; Thorne et al. Reference Thorne, Ruta and Benton2011; Kelley et al. Reference Kelley, Motani, Jiang, Rieppel and Schmitz2014). A second, less severe extinction interval has been posited for the Jurassic/Cretaceous boundary (Bardet Reference Bardet1994), although recent analyses show weak support for an exceptional loss of diversity, but point rather to a “thinning out” of major clades, such as thalattosuchians, pliosaurids, and cryptoclidid plesiosauroids (Benson and Druckenmiller Reference Benson and Druckenmiller2014). While these proposed extinction intervals are defined by losses of taxonomic diversity, they could also have had profound impacts on ranges of morphology and ecology exhibited by surviving taxa (Bapst et al. Reference Bapst, Bullock, Melchin, Sheets and Mitchell2012; Ruta et al. Reference Ruta, Angielczyk, Fröbisch and Benton2013).
Extinctions can be nonrandom and highly selective, with particular clades, ecologies, morphotypes, or adaptive zones being susceptible to biotic perturbations (Friedman Reference Friedman2009; Korn et al. Reference Korn, Hopkins and Walton2013). By dividing Triassic and Early Jurassic marine reptiles into broad ecotypes, Kelley et al. (Reference Kelley, Motani, Jiang, Rieppel and Schmitz2014) demonstrated that shallow-marine durophages were most susceptible to sea-level fluctuations during the Late Triassic, while pelagic forms were more resilient and able to avoid widespread extinction. Quantitative studies have focused on individual marine reptile clades. For example, Thorne et al. (Reference Thorne, Ruta and Benton2011) revealed a massive loss of ichthyosaur disparity during the Late Triassic/Early Jurassic transition, and showed that surviving taxa occupied different morphospace than Triassic forms. By expanding on this numerical approach and considering marine reptiles as an adaptive assemblage, we assess what ecomorphological traits are characteristic of extinction victims through the Mesozoic and test for evidence of infilling in vacant adaptive zones by different marine reptile groups.
Materials and Methods
■
Taxon Sampling
This study represents the largest comparative and quantitative investigation of phenotypic evolution in Mesozoic marine reptiles. In total, 206 marine reptile species are used to investigate trends of functional disparity in the jaws and dentition (Supplementary Data), and 354 species are included in the analyses of skull-size trends (Supplementary Data). Individual specimens represent each species, and taxa range in age from the Olenekian to the end Maastrichtian. Five monophyletic clades are included: the sauropterygians, ichthyosauromorphs, thalattosaurs, thalattosuchian crocodylomorphs, and mosasauroids. Additionally, we sample marine representatives from clade Testudinata, incorporating the stem turtle Odontochelys; Jurassic plesiochelyids; and the Cretaceous clade Chelonioidea. In the primary data set we also include a number of smaller clades and individual genera known to have inhabited Mesozoic marine environments: tanystropheids, saurosphargids, Helveticosaurus and Qianosuchus from the Triassic, and nonmosasauroid squamates from the Cretaceous. Late Jurassic pleurosaurids and Cretaceous marine snakes, dyrosaurids, and pholidosaurids were not included in the data sets, due to a lack of material. When testing for adaptive radiation based on time-series trends and evolutionary rates, investigation is focused on the five most diverse clades: Sauropterygia, Eosauropterygia (Sauropterygia minus Placodontia), Ichthyosauromorpha, Thalattosuchia, and Mosasauroidea. Separate analyses were performed for Eosauropterygia to account for the aberrant morphology of placodonts. Each of these clades could be effectively sampled on an individual basis in terms of both phylogenetic and stratigraphic coverage. The thalattosaurs, turtles, tanystropheids, and saurosphargids could not be incorporated into these comparisons because of smaller sample sizes and sporadic stratigraphic occurrences.
Functional Disparity
When examining functional disparity, focus is placed on quantifying the diversity of forms and innovations that have known ecomorphological and/or biomechanical consequences and are therefore directly associated with resource use and the acquisition and processing of prey (e.g., Anderson et al. Reference Anderson, Friedman, Brazeau and Rayfield2011, Reference Anderson, Friedman and Ruta2013; Stubbs et al. Reference Stubbs, Pierce, Rayfield and Anderson2013; Button et al. Reference Button, Rayfield and Barrett2014). Functional and/or biomechanical traits are primarily derived from the mandible and dentition. Figure 1 illustrates a range of marine reptile jaws, highlighting the great diversity of forms.
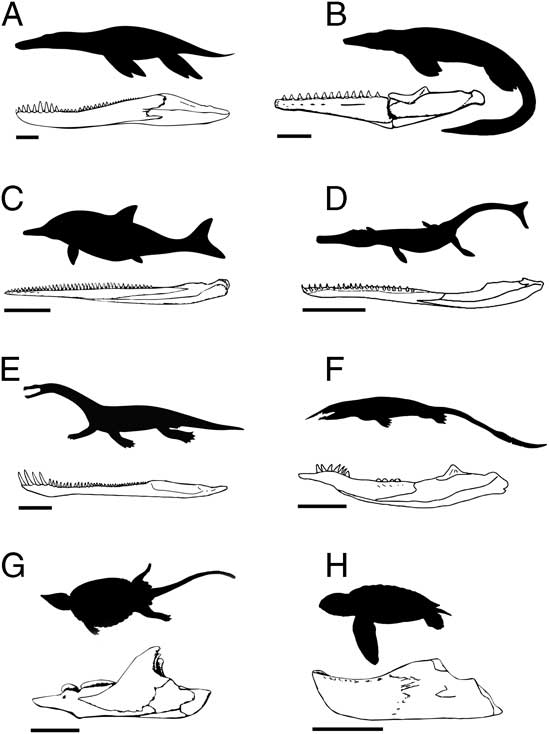
Figure 1 A sample of jaw functional morphotypes from the fossil record of Mesozoic marine reptiles. The illustrated taxa are (A) Pliosaurus, (B) Tylosaurus, (C) Ophthalmosaurus, (D) Metriorhynchus, (E) Nothosaurus, (F), Xinpusaurus, (G) Placochelys, and (H) Mesodermochelys. Scale bars on the jaw illustrations represent 20 cm (A–D) and 5 cm (E–H).
Here, functional disparity was assessed using a combination of continuous measured traits and discrete characters (Table 1). The nine continuous characters were measured for 206 jaws in the program ImageJ (Schneider et al. Reference Schneider, Rasband and Eliceiri2012). For consistency, all measurements were recorded digitally from photographs collected during museum visits, photographs provided by colleagues, figures sourced from published literature, and anatomical reconstructions. By recording all linear measurements digitally from two-dimensional images, we aimed to avoid potential discrepancies and distortions that could arise through collecting some data from direct measurements of three-dimensional objects and other data from two-dimensional images.
Table 1 Functional characters measured and scored for 206 Mesozoic marine reptile taxa. Detailed descriptions of all characters are provided in the Supplementary Text.

All but one of the nine discrete characters relate to dental features, which are often difficult to quantify with continuous variables but have considerable functional implications (Massare Reference Massare1987). Detailed descriptions of all characters are provided in the Supplementary Text, and raw data are provided in the Supplementary Data. The continuous functional characters (C1–9) were standardized using the z-transformation (so the mean character value was 0, with a standard deviation of 1) (Anderson et al. Reference Anderson, Friedman, Brazeau and Rayfield2011). Separate standardizations were used when analyzing the complete data set, incorporating all marine reptiles and subsets of the data for different clades.
Functional Morphospaces
Functional morphospaces were constructed using multivariate ordination techniques. The full data set, composed of z-transformed continuous variables and binary scores for all 206 marine reptile species, was used to calculate an intertaxon distance matrix based on Gower’s similarity coefficient (Gower Reference Gower1971). This similarity metric was selected because it does not have metric properties and can therefore be computed with mixed data types (continuous and discrete). The similarity matrix was analyzed using principal coordinates analysis (PCOa) to produce multivariate ordination axes summarizing major elements of phenotypic variation. The scores (coordinates) of the taxa on PC axes 1, 2, and 3 were used to construct morphospaces because these axes contribute the most to overall absolute variance. Only the first 11 axes were retained for statistical tests and disparity calculations, because higher axes were associated with negligible amounts of absolute variance (<1%) or negative eigenvalues (Table 2). To ensure that the presence of negative eigenvalues did not distort the ordinated dissimilarity among forms, we performed correlation tests on the computed intertaxon distances and ordination distances (Friedman Reference Friedman2012). Results show strong correlation between the distance measures (Pearson’s product-moment correlation: r=0.982, p<0.001), suggesting the PCOa accurately preserves most of the underlying distances between taxa without major distortion (Supplementary Fig. 1). Nonparametric multivariate analyses of variance (NPMANOVA) were carried out on the 11 retained PCOa axes to test for separation by temporal and group bins in morphospace (Ruta et al. Reference Ruta, Angielczyk, Fröbisch and Benton2013). The above-described procedures were repeated separately for each of the five major clades to generate multivariate axes of variation for subsequent disparity calculations in each group (see below).
Table 2 Eigenvalues and percentages of variance associated with each PCO axis from the multivariate analysis. The primary analysis is based on all 18 characters.
Temporal Disparity Calculations
Marine reptile disparity was quantified using the PCOa scores of taxa from the first 11 ordination axes (Table 2), based on the sum of variances and the sum of ranges metrics. To derive a trajectory of disparity through time, we performed calculations on taxa binned in 16 Mesozoic time intervals. The sum of ranges calculations were rarefied to account for differing sample sizes, using both the average sample size of all bins (n=17) and the smallest sample size (n=5). Statistical tests for differences in disparity between time bins are based on 95% confidence intervals, paired-sample t-tests based on multivariate variance (Anderson et al. Reference Anderson, Friedman, Brazeau and Rayfield2011), and ratios of marginal likelihoods for variance (Finarelli and Flynn Reference Finarelli and Flynn2007). Confidence intervals associated with calculated disparity values were generated by bootstrapping with 10,000 replications. Ratios of marginal likelihoods were used exclusively to identify shifts in disparity between successive time intervals based on the procedure outlined in Finarelli and Flynn (Reference Finarelli and Flynn2007) and Anderson et al. (Reference Anderson, Friedman, Brazeau and Rayfield2011). We assessed the statistical dependence between bin sample size and disparity by applying generalized differencing and assessing the strength and significance of correlations (e.g., Ruta et al. Reference Ruta, Angielczyk, Fröbisch and Benton2013). Partial disparity for each marine reptile group was also examined to see how they contribute to overall disparity through the Mesozoic (Foote Reference Foote1993). All disparity calculations and significance tests were performed using the MDA Matlab® package (Navarro Reference Navarro2003) and in R (R Development Core Team 2011).
Stratigraphic Binning
For temporal disparity calculations and morphospace plots, taxa were binned in 16 Mesozoic time intervals. We used a combination of stage-level and composite bins, with ages in Myr: Olenekian (250–247.1), Anisian (247.1–241.5), Ladinian (241.5–237), Carnian (237–228.4), Norian (228.4–209.5), Hettangian–Sinemurian (201.3–190.8), Pliensbachian–Toarcian (190.8–174.1), Aalenian–Bathonian (174.1–166.1), Callovian–Oxfordian (166.1–157.3), Kimmeridgian–Tithonian (157.3–145), Berriasian–Barremian (145–126.3), Aptian–Albian (126.3–100.5), Cenomanian–Turonian (100.5–89.8), Coniacian–Santonian (89.77–83.6), Campanian (83.6–72.1), and Maastrichtian (72.1–66). A Rhaetian bin was not included due to the lack of marine reptile fossils during this interval. Absolute ages for the stratigraphic stages are from Gradstein et al. (Reference Gradstein, Ogg, Schmitz and Ogg2012). The mean bin duration is 11 Myr and the range is 22.9 Myr.
Stratigraphic assignments were based on the primary literature, previous compendia of marine reptile diversity, and the Paleobiology Database (paleodb.org) (Benson et al. Reference Benson, Butler, Lindgren and Smith2010; Young et al. Reference Young, Brusatte, Ruta and De Andrade2010; Benton et al. Reference Benton, Zhang, Hu, Chen, Wen, Liu, Huang, Zhou, Xie, Tong and Choo2013; Kelley et al. Reference Kelley, Motani, Jiang, Rieppel and Schmitz2014). Species-level stratigraphic assignments were used in most cases, but in the disparity analyses there were a number of instances in which species could not be sampled in a time bin due to inadequately preserved material. In these cases, the stratigraphic range of a representative taxon belonging to the same genus was extended to account for that taxon’s absence (Supplementary Data). There were two instances in which taxa could not have their absence accounted for by a member of the same genus, both of them in the Norian time bin. Because it is important to represent all forms at a given time, we decided to represent their ecomorphological characteristics with a closely related species; we used Psephochelys polyosteoderma to represent the placodont species Psephoderma alpinum (and placodonts in general), and we used Guanlingsaurus liangae to represent the large edentulous ichthyosaur Shonisaurus sikanniensis.
Disparity Sensitivity Analyses
To scrutinize temporal trends of marine reptile disparity we performed sensitivity tests using alternative protocols and data subsets. First, disparity was recalculated based on within-bin mean pairwise dissimilarity from the original Gower intertaxon distance matrix for all 206 taxa (without PCOa ordination; e.g., Close et al. Reference Close, Friedman, Lloyd and Benson2015). Second, disparity analyses were undertaken based solely on the nine continuous functional metrics (C1–C9) measured across all taxa, to ensure that the calculated trajectory of marine reptile disparity through time was not simply the result of overwhelming dominance from binary characters. The ichthyosaur Thalattoarchon was removed, because it could not be scored for enough continuous characters. Because size can dominate data sets based on linear measurements and ratios, additional tests were run on eight continuous variables minus the character total mandibular length (C9). For both cases, the z-transformed continuous characters were converted into a variance-covariance matrix and subjected to principal components analysis (PCA) to derive multivariate ordination axes and the corresponding PC scores for all 205 taxa. Missing values were accounted for using iterative imputation with 10,000 bootstrap replicates (Ilin and Raiko Reference Ilin and Raiko2010). Seven ordination axes were retained from the nine-character analysis (accounting for 98.9% of variance), and six axes were retained from the analysis with size removed (accounting for 98.7% variance). Following the protocol discussed above, disparity based on the sum of variances and sum of ranges was calculated in the 16 Mesozoic time intervals.
Skull-Size Trends
To complement the disparity analyses, we also examined patterns of skull-size evolution in all Mesozoic marine reptiles. Skull size represents an ecomorphological characteristic that can be compared broadly across all marine reptile clades and used to identify patterns of phenotypic diversity. In 354 marine reptile species, maximum skull length (MSL) was measured from the anterior tip of the premaxilla to the posterior margin of the squamosal. Data were collected during museum visits and from published tables and figures (Supplementary Data). For incomplete specimens, MSL was estimated based on cranial proportions of closely related species or total mandible length (required for <5% of taxa). Juvenile specimens, identified based on discussions in the literature, were not included in the data set. Temporal trends of skull-size evolution were explored by plotting log10-transformed MSL against geological time based on the stratigraphic range midpoints of all species. Univariate disparity, based on the range and interquartile range, was examined in the same time bins as the multivariate disparity analyses.
Comparative Disparity and Diversity Analyses
To test whether all marine reptile clades have similar trajectories of disparity through time, we compared the temporal disparity profiles of sauropterygians, eosauropterygians, ichthyosauromorphs, thalattosuchians, and mosasauroids. These analyses were based on subsets of the primary data set (both continuous and binary characters). Some characters became redundant in the individual analyses and were removed, and the data subsets were then separately z-transformed and ordinated using PCOa. Taxa were assigned to new time bins covering the full duration of each clade (Supplementary Table 1). For each clade, disparity calculations were based on the binned PCOa scores of taxa from the ordination axes that accounted for more than 1% of absolute variance. The number of axes used for each clade is as follows: Sauropterygia (10), Eosauropterygia (11), Ichthyosauromorpha (7), Thalattosuchia (8), and Mosasauroidea (9). Once again, two disparity metrics were examined: the sum of variances and rarefied sum of ranges.
We also calculated phylogenetic diversity estimates (PDE) for each group to explore the pattern of numerical diversification (cladogenesis). PDE incorporate both taxon occurrences and ghost lineages inferred from time-calibrated trees. Diversity counts were made in 5 Myr intervals spanning the duration of each of the five groups. To account for phylogenetic uncertainty within each tree, unresolved nodes were randomly resolved and 100 trees were used to calculate PDE. The median of the 100 topologies was plotted along with confidence intervals based on two-tailed 95% lower and upper quantiles. Calculations were performed using the R package paleotree, Version 1.4 (Bapst Reference Bapst2012).
Time-scaled Phylogenies
Phylogenetic comparative methods were used to quantify the tempo and mode of phenotypic evolution in sauropterygians, eosauropterygians, ichthyosauromorphs, thalattosuchians, and mosasauroids. Informal composite supertrees were first constructed for each clade (see description in Supplementary Text and Supplementary Figs. 2–5). All trees had unresolved nodes, reflecting phylogenetic uncertainty. These nodes were randomly resolved prior to analyses, and to test for consistency, 50 alternative fully resolved topologies were retained for Ichthyosauromorpha, Thalattosuchia, and Mosasauroidea, while 100 topologies were analyzed for Sauropterygia and Eosauropterygia. Branch durations in all trees were estimated by assigning taxa a point age, drawn randomly from a uniform distribution between their first appearance dates (FAD) and last appearance dates (LAD). Absolute ages for FADs and LADs are from Gradstein et al. (Reference Gradstein, Ogg, Schmitz and Ogg2012) (Supplementary Data). Zero-length branches were lengthened by sharing duration equally with preceding non-zero-length branches, after setting a time of root divergence (equal method; Brusatte et al. Reference Brusatte, Benton, Ruta and Lloyd2008). Sensitivity analyses were conducted with enforced 1 Myr minimum branch lengths (mbl method; Laurin Reference Laurin2004). Finally, prior to analyses, the taxa in each fully resolved time-calibrated tree that lacked the appropriate trait data (see “Maximum-Likelihood Evolutionary Models” below) were removed. All dating procedures were implemented using the function timePaleoPhy in the R package paleotree, Version 1.4 (Bapst Reference Bapst2012).
Maximum-Likelihood Evolutionary Models
Maximum-likelihood models were fitted to trait data on the time-calibrated phylogenies for each marine reptile clade, using the R package Geiger, Version 1.99-3 (Harmon et al. Reference Harmon, Weir, Brock, Glor and Challenger2008). PC scores from axes of variation were used as continuous trait data to explore the tempo and mode of functional evolution in the jaws and dentition (e.g., Sallan and Friedman Reference Sallan and Friedman2012). The PC scores were taken from the separate multivariate analyses of each clade used to investigate disparity through time. Because no single ordination axis accounts for all functional disparity, we fitted models to multiple axes independently. The axes utilized, and their relative contributions to overall absolute variance, are: Sauropterygia PC1 (47.8%), PC2 (11.6%), and PC3 (5.7%); Eosauropterygia PC1 (30.5%), PC2 (13.7%), and PC3 (8.9%); Ichthyosauromorpha PC1 (28.5%), PC2 (21.1%), and PC3 (13.2%); Thalattosuchia PC1 (44.6%), PC2 (18.1%), and PC3 (10.2%); and Mosasauroidea PC1 (30.6%), PC2 (24.8%), and PC3 (10.5%). Skull-size trends were also explored utilizing the log10-transformed MSL data.
We focus on three models that explicitly test for rate heterogeneity in a temporal context; Brownian motion (BM), early burst (EB), and Pagel’s δ (delta). BM is a time-homogeneous process, equivalent to a random walk with constant variance and evolutionary rates per unit time. Under BM, increases and decreases in trait values are equiprobable, and trait covariance is proportional to the duration of shared ancestry. The EB model presumes higher rates of evolution early in a clade’s history and exponentially decreasing rates through time (Harmon et al. Reference Harmon, Losos, Davies, Gillespie, Gittleman, Jennings, Kozak, McPeek, Moreno-Roark, Near, Purvis, Ricklefs, Schluter, Schulte, Seehausen, Sidlauskas, Torres-Carvajal, Weir and Mooers2010). In EB, rates are constrained to exponential deceleration. BM and EB are the most commonly contrasted models when trying to identify the quantitative signatures of niche filling during adaptive radiation. Pagel’s δ is a time-dependent model that fits the relative contributions of early versus late evolution in a clade’s history by elaborating upon BM with an additional phylogenetic rescaling parameter “δ” (Sallan and Friedman Reference Sallan and Friedman2012). When Pagel’s δ<1, trait disparity and rapid morphological change are concentrated early in a clade’s history, mimicking early burst (Ingram et al. Reference Ingram, Harmon and Shurin2012). The sample size–corrected Akaike’s information criterion (AICc) and Akaike weights were used to identify the best-fitting model. The average and range of AICc values and Akaike weights from each analysis, based on the randomly resolved time-calibrated topologies, are reported, in addition to the relevant parameter values for favored models.
Results
■
Marine Reptile Morphospace
Marine reptile functional morphospace visualizes the phenotypic similarity of the sampled taxa based on the functional data from the jaws and dentition (Fig. 2). Statistical tests measuring the strength of association between the ordination axes and the functional characters are summarized in Supplementary Table 2. Here, discussion and visualization is limited to patterns on the first three multivariate coordinate axes.
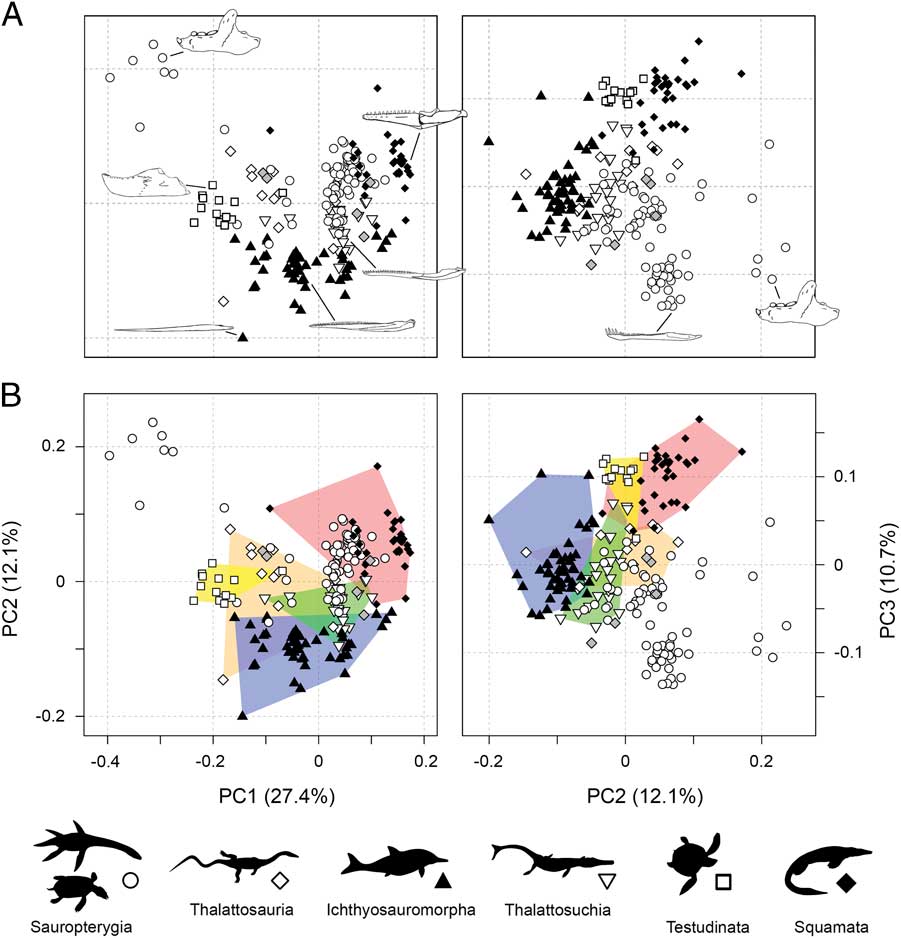
Figure 2 Empirical functional morphospaces showing the distribution of all marine reptile species and major groups. Two-dimensional plots of PCOa axes 1 and 2 and PCOa axes 2 and 3. The lower plots (B) represent the same axes but with major groups denoted by convex hulls. The gray filled diamonds denote an unrelated assemblage of Triassic marine reptiles. The illustrated jaws in PC1–PC2 plot are: Placodus (sauropterygian), Tylosaurus (mosasaur), Metriorhynchus (thalattosuchia), Ophthalmosaurus (ichthyosauromorph), Hupehsuchus (ichthyosauromorph), and Nichollsemys (turtle). The illustrated jaws in PC2–PC3 plot are: Placodus (sauropterygian) and Nothosaurus (sauropterygian).
Together, PC1–PC3 account for 50% of absolute variance and encapsulate many significant traits (Fig. 2). PC1 subsumes 27.4% of absolute variance and 34.7% of variation when only axes with positive eigenvalues are considered. PC1 is most heavily influenced by dental specializations. Taxa with high negative PC1 scores either possess tooth plates (placodonts), are entirely edentulous (e.g., turtles), or have bulbous crushing dentition (e.g., mixosaurid ichthyosaurs and thalattosaurs). Conversely, taxa with low positive PC1 scores have pointed and recurved tooth crowns, and those at the extreme positive end of PC1 have specialized cutting dentition (Massare Reference Massare1987). Most other characters also have strong association with positioning along PC1, with the notable exception of jaw depth, area for muscle attachment, and anterior mechanical advantage, suggesting there is marked variation in robustness and potential bite force along this axis. PC2 accounts for 12.1% of overall absolute variance and 15.3% of variation when only axes with positive eigenvalues are considered. Variation in mandibular robustness and mechanical advantage is strongly expressed on PC2. Taxa with moderate to high negative PC2 scores have very slender jaws, with restricted regions of attachment for the adductor muscles and low anterior mechanical advantage. Taxa with increasingly positive PC2 scores have progressively more robust jaws, with increased area for muscle attachment and higher anterior mechanical advantages. PC3 encapsulates a further 10.7% of absolute variance and 13.5% of variation from positive eigenvalues only. This axis appears to specifically isolate taxa with specialized dentition in the anterior part of the dentary, such as enlarged anterior fangs or procumbent chisel-like anterior teeth.
A number of noteworthy trends are evident from the distribution of marine reptiles in functional morphospace. Sauropterygians occupy an extensive area, but many forms cluster centrally (Fig. 2). The sauropterygians shown to be distinct from all other groups in PC1–PC2 morphospace are the highly specialized placodonts. Most ichthyosauromorphs have restricted morphospace occupation along PC2, with slender jaws and low mechanical advantages, but show wide distribution along PC1. Thalattosaurs are concentrated in areas of weakly negative PC1 scores, but a number of disparate forms branch out from this region. Turtles have restricted morphospace occupation, most likely due to lack of dental diversity (all edentulous, with the exception of Odontochelys) and similar geometric configuration of the mandible—generally robust with a small or absent retroarticular process. In both plots, most mosasauroids are concentrated together, potentially constrained by the presence of an intramandibular joint and unfused mandibular symphysis, together with moderately robust jaws and relatively high mechanical advantages. Thalattosuchians are positioned centrally in functional morphospace and show partial overlap with other clades, particularly the sauropterygians and ichthyosauromorphs. Tests for group separation in morphospace, based on NPMANOVA, return statistically significant results for all pairwise comparisons (Supplementary Table 3).
Mesozoic Marine Reptile Disparity
Marine reptile functional disparity was exceptionally high in the Middle and early Late Triassic, but following the Late Triassic extinctions, it took over 100 Myr to recover comparable levels of disparity (Fig. 3A,B). This trend is present in both disparity metrics. In the Olenekian, disparity is already high, and it increases further into the Anisian (Middle Triassic). This demonstrates that, even in the context of the entire Mesozoic, marine reptiles achieved high levels of phenotypic variation within the first 10 Myr of their evolution following the PTME. Greatest disparity is seen in the Carnian time bin in the early Late Triassic. With the exception of the Late Jurassic (Kimmeridgian–Tithonian) bin, disparity is consistently low from the Early Jurassic to the Early Cretaceous. Disparity then increases from the Early to Late Cretaceous, and by the Campanian and Maastrichtian, levels of variation equal (sum of variances) or approach (sum of ranges) those of the Middle Triassic and Carnian. Overall, this suggests that marine reptiles were most disparate during the early and latter stages of the Mesozoic. Disparity and time-bin sample size are very weakly and nonsignificantly correlated in the sum of variances (Spearman rank correlation, ρ=0.182, p=0.515), but there is a strong correlation between sample size and disparity based on the sum of ranges when rarefied to the average sample size (Spearman rank correlation, ρ=0.807, p=0.001) (Fig. 4).
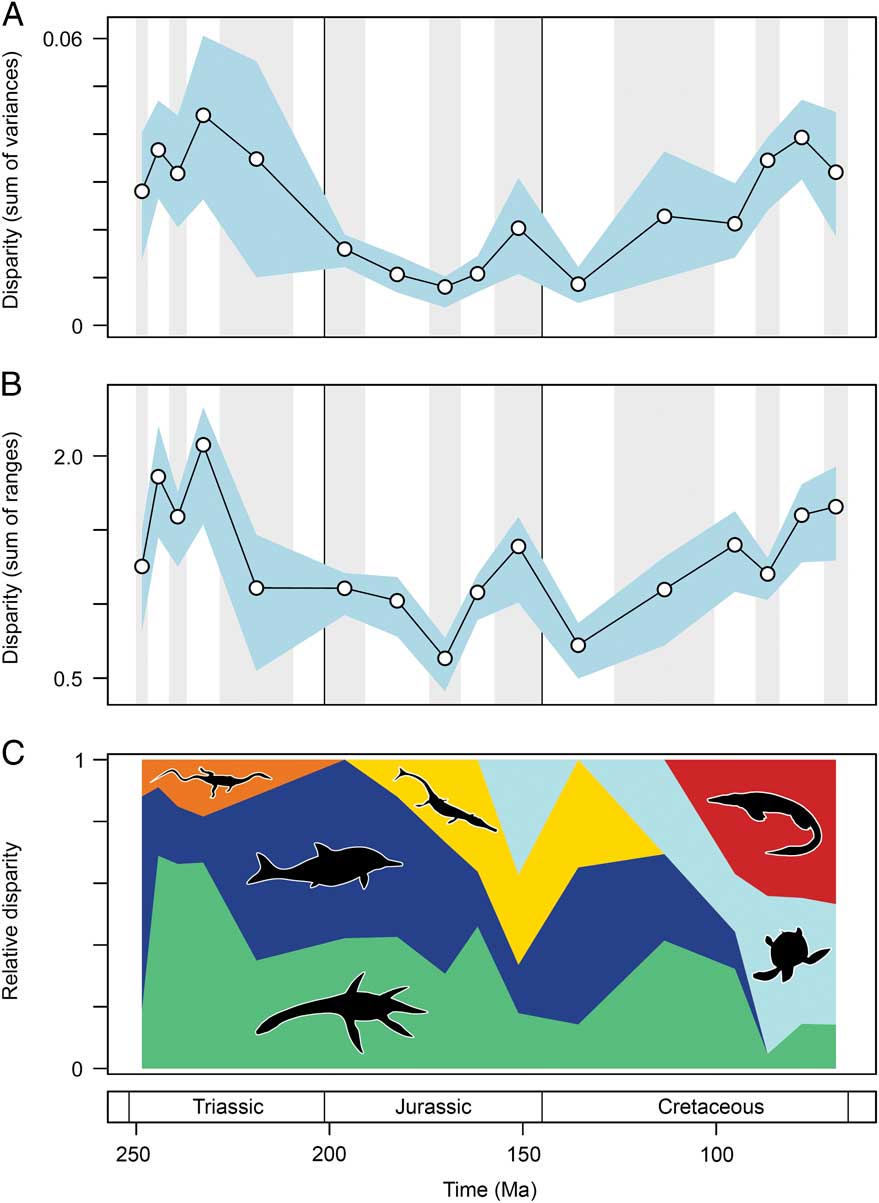
Figure 3 Mesozoic marine reptile functional disparity. Mean disparity values based on the sum of variances (A) and sum of ranges (B) metrics (white circles) are plotted in 16 Mesozoic time intervals. The blue envelopes represent 95% confidence intervals based on 10,000 bootstrap replicates. The sum of ranges is rarefied to the average sample size of the 16 bins (n=17). Partial disparity is illustrated in plot (C). This graphic illustrates the relative contributions of each marine reptile group to overall disparity through the Mesozoic: sauropterygians (green), ichthyosauromorphs (dark blue), thalattosaurs (orange), thalattosuchians (yellow), turtles (light blue), and mosasauroids (red).
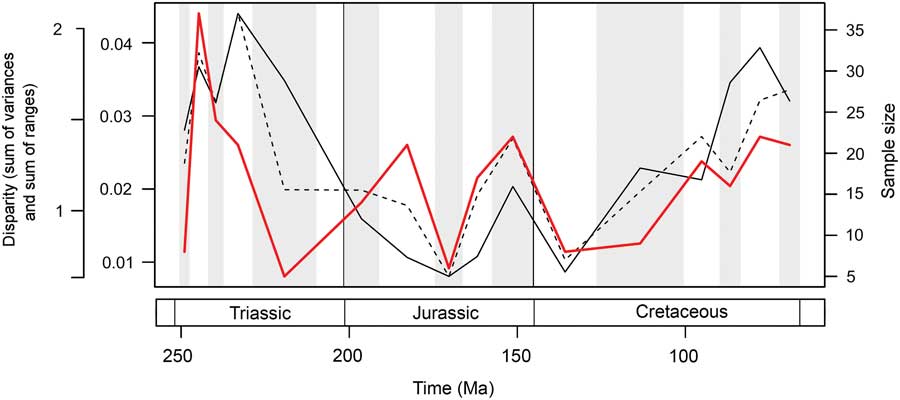
Figure 4 Mesozoic marine reptile disparity and time-bin sample size. Disparity through time is based on the data in Figure 3A,B, showing the mean sum of variances (solid black line) and sum of ranges (dashed black line) results. Bin sample size is plotted in the same 16 Mesozoic time intervals (solid red line).
There is evidence for a marked reduction in disparity resulting from marine reptile extinctions throughout the Late Triassic. When examining disparity in terms of the sum of variances metric (Fig. 3A), the overlapping confidence intervals associated with the Norian and Hettangian–Sinemurian bins suggest a nonsignificant disparity decline during the Triassic/Jurassic transition. This most likely arises from inflated confidence intervals because of a low sample size in the Norian (n=5). When this successive bin comparison is examined using variance-based statistics (Table 3), there is evidence for a statistically significant decline, according to marginal likelihoods (LR: 8.27, exceeding threshold for significance; Royall Reference Royall1997) and standard statistical tests (paired-sample t-tests, p=0.023; note this is not robust to correction for multiple comparisons). The sum of ranges metric (Fig. 3B) shows a statistically significant decline between and the Carnian and Norian bins, but there is no decline in disparity between the Norian and the Hettangian–Sinemurian bin of the earliest Jurassic, so conflicting with the results for the sum of variances. In this primary analysis, the sum of ranges is rarefied to the average sample size of the 16 bins used (n=17). As the Norian bin has only five samples, it is unsurprising that a large reduction in disparity is recovered when compared with the Carnian bin (rarefied sample size is 17), because the sum of ranges metrics is susceptible to sample-size bias. If all bins are rarefied to a minimum sample size (n=5), there is no significant decline in disparity between the Carnian and Norian (Supplementary Fig. 6).
Table 3 Statistical tests for significant differences/shifts in functional disparity and functional morphospace occupation between successive Mesozoic time bins. For comparative purposes, statistical tests for a disparity shift between the Carnian and Hettangian–Sinemurian are also provided. Disparity tests are based on paired-sample t-tests and likelihood ratios (LR). Functional morphospace occupation tests are based on nonparametric multivariate analysis of variance (NPMANOVA), performed on PC scores from the first 11 PC axes. Uncorrected and Bonferroni-corrected p-values are reported. Bold values represent statistically significant results where p-values are <0.05 and LRs are >8. See text in the “Stratigraphic Binning” section for full time-bin names and age ranges.

Marine reptile diversity was already massively depleted in the Norian (Kelley et al. Reference Kelley, Motani, Jiang, Rieppel and Schmitz2014). Therefore, greater insights into the loss of disparity during the Late Triassic/Early Jurassic transition can be gained by comparing the Carnian bin with the Hettangian–Sinemurian bin. In this case, both variance- and range-based metrics show a statistically significant loss of disparity (Fig. 3A,B), and statistical tests confirm that this disparity decline is significant, based on ratios of marginal likelihoods for variance (LR: 10.37) and paired-sample t-tests (p=0.011) (Table 3). In conclusion, these analyses confirm that the progressive and widespread lineage extinctions during the Late Triassic resulted in a significant loss of disparity in Mesozoic marine reptiles.
Marine reptile disparity also declined during the Jurassic/Cretaceous transition. Both metrics show that disparity was higher in the Late Jurassic bin (Kimmeridgian–Tithonian) than at any other interval in the Jurassic, but disparity was reduced by the Early Cretaceous (Berriasian–Barremian) (Fig. 3A,B). Marginal overlap of the confidence intervals in the sum of variances metric suggests that the disparity decline was nonsignificant. Variance-based statistical tests also fail to identify a significant change in disparity between these two bins (LR: 2.27, paired-sample t-tests p=0.153). In contrast, confidence intervals associated with the sum of ranges metric do not overlap. However, it is important to acknowledge sample-size discrepancies, because the Berriasian–Barremian bin has eight samples, compared with a rarefied sample size of 17 for the preceding Late Jurassic bin. Overall, there is a disparity reduction resulting from faunal turnover and a putative extinction during the Jurassic/Cretaceous transition, but the magnitude and statistical significance of this decline is uncertain.
Partial Disparity Trends
As a result of extinctions, diversifications, and faunal turnover, the relative contribution of each marine reptile group to overall disparity trends fluctuates markedly throughout the Mesozoic. Examining partial disparities dissects the contributions of each of the six major taxonomic assemblages (Fig. 3C). In the earliest sampled interval, the Olenekian, ichthyosauromorphs are by far the greatest contributors to overall functional disparity, but during the Middle Triassic to early Late Triassic, sauropterygians become the major contributors (approximately 60–70%). Thalattosaurs remain consistently low contributors throughout the Triassic. Following the Late Triassic extinctions, ichthyosauromorphs (neoichthyosaurians) and sauropterygians (plesiosaurs) make equal contributions to disparity in the Early Jurassic. While the sauropterygian contribution remains relatively stable throughout the Middle and Late Jurassic, the proportional contribution of the ichthyosaurs becomes increasingly diminished. This is associated with a greater contribution to disparity by thalattosuchian crocodylomorphs and the diversification of plesiochelyid turtles in the Late Jurassic. In the Early Cretaceous, ichthyosaurs are significant contributors to disparity, but their relative importance wanes substantially before eventual extinction by the end-Cenomanian. Trends of partial disparity from the mid-Cretaceous onward are driven by the diversification of the highly disparate turtles and mosasauroids. The high levels of overall variation in the Late Cretaceous coincide with the dominance of these two clades. The proportional disparity of the remaining Late Cretaceous sauropterygians (polycotylids and elasmosaurs) is much reduced.
Temporal Morphospace Trends and Selectivity
High disparity in the Middle Triassic results from an early proliferation of morphospace occupation during the initial diversifications of sauropterygians and ichthyosauromorphs, resulting from significant excursions along the first two axes of variation (Fig. 5; see also Supplementary Fig. 7). This gross pattern of morphospace occupation is maintained into the Carnian, and some disparate functional morphotypes persist into the Norian, despite reduced diversity. In the Jurassic, morphospace occupation is relatively restricted and consistent. As highlighted by the partial disparity analyses (Fig. 3C), the clear increase in disparity between the Early and Late Cretaceous is overwhelmingly driven by diversifications of the morphologically distinct marine turtles and mosasauroids. The Late Cretaceous is characterized by an abundance of mosasauroids positioned at the positive extreme of PC1 and an absence of taxa with strongly negative scores on PC2 (Fig. 5).
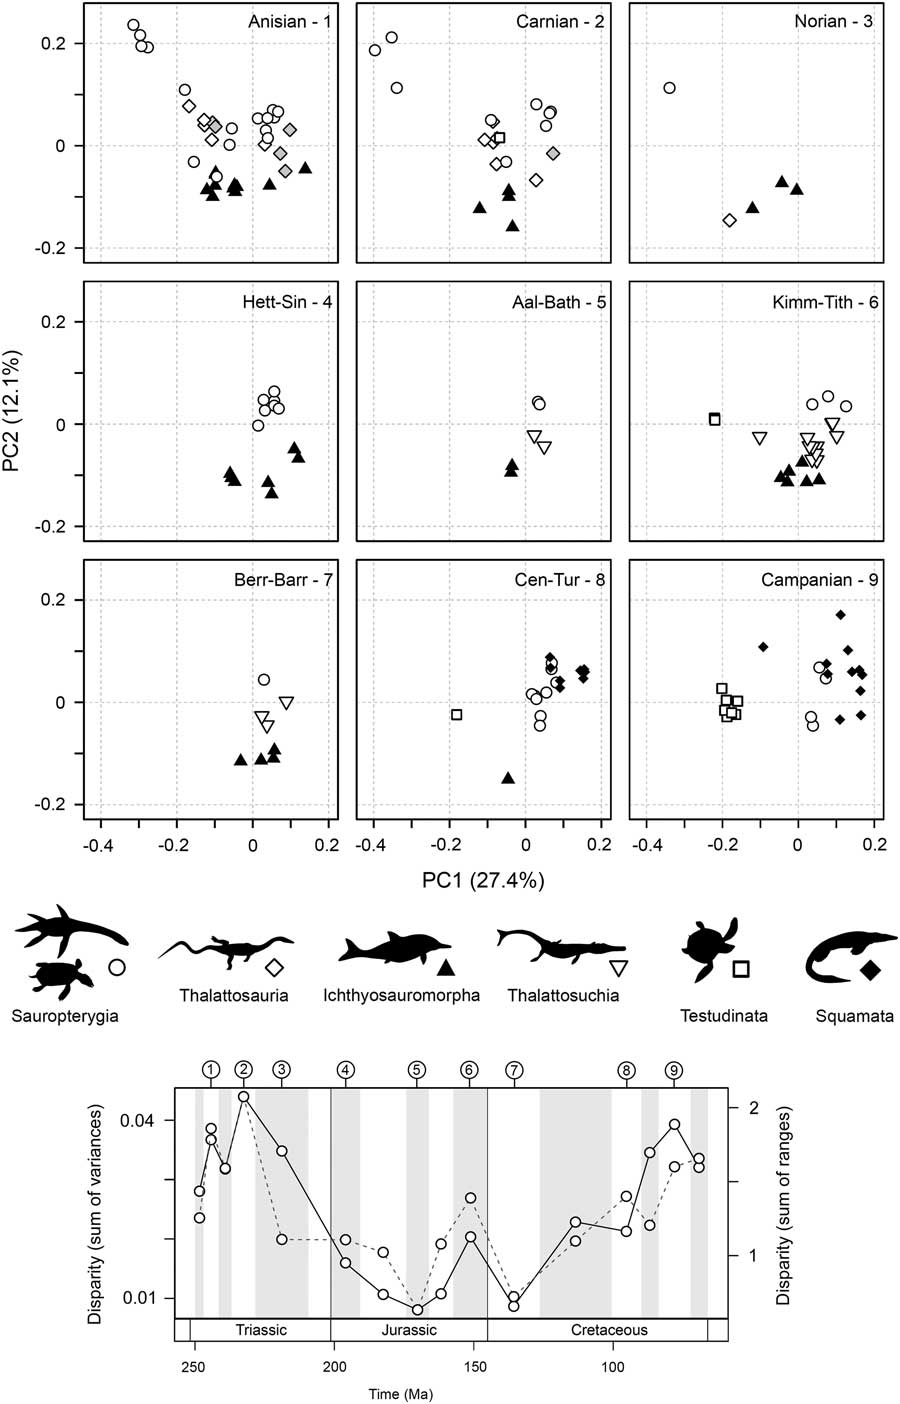
Figure 5 Patterns of functional morphospace occupation for marine reptiles through the Mesozoic. Two-dimensional plots of PCOa axes 1 and 2 are illustrated for nine sampled intervals: Anisian, Carnian, Norian, Hettangian–Sinemurian, Aalenian–Bathonian, Kimmeridgian–Tithonian, Berriasian–Barremian, Cenomanian–Turonian, and Campanian. Symbols are used to represent the major groups. The temporal position of each sampled interval is illustrated in a disparity through time plot based on the sum of variances and sum of ranges (dotted line) metrics. All 16 intervals are figured in Supplementary Figure 7.
Statistical tests highlight two shifts in functional morphospace occupation between successive sampling intervals (Table 3). The first significant shift is seen between the Norian and Hettangian–Sinemurian bins, namely those associated with the Triassic/Jurassic transition (NPMANOVA, F=4.278, p=0.0009). This resulted from the extinction of placodont sauropterygians and the excursion into regions of morphospace marked by positive PC1 and PC2 scores by plesiosaurs in the Early Jurassic (Fig. 5). A second, less significant shift is found between the Aptian–Albian and Cenomanian–Turonian bins of the mid-Cretaceous (NPMANOVA, F=4.278, p=0.0429, not robust to p-value corrections for multiple comparisons). This second shift could be driven by the diversification of mosasauroids in the Cenomanian and Turonian and the decreasing abundance of ichthyosaurs.
There is evidence for ecologically selective extinctions through the Late Triassic. When morphospace occupation in the Triassic bins is compared with the Early Jurassic, it is evident that extinction victims are concentrated in the left-hand regions of the plots (corresponding to negative PC1 scores) (Fig. 5). Throughout the Triassic, this adaptive zone was occupied by various eosauropterygians, placodonts, thalattosaurs, and ichthyosaurs. These taxa had a range of functional specializations. Those with positive PC2 scores (i.e., placodonts and thalattosaurs) possessed specialized dentition, including crushing dentition and dentary tooth plates, as well as having robust jaws with high mechanical advantages and increased musculature. Taxa with negative PC2 scores had slender jaws with weaker bites and reduced musculature, but all had dental specialization, including bulbous dentition (e.g., mixosaurids and Wumengosaurus) and in extreme cases, no dentition (e.g., Endennasaurus). No marine reptiles in the Early Jurassic possessed this suite of functional traits, and evolution is concentrated in a narrower adaptive zone (Fig. 5).
Ancillary Disparity Results
Disparity trends are consistent when alternative protocols and data subsets are used (Fig. 6). Based on mean pairwise dissimilarity from the Gower intertaxon distance matrix, temporal patterns follow those from the primary sum of variances results (Fig. 6A). Disparity trends based on continuous characters only also match those of the primary analyses. Once again disparity peaks in the Middle and early Late Triassic. This trend is recovered in both metrics and with the inclusion/exclusion of total mandibular length (Fig. 6B–E). Disparity dynamics through the Triassic/Jurassic transition and Jurassic/Cretaceous transition follow those described from the primary data set; the only exception is a lack of overlap between the confidence intervals associated with the Jurassic/Cretaceous transition in the sum of variances (Fig. 6B,C). The only marked difference between the primary results and ancillary results regards the extent to which disparity increased in the Late Cretaceous. Based on continuous characters only, levels of disparity reach a moderately high plateau from the Aptian–Albian bin until the end-Cretaceous; there is no apparent increase in disparity seen in the last three sampled intervals of the Cretaceous. This result indicates that discrete characters may be inflating disparity in these latter bins. This is unsurprising, given that they are dominated by mosasaurs, which possess a unique intramandibular joint and have great dental diversity.
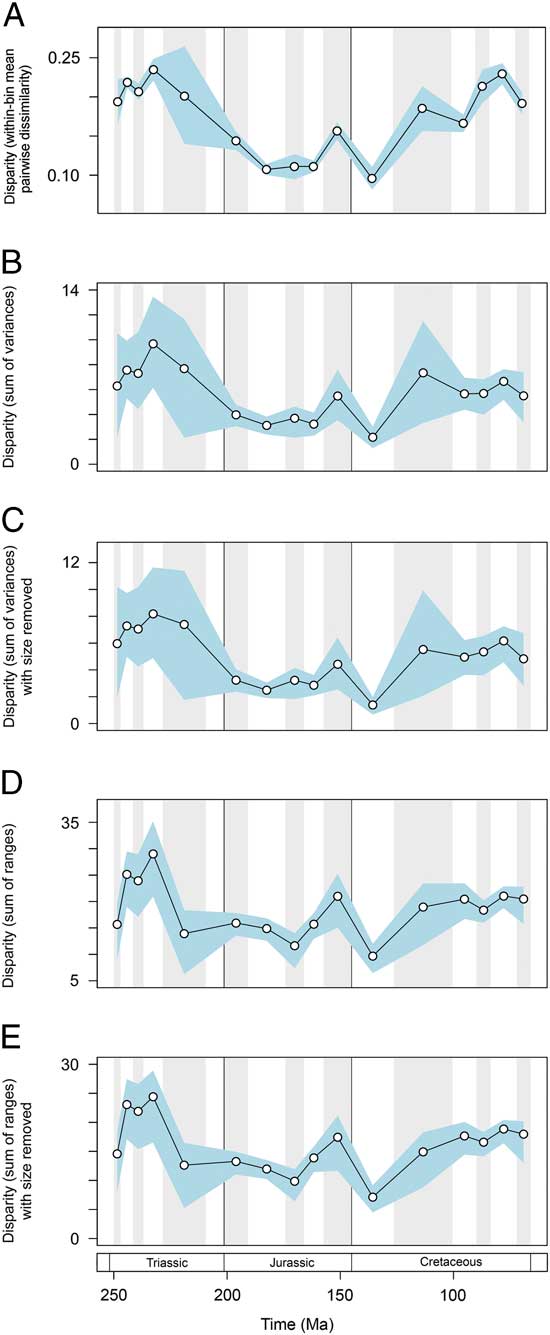
Figure 6 Marine reptile functional disparity plotted through time. Based on (A) within-bin mean pairwise dissimilarity calculated from the Gower intertaxon distance matrix using all characters, (B–E) using PC scores from analyses using only continuous characters. Mean disparity values based on pairwise dissimilarity (A), and the sum of variances (B, C) and sum of ranges (D, E) metrics (white circles) are plotted in 16 Mesozoic time intervals. The blue envelopes represent 95% confidence intervals based on 10,000 bootstrap replicates. The sum of ranges is rarefied to the average sample size of the 16 bins (n=17). In (C) and (E) the character total mandibular length was excluded from the data set.
Patterns of Skull-Size Evolution
The first 40 Myr of marine reptile evolution witnessed an exceptional range of skull sizes. Collectively, the marine reptiles of the Triassic explored the full range of forms seen in the entire Mesozoic (Fig. 7). Only a limited range of small forms is present in the Olenekian. However, the Anisian witnessed a great burst of skull-size evolution, including the diversification of both smaller taxa, such as pachypleurosaurs, and larger forms, including gigantic nothosaurs and the ichthyosaurs Cymbospondylus and Thalattoarchon. This disparate array of cranial sizes is present just 5–10 Myr after the PTME. Despite a considerable reduction in diversity during the Norian, the overall range of skull sizes remains high, including smaller forms such as Endennasaurus and the largest marine reptile of the Mesozoic, the ichthyosaur Shonisaurus sikanniensis (skull length ~3 m).
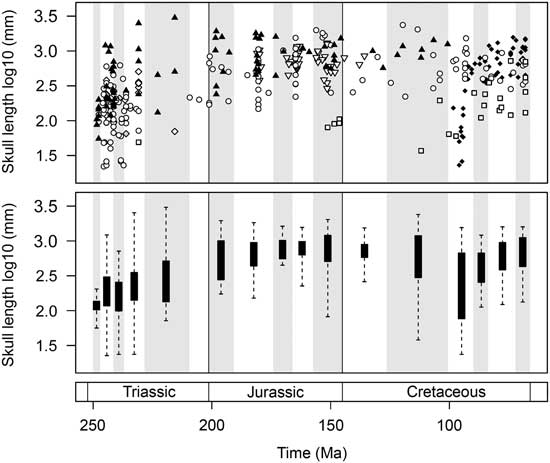
Figure 7 Temporal trends of marine reptile skull-size evolution. In the upper plot, log10 skull length for 354 marine reptile species is plotted at the midpoint of their stratigraphic range. Symbols are used to differentiate the major groups. Lower plot represents the same data expressed as box-and-whisker diagrams plotted at the midpoint of each time bin. Group symbols correspond to Figures 2 and 5.
The diversification of marine reptiles in the Early Jurassic did not produce the same array of forms as in the post-PTME radiation (Fig. 7). Compared to the Triassic, the overall range of sizes seen through the Jurassic is greatly reduced. There is a lack of smaller forms but an abundance of large taxa, including ichthyosaurs, pliosaurids, and thalattosuchians. The range of skull sizes is larger in the Late Jurassic, owing to the diversification of plesiochelyid turtles and the presence of large thalassophonean pliosaurs (e.g., Pliosaurus kevani, skull length ~2 m).
A great diversity of skull sizes is found in the mid-Cretaceous (Aptian–Turonian). During this interval, the range of sizes equals that of the Middle and Late Triassic (Fig. 7). Both large-skulled pliosaurs (e.g., Kronosaurus, skull length ~2.3 m) and small marine turtles are found in the Aptian–Albian. Similarly, the Cenomanian–Turonian witnesses the diversification of marine squamates, some of which (e.g., dolichosaurs) are very small, comparable to pachypleurosaurs of the Triassic (skull lengths of <10 cm). Large pliosaurs persist into the Turonian (e.g., Megacephalosaurus, skull length 1.8 m). By the Late Cretaceous, mosasaurs such as Tylosaurus, Prognathodon, Hainosaurus, and Mosasaurus show the largest sizes.
Clade-Specific Diversity and Disparity Trends
Phylogenetic diversity estimates show variable trajectories for the five major marine reptile clades. Sauropterygians, eosauropterygians, and ichthyosauromorphs achieve maximum species richness in the earliest intervals of their history (Fig. 8). All three clades show a significant decline in lineage diversity during the Late Triassic but go on to achieve high diversity again in later intervals, in the Early Jurassic (ichthyosaurs) and mid-Cretaceous (sauropterygians). For mosasauroids, lineage diversity peaks in the Campanian, in the latter stages of their evolutionary history, and there is no evidence for an early numerical diversification. The same is true for thalattosuchians, which reach maximum lineage diversity in the middle part of their duration (Callovian–Kimmeridgian) (Fig. 8).
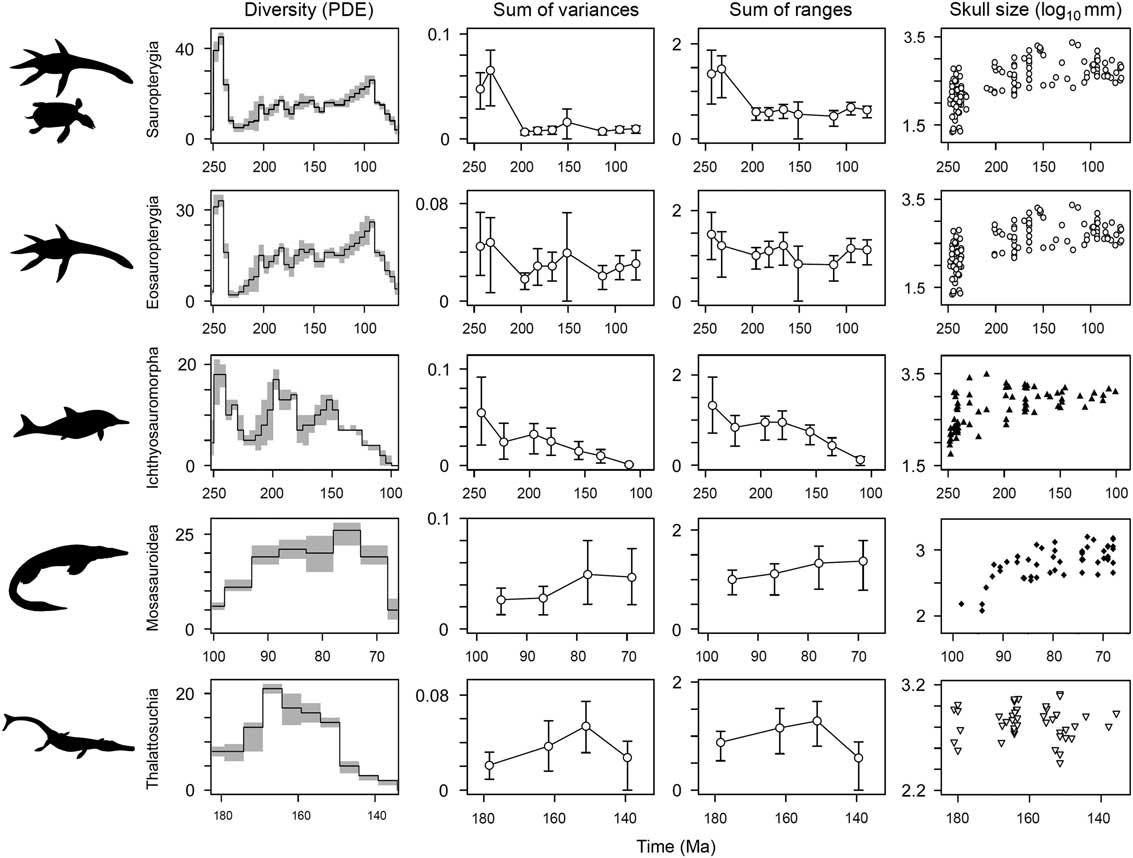
Figure 8 Temporal diversity and disparity trends in five marine reptile groups. Phylogenetic diversity estimates are plotted in the first column. Mean disparity values (white circles) are plotted in time bins through each group’s duration, with associated 95% confidence intervals based on 10,000 bootstrap replicates. Two disparity metrics are shown: the sum of variances and the sum of ranges. The groups plotted are sauropterygians, eosauropterygians, ichthyosauromorphs, mosasauroids, and thalattosuchians. In the sum of ranges metric, the sample size is rarefied to n=7, representing the median sample size for sauropterygians, eosauropterygians, ichthyosauromorphs, and thalattosuchians and the minimum sample size for mosasauroids. In column four, temporal trends of skull-size diversity based on log10 skull length are plotted at the midpoint of each taxon’s stratigraphic range. Note the contrasting temporal duration of each clade given on the x-axes.
Not all marine reptile clades show early high disparity. Calculations, based on separate analyses of the five most diverse marine reptile clades, once again highlight a dichotomy between those that diversified during the Triassic biotic recovery and those that diversified later in the Mesozoic (Fig. 8). Both sauropterygians and ichthyosauromorphs have bottom-heavy disparity profiles, with greatest disparity present in the early stages of their history and reduced disparity in later intervals. In ichthyosauromorphs, this trend is still recovered when the enigmatic Cartorhynchus and Hupehsuchus are removed (based on Ichthyosauria only). For sauropterygians, this result is consistent when analyses are performed on eosauropterygians only (minus placodonts), but the magnitude of difference between the early and later intervals is far less (Fig. 8). Clades that diversified in the Jurassic and Cretaceous, the thalattosuchian crocodylomorphs and mosasauroids, have more top-heavy disparity profiles, with reduced disparity in earlier intervals and greatest disparity later in their durations (Fig. 8).
Temporal trends of skull-size evolution also show early bursts of evolution in sauropterygians and ichthyosauromorphs (Fig. 8). In both clades, an explosive diversification gave rise to a great range of sizes in the early stages of their evolutionary history (note the logarithmic scale). Ichthyosauromorphs show a marked canalization of sizes through time, while sauropterygian evolution generally becomes concentrated around exploring larger forms, spread over a greater time span. In contrast to disparity trends, a relatively high range of sizes is shown by thalattosuchians during their initial diversification; however, maximum range is not seen until the Late Jurassic, ~30 Myr after the clade’s origin. Closely corresponding with morphological disparity trends, a limited range of generally smaller forms is seen in mosasauroids for the first half of their history, before reaching a stable higher range for the second half of their evolution (Fig. 8).
Clade-Specific Evolutionary Models
Early-burst maximum-likelihood models receive overwhelming support for sauropterygians, eosauropterygians, and ichthyosauromorphs, but not for mosasauroids and thalattosuchians (Fig. 9, Table 4). In the three clades that diversified during the Triassic biotic recovery, the early-burst model and/or delta model (with early high rates: δ<1) have significantly greater AICc weights for all phenotypic variables (morphospace axes and skull size) (Fig. 9, Table 4). In contrast, BM models receive little support in these three clades. In mosasauroids, models associated with rate heterogeneity have generally low AICc weights and are poorly supported, while the BM model is favored. For PC axis 2, the favored delta model is consistent with high rates of evolution later in the clade’s history (δ>1); the opposite of early burst (Ingram et al. Reference Ingram, Harmon and Shurin2012). The EB model is best supported for skull-size evolution in mosasauroids, but this is not decisive. In Thalattosuchia, EB model support is mixed. Early burst and/or delta are clearly favored for skull-size evolution, but a BM model is best supported for functional evolution in the jaws and dentition (Fig. 9, Table 4). When dating trees with 1 Myr minimum branch lengths enforced, the results are the same (Supplementary Table 4).
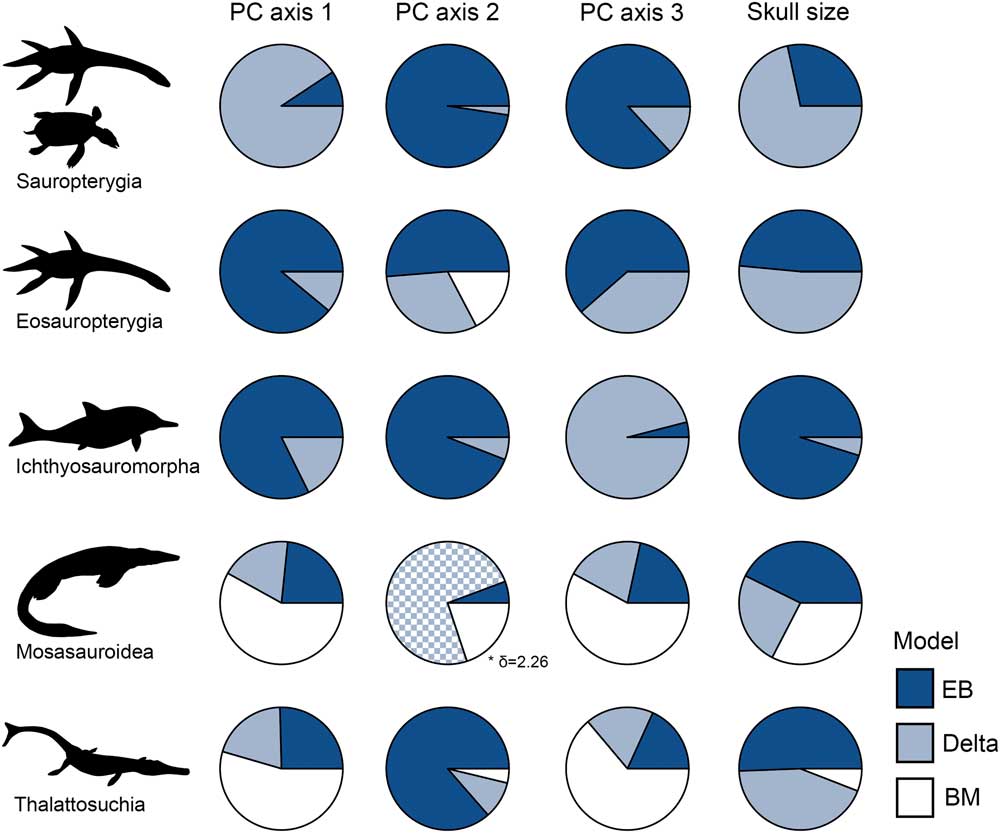
Figure 9 Evolutionary model fittings for morphospace axes and skull size in five marine reptile groups. Akaike weights of three models are expressed as circle charts for each group and trait. The groups plotted are: sauropterygians, eosauropterygians, ichthyosauromorphs, mosasauroids, and thalattosuchians. In all instances where delta is the favored model, it is associated with early high rates, with the exception of mosasauroid PC axis 2. EB, early burst; BM, Brownian motion.
Table 4 Summary of maximum-likelihood model-fitting analyses. Sample size–corrected Akaike’s information criterion (AICc), model parameter values, and AICc weights are documented for each analytical permutation. For the AICc values, we report the mean and standard error based on multiple dating and topology replicates, as described in the text. The results from this table are visualized in Figure 9. The best-fitting evolutionary models are highlighted in bold for each analysis: lowest AICc value, highest AICc weight. MSL, maximum skull length; BM, Brownian motion; and EB, early burst.

Discussion
■
Early Ecomorphological Diversification in Triassic Marine Reptiles
As an adaptive assemblage, Triassic marine reptiles were one of the true success stories to arise in the devastated postextinction oceans. The first wave of marine invasion by reptiles in the Triassic was associated with an exceptional burst of ecomorphological diversity (Figs. 3, 5, 7). Taken together, patterns of functional disparity, morphospace occupation and skull-size evolution, show that the Middle to early Late Triassic was not just a time of marked proliferation in terms of species numbers (e.g., Benson et al. Reference Benson, Butler, Lindgren and Smith2010; Benson and Butler Reference Benson and Butler2011), but also a time of explosive phenotypic evolution—something that had only previously been noted speculatively based on qualitative observations (Fröbisch et al. Reference Fröbisch, Fröbisch, Sander, Schmitz and Rieppel2013; Liu et al. Reference Liu, Hu, Rieppel, Jiang, Benton, Kelley, Aitchison, Zhou, Wen, Huang, Xie and Lv2014). In the first 10–20 Myr of the Triassic, diversifying lineages explored the greatest breadth of functional morphospace (Fig. 5), and the accumulated functional disparity represented the maximum in the Mesozoic (Fig. 3). Similarly, the Triassic witnessed the greatest disparity of skull sizes, with the full range of potential forms realized by one clade or another (Fig. 7).
The geologically rapid evolution of such phenotypic diversity likely resulted from early expansion into a broad variety of previously unexplored trophic niches that represented vacant adaptive zones (Benton et al. Reference Benton, Zhang, Hu, Chen, Wen, Liu, Huang, Zhou, Xie, Tong and Choo2013). Diverse diets, including feeding on fast-moving nektonic prey, hard- and soft-shelled benthic invertebrates, and other marine reptiles, resulted in many specialized morphofunctional innovations, including robust jaws with massive coronoid processes, powerful bites and crushing dentition, benthic feeders with specialized anterior dentition to acquire prey from the substrate, snapping bites generated with gracile jaws accommodating procumbent fangs, and large macropredators with enlarged bicarinate cutting teeth. For new top-tier predatory tetrapods, a marine revolution was already well underway in the Middle Triassic. Our study points to an earlier onset of the Mesozoic marine revolution (MMR) in some groups compared with the usual beginning point of the Jurassic (Vermeij Reference Vermeij1977). This early onset of the MMR is seen among marine reptiles and is also suggested by new discoveries of lobsters and neopterygian bony fishes from the Anisian in China (Hu et al. Reference Hu, Zhang, Chen, Zhou, Lü, Xie, Wen, Huang and Benton2011) and evidence of a predation-driven Triassic radiation in crinoids (Baumiller et al. Reference Baumiller, Salamon, Gorzelak, Mooi, Messing and Gahn2010). Overall, this hints that the MMR may have been triggered as part of the recovery from the PTME, rather than later in the Jurassic (Vermeij Reference Vermeij1977).
Much recent research effort has focused on the tempo of biotic recovery following the PTME. Was the full global recovery of marine life delayed until 5–10 Myr after the event, by which time complex and stable ecosystems were established (Chen and Benton Reference Chen and Benton2012; Liu et al. Reference Liu, Hu, Rieppel, Jiang, Benton, Kelley, Aitchison, Zhou, Wen, Huang, Xie and Lv2014), or was the recovery of life in the oceans more rapid, with full-length, multilevel trophic food webs present in the Induan or Olenekian (Scheyer et al. Reference Scheyer, Romano, Jenks and Bucher2014; Motani et al. Reference Motani, Chen, Jiang, Cheng, Tintori and Rieppel2015a)? Although this study was not designed to test these competing hypotheses, the results can still be used to inform this debate.
Analyses show that marine reptile functional disparity was already relatively high in the Olenekian, particularly in terms of variance, when ichthyosauromorphs were dominant contributors to overall disparity (Fig. 3). This result is intriguing, given low species diversity (Kelley et al. Reference Kelley, Motani, Jiang, Rieppel and Schmitz2014), but it is not entirely unexpected when surveying the global diversity of forms. Olenekian marine reptiles had already broadly diversified into an array of feeding strategies, including suction-feeding and lunge-feeding ichthyosauromorphs such as Cartorhynchus and Hupehsuchus, potentially durophagous ichthyosaurs like Grippia, and early presumed fish-eating eosauropterygians like Corosaurus (Motani Reference Motani1997; Rieppel Reference Rieppel1998; Motani et al. Reference Motani, Chen, Jiang, Cheng, Tintori and Rieppel2015a,Reference Motani, Jiang, Chen, Tintori, Rieppel, Ji and Huangb). Disparity increased into the Anisian, when sauropterygians became dominant contributors to overall disparity (Figs. 3, 5), although the magnitude of increase was not statistically significant. A more substantial increase in the diversity of forms between the Olenekian and Anisian is seen in the skull-size data. The Carnian bin represents the disparity maximum, marginally greater than in the Anisian and latest Cretaceous bins (Fig. 3). No new higher clades diversified during the Carnian, nor was the disparity peak associated with a considerable expansion of morphospace occupation or shift in partial disparity contributions (Figs. 3, 5). It is likely that the high Carnian disparity resulted from the accumulated sample of functional extremes, such as large edentulous ichthyosaurs, shell-crushing placodonts (including the enigmatic Henodus), and bizarre heterodont thalattosaurs (e.g., Xinpusaurus). Overall, these patterns cannot exclude either hypothesis regarding the tempo of biotic recovery following the PTME, but there is tentative support for a delay until the Middle–early Late Triassic, when marine reptiles reached their full potential of ecomorphological diversity.
Late Burst in Cretaceous Marine Reptiles
This study highlights the Late Cretaceous as a second exceptional interval in the trophic diversifications of Mesozoic marine reptiles. Functional disparity in the jaws and dentition of Campanian and Maastrichtian taxa equaled that of the Middle and early Late Triassic (Fig. 3). This resulted from the diversification of disparate mosasauroids and turtles, coupled with the persistence of elasmosaurid and polycotylid plesiosaurs. Mosasaurs became increasingly ecologically disparate through their geological history, culminating in broad ecospace occupation in the Campanian and Maastrichtian (Ross Reference Ross2009). The substantial depth distribution of mosasaurs in the water column meant they could exploit diverse benthic and pelagic prey (Polcyn et al. Reference Polcyn, Jacobs, Araújo, Schulp and Mateus2014). Turtles also achieved great taxonomic diversity in the Late Cretaceous and possessed functionally distinct robust jaws without teeth (Brinkman et al. Reference Brinkman, Hart, Jamniczky and Colbert2006). Massare (Reference Massare1987) suggested that there was a reduction in marine reptile ecomorphological diversity between the Late Jurassic and Late Cretaceous, by examining dental morphotypes in the Kimmeridge Clay, Pierre Shale, and Niobrara Chalk faunas. However, this trend was not recovered here, most likely because the current study incorporates a greater diversity of taxa from global samples (including turtles) and also considers structural variation in the jaw.
There is no substantive evidence for a large-scale decline in marine reptile ecomorphological diversity prior to the end-Cretaceous. Therefore, any destruction brought about by the end-Cretaceous mass extinction was likely to have been geologically abrupt. To investigate further, future studies could focus on narrower sampling intervals and regional trends in the last 10 Myr of the Mesozoic.
Disparity, Lagerstätte Effects, and Shallow-Marine Environments
Exceptionally rich fossil lagerstätten can be overwhelming determinants in temporal patterns of taxonomic diversity, because atypically high preservation can generate artificial peaks (e.g., Butler et al. Reference Butler, Benson and Barrett2013). In Mesozoic marine reptiles, diversity in the Jurassic, and to some extent the Middle Triassic, is heavily affected by lagerstätte-dominated sampling (Benson et al. Reference Benson, Butler, Lindgren and Smith2010; Benson and Butler Reference Benson and Butler2011). The influences of “lagerstätte effects” on patterns of disparity are not well understood. Theoretically, formations with exceptional preservation are more likely to provide material of sufficient quality, such as complete skulls and skeletons, that can be included in large-scale studies of disparity, potentially inflating sample size in such intervals. In fact, exceptionally preserved marine reptile biotas that yield many specimens are scattered through the Mesozoic, and it is a moot point which would be termed “lagerstätten,” and which not.
A detailed study of the ichthyosaur fossil record showed that specimen quality is subject to many factors (Cleary et al. Reference Cleary, Moon, Dunhill and Benton2015). These include geographic location (the Northern Hemisphere is better documented than the Southern), specimen size (medium-sized specimens are more complete than small or large), and facies (best specimens in fine-grained siliciclastics). Importantly, Cleary et al. (Reference Cleary, Moon, Dunhill and Benton2015) found no relationship between specimen quality and any of the commonly used temporal sampling metrics such as formation counts or map areas, nor were named lagerstätten the unique sources of complete specimens.
Disparity is widely considered to be both conceptually and empirically different from diversity; sampled intervals commonly have high diversity but low morphological disparity, or vice versa (Foote Reference Foote1997) (Fig. 4). In addition, variance-based measures are generally robust to sample-size discrepancies (Ciampaglio et al. Reference Ciampaglio, Kemp and McShea2001). In this study, temporal patterns of functional disparity and skull-size variation cannot be simply attributed to the distribution of lagerstätte deposits. Jurassic marine reptiles together exhibit generally low disparity, despite being dominated by lagerstätten (Figs. 3–7). In contrast, the mid- to Late Cretaceous interval shows higher disparity, despite not being associated with lagerstätte effects (Benson and Butler Reference Benson and Butler2011).
Marine reptile diversity trends were driven by marine transgression and regression (Benson and Butler Reference Benson and Butler2011). Marine reptiles can be broadly divided into shallow-marine or open-ocean habitat groups based on the degree of postcranial specialization and locomotory modes. Benson and Butler (Reference Benson and Butler2011) identified the Anisian–Carnian, Bathonian–Tithonian, and Cenomanian–Maastrichtian as times with elevated diversity of shallow-marine taxa. These intervals broadly correspond to sea-level highstands and times of greater continental flooding. The strong negative correlation recovered between shallow-marine taxic diversity and nonmarine area was interpreted by Benson and Butler (Reference Benson and Butler2011) as representing a species diversity–area relationship, whereby greater continental flooding increases the habitable area for shallow-marine organisms and elevates the deposition of fossiliferous rock, a pattern formalized as the “common cause” hypothesis (Peters Reference Peters2005). Intriguingly, times of transgression, increased continental flooding, and higher diversity in shallow-marine taxa also correspond to intervals of greatest disparity in the current study. Functional disparity and the diversity of skull sizes are highest in the Anisian–Carnian, Kimmeridgian–Tithonian and Late Cretaceous (Figs. 3, 7). Intervals in which shallow-marine reptiles are rarer and open-ocean taxa dominated, such as the Early Jurassic and earliest Cretaceous (Benson and Butler Reference Benson and Butler2011), have reduced functional disparity and a less diverse range of skull sizes. Such times occur during or after major regression events (Benson and Butler Reference Benson and Butler2011; Kelley et al. Reference Kelley, Motani, Jiang, Rieppel and Schmitz2014). This study therefore provides tentative evidence that major patterns of morphological evolution in Mesozoic marine reptiles were driven by changing physical environmental conditions.
Shallow-marine reptiles may exhibit greater functional disparity and a more diverse range of skull sizes because coastal and shallow-shelf environments accommodate a greater diversity of habitats and of prey. Transgression and continental flooding concentrate nutrients in coastal and shallow-shelf environments because there is abundant terrigenous input through sediments and soils (Smith et al. Reference Smith, Gale and Monks2001). This is expected to increase productivity and biomass, particularly in benthic invertebrates (Polycn et al. Reference Polcyn, Jacobs, Araújo, Schulp and Mateus2014). A diversity of prey is likely to catalyze phenotypic innovation in the jaws and dentition. For example, feeding on hard-shelled benthic invertebrates requires morphofunctional modifications, such as increased musculature, greater jaw robustness, higher mechanical advantages, crushing or bulbous dentition, and specialized anterior dentition for plucking sessile prey. Durophagous and benthic foraging specializations are abundant in the shallow-marine reptiles, including Triassic sauropterygians, thalattosaurs and ichthyosauromorphs, Late Jurassic plesiochelyid turtles, and specialized Cretaceous mosasauroids and turtles.
Deep-water facies, inhabited by open-ocean marine reptiles, receive little terrigenous input and are expected to be more resource poor (Hudson et al. Reference Hudson, Martill and Page1991; Benson and Butler Reference Benson and Butler2011). Open-ocean marine reptiles would generally feed on nektonic prey, such as fast-moving cephalopods, fish, and tetrapods (Massare Reference Massare1987), and therefore the absence of benthic foragers and durophages could explain reduced disparity. Hydrodynamic constraints on structural variation are also heightened in open oceans when feeding on fast-moving nektonic prey occurs (Taylor Reference Taylor1987).
Extinction Intensity and Selectivity
Selective extinction and the lack of opportunistic ecospace refilling in the Jurassic meant that the Late Triassic extinctions had profound consequences for marine reptile evolution. Major marine regression through the late Carnian and Norian, followed by massive eruptions and ocean anoxia close to the Triassic/Jurassic boundary, resulted in widespread lineage extinction, and the associated decline in functional disparity and skull-size diversity identified here had long-lasting effects, with comparable levels of ecomorphological variation not recovered for another 100 Myr. Low sample size in the long Norian bin and lack of material for the Rhaetian makes assessing the timing of the extinctions and loss of disparity difficult. However, the functionally distinct placodonts persisted into the Rhaetian (Rieppel Reference Rieppel2002; Nordén et al. Reference Nordén, Duffin and Benton2015), so disparity could have remained high until the Triassic/Jurassic boundary. Extinction victims were concentrated in the moderate to extreme negative regions of PC1 in functional morphospace, an area associated with durophagous and benthic foraging specializations. This supports the findings of Kelley et al. (Reference Kelley, Motani, Jiang, Rieppel and Schmitz2014), who, using categories, illustrated that the shallow-marine durophagous taxa were vulnerable to the geologically rapid regression of the Late Triassic. Our study also points toward size as an ecologically selective trait. Whereas most studies find selectivity against larger taxa (e.g., Friedman Reference Friedman2009), in this case it was small marine reptiles that did not transcend the extinction interval (Fig. 7).
Major extinction events are predicted to give rise to episodes of morphological diversification when ecological space is rapidly refilled during the recovery interval (Droser et al. Reference Droser, Bottjer and Sheehan1997; Erwin Reference Erwin2008). Jurassic marine reptiles do not conform to this trend but instead appear to have passed through a macroevolutionary bottleneck (Thorne et al. Reference Thorne, Ruta and Benton2011). Although marine reptile groups diversifying in the Early Jurassic achieved high numerical diversity (Thorne et al. Reference Thorne, Ruta and Benton2011; Benson et al. Reference Benson, Evans and Druckenmiller2012; Cleary et al. Reference Cleary, Moon, Dunhill and Benton2015) (Fig. 8), they failed to explore the same range of ecomorphological characteristics as extinction victims and were generally concentrated in a reduced range of adaptive zones (Figs. 3, 5, 7). Similar canalization was reported by Thorne et al. (Reference Thorne, Ruta and Benton2011) and Dick and Maxwell (Reference Dick and Maxwell2015) for ichthyosaurs based on morphological variation in whole-body skeletal characters and ecospace modeling. As previously noted, this could be attributed to variable diversification patterns in shallow-marine versus open-ocean environments. The diversifications of chondrichthyans and osteichthyans may have also impacted marine reptile macroevolution. For example, there are elevated origination rates in chondrichthyans during the Early Jurassic (Friedman and Sallan Reference Friedman and Sallan2012), while others have highlighted greater potential competition in the small-bodied, durophagous, and benthic-foraging niches from actinopterygians such as Dapedium (Thorne et al. Reference Thorne, Ruta and Benton2011; Smithwick Reference Smithwick2015).
There is some evidence for a loss of ecomorphological diversity through the Jurassic/Cretaceous transition. Marine reptile functional disparity decreased, but statistical support for this decline is generally weak or absent (Fig. 3, Table 3). Representatives of all major groups passed through the extinction interval (Benson and Druckenmiller Reference Benson and Druckenmiller2014), along with most functional morphotypes.
Adaptive Radiations in the Marine Realm
When separately diversifying clades are presented with the same ecological opportunity, such as invading ocean ecosystems, evolution is expected to be strongly deterministic, leading to replicate adaptive radiations and repeated bursts of evolution (Schluter Reference Schluter2000). However, this study shows that invasion of a new habitat does not lead to identical macroevolutionary trajectories in the most diverse Mesozoic marine reptile groups. The signatures of adaptive radiation are seen in sauropterygians, eosauropterygians, and ichthyosauromorphs, as shown universally by the early accumulation of lineage diversity, early high disparity, rapid proliferation of skull-size diversity, and strong support for early-burst maximum-likelihood models (Figs. 8, 9, Table 4). In contrast, an adaptive radiation model does not adequately describe patterns of evolution in thalattosuchians and mosasauroids. This suggests that the colonization of a new environment alone does not always serve as a catalyst for adaptive radiation and spectacular speciation events.
Timing of diversification and biotic conditions in the marine realm were likely key factors in the contrasting patterns of evolution in Mesozoic marine reptiles. As stated by Simpson (Reference Simpson1944: p. 212) “The availability of a new adaptive zone does not depend alone on its physical existence … , but also on its being open to other occupants or so sparsely or marginally occupied that it involves no great competition.” When sauropterygians and ichthyosauromorphs diversified in the aftermath of the PTME, the marine realm was largely devoid of competitors, leading to numerical and morphological diversifications along disparate ecological axes (Fig. 5) (Chen and Benton Reference Chen and Benton2012). In contrast, thalattosuchians and mosasauroids originated free from any major biotic crises. Thalattosuchians initially diversified in the Early Jurassic (Young et al. Reference Young, Brusatte, Ruta and De Andrade2010), ~20 Myr after secondary Jurassic radiations gave rise to a diverse assemblage of plesiosaurian sauropterygians and neoichthyosaurs (Thorne et al. Reference Thorne, Ruta and Benton2011; Benson et al. Reference Benson, Evans and Druckenmiller2012). Mosasauroids diversified in the Cenomanian and Turonian, when plesiosaurs were represented by three ecologically distinct groups—the elasmosaurids, polycotylids, and pliosaurids—and large predatory teleosts and sharks were important components of marine ecosystems (Massare Reference Massare1987; Schwimmer et al. Reference Schwimmer, Stewart and Williams1997; Everhart et al. Reference Everhart, Hageman and Hoffman2010). Therefore, for thalattosuchians and mosasauroids, diversifying selection during the initial phase of evolution may not have been as strong, because there was less unoccupied niche space to fill. These divergent trends agree with the growing consensus on how ecological opportunity may operate to drive adaptive radiation, through both “niche availability” (e.g., marine-environment prey resource) and then “niche discordance,” which promotes phenotypic diversification into increased variance of niche-related traits (diverse diets and feeding ecologies) (Schluter Reference Schluter2001; Burbrink et al. Reference Burbrink, Chen, Myers, Brandley and Pyron2012; Wellborn and Langerhans Reference Wellborn and Langerhans2015).
Clade duration and large-scale external perturbations may also explain the dichotomous macroevolutionary trends in Mesozoic marine reptiles. Sauropterygians and ichthyosauromorphs differ from mosasauroids and thalattosuchians in terms of evolutionary duration and terrestrial phylogenetic heritage. Thalattosuchians and mosasauroids represent shorter-lived and specialized offshoots from large, ancestrally terrestrial, clades (Bardet et al. Reference Bardet, Falconnet, Fischer, Houssaye, Jouve, Suberbiola and Vincent2014). On the other hand, ichthyosauromorphs and sauropterygians were long-lived marine clades, and their evolution was punctuated by major phylogenetic bottlenecks in the Late Triassic (Thorne et al. Reference Thorne, Ruta and Benton2011). Mosasaur extinction was particularly abrupt and seemingly premature, given that they maintained high diversity and disparity in the later parts of their history (Polcyn et al. Reference Polcyn, Jacobs, Araújo, Schulp and Mateus2014) (Fig. 8). Had mosasaurs passed through the Cretaceous–Paleogene extinction event and continued to exist with reduced diversity and disparity for a long interval, their macroevolutionary trends may have closely mirrored those of sauropterygians and ichthyosauromorphs.
Direct tests for bursts of evolution characteristic of adaptive radiation are relatively rare for other secondarily marine tetrapod groups. The Cenozoic witnessed the marine diversifications of sphenisciforms, hydrophiin snakes, cetaceans, sirenians, and pinnipedimorphs (Kelley and Pyenson Reference Kelley and Pyenson2015). These independent invasions of ocean ecosystems were broadly analogous to those seen in Mesozoic marine reptiles; most were initiated by ecological opportunity and occurred in comparable environmental settings (Pyenson et al. Reference Pyenson, Kelley and Parham2014). Thus far, most attention has focused on the diversification of cetaceans. Open niche space has been proposed as the main driving force behind the Eocene archaeocete (stem cetacean) radiation (Gingerich Reference Gingerich2003). Steeman et al. (Reference Steeman, Hebsgaard, Fordyce, Ho, Rabosky, Nielsen, Rahbek, Glenner, Sørensen and Willerslev2009) and Slater et al. (Reference Slater, Price, Santini and Alfaro2010) both focused on the tempo of the neocete (crown cetacean) radiation in a quantitative framework and discovered no evidence for early rapid lineage diversification in the Oligocene. Importantly, however, Slater et al. (Reference Slater, Price, Santini and Alfaro2010) did present strong evidence for an early burst of body-size evolution in neocetes associated with dietary differentiation, consistent with a niche-filling adaptive radiation model. Therefore, there is some evidence that empty ecospace was not just a driver for the adaptive radiations of Triassic ichthyosaurs and sauropterygians but also important in the ecological ascent of cetaceans. Future studies may benefit from incorporating both stem and crown cetaceans with fossil data within the same framework to facilitate a broader comparison of trends across secondarily marine tetrapods through their entire durations.
Acknowledgments
This project was funded by the Natural Environment Research Council (Ph.D. grant NE/J500033/1 to T.L.S. and M.J.B.). We thank Heinz Furrer, Rainer Schoch, and Markus Moser for providing access to specimens and assistance during collection visits. We are very grateful to Sven Sachs, Benjamin Moon, Judyth Sassoon, Benjamin Kear, Silvio Renesto, James Neenan, Davide Foffa, Mike Polcyn, Da-yong Jiang, William Simpson, Jahn Hornung, Carl Mehling, Anne Schulp, and Jan Ove R. Ebbestad for providing photographs of specimens. Many thanks also to Marcello Ruta, Phil Anderson, and Emily Rayfield for methodological advice and to two reviewers for helpful suggestions and comments. Finally, we thank the Paleobiology Patrons Fund for financial support.
Supplementary Material
Supplemental materials deposited at Dryad: doi:10.5061/dryad.5890r


 Open access