


The importance of diet as a risk factor for non-communicable disease is evidenced in the recent report Australia’s Health 2014, which indicated that 11 % of the burden of disease was attributable to dietary risk factors( 1 ). The epidemiological studies from which these diet–disease associations are derived often use an FFQ to estimate daily nutrient intakes. However, random and systematic measurement error in the FFQ can lead to biased risk estimates and reduced statistical power to detect these associations. The extent of the measurement error, especially under-reporting, in these widely used FFQ, and to a lesser extent in other self-reported instruments such as the 24 h recall (24HR), was demonstrated in the Observing Protein and Energy Nutrition (OPEN) study which compared intakes estimated from these methods with recovery biomarkers for energy and protein( Reference Subar, Kipnis and Troiano 2 ).
Studies that compare intakes estimated from an FFQ with intakes measured more accurately by a different dietary instrument (reference measure) can be used to evaluate the performance of an FFQ and allow estimation of correction factors to adjust the observed diet–disease associations so they are more likely to reflect the true association( Reference Kaaks 3 – Reference Kipnis, Carroll and Freedman 6 ). These studies are usually based on a sub-sample of participants from the main study. The ‘validity coefficient’, a measure of the correlation between the questionnaire and ‘true intake’, is important in evaluating questionnaires and the calculation of sample size( Reference Thompson, Kipnis and Midthune 7 ). The regression calibration method( Reference Rosner, Willett and Spiegelman 8 ) can be used to adjust relative risks in a diet–disease association in the main study where intakes have been measured by an FFQ; a ‘calibration coefficient’ (also called a ‘correction factor’ or ‘attenuation factor’) is obtained from the regression of the reference data for an individual nutrient v. the questionnaire data as a measure of how much the true magnitude of a diet–disease association is attenuated by dietary measurement error( Reference Freedman, Schatzkin and Thiebaut 9 ). These calibration coefficients can then be used to correct the observed relative risks from the main study. Ideally, calibration should use a reference method which has errors that are not correlated with true intake or with the FFQ errors, requirements not generally met by other self-reported dietary instruments. Recovery biomarkers are considered an appropriate reference method for calibration for which measurement modelling assumptions are plausible, but at present there are relevant biomarkers for only a few nutrients( Reference Prentice, Tinker and Huang 10 ). Despite the shortcomings of using a second self-reported dietary instrument as the reference method, Freedman et al.( Reference Freedman, Schatzkin and Midthune 4 ) acknowledge that they can still be useful if there is no alternative. The European Prospective Investigation into Cancer and Nutrition (EPIC) conducted a calibration study involving 8 % of the total sample (36 994 participants) who completed an FFQ once and also completed a single standardised 24HR( Reference Slimani, Kaaks and Ferrari 11 ). These calibration coefficients have since been used in several EPIC studies to adjust diet–disease associations and tended to strengthen existing associations, but had little effect on hazard ratios that were close to unity (i.e. after correction for measurement error the change in magnitude of the hazard ratios was larger where positive or inverse associations had been observed but there was little change in magnitude for hazard ratios close to 1)( Reference Gonzalez, Jakszyn and Pera 12 – Reference Norat, Bingham and Ferrari 15 ). If calibration data are not available in the study cohort, it is recommended that data from another similar cohort are used( Reference Freedman, Schatzkin and Midthune 4 ).
We conducted a calibration and validation study using multiple 24HR and biomarkers within an Australian cohort to provide information on the measurement error properties of the FFQ used in follow-up of the cohort which will subsequently be made available to other researchers in Australia. The aims of the current study were: (i) to assess the reliability of the FFQ; (ii) to use the 24HR data to provide validity coefficients that can be used in designing future studies and to calculate calibration coefficients for a range of nutrients; and (iii) to illustrate with an example the effect of calibration on a diet–disease association.
Methods
Study sample
The Melbourne Collaborative Cohort Study (MCCS) is a prospective cohort study of 41 514 people (17 045 men, 24 469 women) recruited between 1990 and 1994 aged 27 to 80 years (99·3 % aged 40–69 years). Southern European migrants to Australia (5430 Italians and 4526 Greeks) were oversampled to extend the range of lifestyle exposures and to increase genetic variation. The MCCS study protocol and participants have been described in detail elsewhere( Reference Giles and English 16 ). Between 2003 and 2007 a comprehensive follow-up study was conducted which was attended by 68 % of the original participants, who completed at least one part of the follow-up (core questionnaire, FFQfu, or a clinic for blood collection).
The Dietary Calibration Study (DCS), a sub-study of the MCCS, was set up to calibrate and validate the FFQfu used at the follow-up visit. A sample size for the DCS of 750 people, with three 24HR and two FFQ, was estimated using formulas proposed by Wong and Day( Reference Wong and Day 17 ) (see Appendix 1 for details). This sample size was increased to 900 to allow for the measurement of intakes of less commonly eaten foods. Assuming a 50 % response fraction, it was proposed to invite approximately 1800 people to participate in the DCS.
At the time of selecting the DCS sample (January 2007), there were 26 918 participants who had completed a part of an MCCS follow-up study. Participants were excluded if they were aged <50 years or >75 years, or were not born in Australia, Greece or Italy. Participants who had died since the follow-up visit, wanted to withdraw from the study, refused to be contacted again or reported poor health at the follow-up were also excluded from the sampling process. Further, participants who had been repeatedly contacted for participation in the follow-up survey (a random selection of 12 000 MCCS participants) were also excluded to reduce participant burden, leaving 13 130 eligible for selection. We selected a stratified random sample of 1799 people (860 men and 939 women), with strata determined by sex, country of birth (Australia, Italy or Greece) and age (50–59 years, 60–75 years). Equal numbers were selected from each stratum except for Greek-born participants, where the eligible sample sizes were smaller (so these were all invited to participate). A further twenty-eight men (prostate cancer cases) were excluded after the sample selection, as they were already participating in another MCCS study; one other person was excluded as they did not have any MCCS data. Thus, 1770 people (832 men and 938 women) who attended the follow-up survey were invited to participate. Of these, 965 consented to participate in the DCS.
Study protocol
Participants initially completed a consent form, a form to indicate general availability for the 24HR and a self-administered physical activity questionnaire if English was their preferred language. Greek- and Italian-speaking participants completed the questionnaire over the telephone in their preferred language.
The FFQ was administered at the beginning of the study period (FFQ1) and again approximately 12 months later (FFQ2). These were self-completed by English-speaking participants and conducted over the telephone for those with limited English. Three dietary recalls (24HR1, 24HR2, 24HR3) were administered by telephone by trained interviewers during this 1-year period using a standardised interview format from Xyris Software (Highgate Hill, Queensland, Australia). A minimum of 6 weeks between recalls was required to cover seasonal variation. The recall data were collected using a multiple-pass method developed by the US Department of Agriculture for its surveys( Reference Conway, Ingwersen and Vinyard 18 ). This consisted of: (i) a quick run through of all foods and beverages consumed in the previous 24 h; (ii) considering foods commonly forgotten; (iii) collecting data on the time of consuming each item; (iv) collecting detailed descriptions of the food/beverages consumed and the amount; and (v) probing to collect extra information such as whether milk and sugar was added to tea or coffee. Participants were sent booklets with food photographs, pictures of different sized household items (bowls, cups, plates) and other scales aimed at assisting in determining portion size.
The FFQ consisted of 131 items categorised as cereal-based foods, dairy, meats, fish, fruit, vegetables, vitamins, margarine, oils and miscellaneous foods. Frequency responses were: (i) ‘never’; (ii) ‘less than once per month’; (iii) ‘1–3 times per month’; (iv) ‘1 time per week’; (v) ‘2 times per week’; (vi) ‘3–4 times per week’; (vii) ‘5–6 times per week’; (viii) ‘1 time per day’; (xi) ‘2 times per day’; and (x) ‘3 or more times per day’. Oil consumption was estimated on a family basis and then divided by the number of family members. The FFQ also included six sets of three images of food portion sizes, which were used to determine a usual portion size for each participant. For those participants who completed the dietary questionnaire over the telephone, copies of these pictures were provided prior to completion. A separate set of questions was used to collect information on the frequency and volume of consumption of alcohol beverages: wine, beer and spirits.
To calculate nutrient intakes per day from the FFQ, average portion sizes derived from the dietary recall data were assigned to each food item and daily frequencies of some fruits were seasonally adjusted. Intakes of fruits and vegetables were adjusted using the reported number of total fruit and vegetable servings per day, respectively. Foods showing larger between-person variation in portion size, determined by the 24HR, were scaled using a portion size factor derived from the six portion size photograph questions from the FFQ. Nutrient composition data were derived from NUTTAB 2010( 19 ) and AUSNUT 2007( 20 ); the US Department of Agriculture database( 21 ) was used to calculate carotenoid intakes. Weighted means of nutrient composition for FFQ items were calculated with reference to the consumption data from the recalls; for example, the nutrient content for the item ‘Beef or veal’ on the FFQ was determined by finding all the items listed in the recalls that included the word ‘beef’ or ‘veal’ in the description and matching these with AUSNUT items, then creating an average weighted by the portion and frequency of consumption. Mean daily nutrient intakes were obtained by multiplying the daily frequency of each food item by the nutrient composition for an average portion size. Nutrient intakes per day were calculated from the dietary recalls by Xyris using AUSNUT 2007. Retinol, provitamin A, folate and niacin were expressed as retinol equivalents, β-carotene equivalents, dietary folate equivalents and niacin equivalents, respectively( 20 ).
For the reliability study, participants with missing data for either FFQ1 or FFQ2 were excluded. For the validation study, participants with missing data for any of the 24HR or the FFQ2 were excluded. The mean of the three 24HR was used as our reference method.
At baseline, information was collected on country and date of birth and height was measured. At the MCCS follow-up, weight was measured; these data were used for the current analysis. The study protocol was approved by The Cancer Council Victoria’s Human Research Ethics Committee.
Statistical methods
Energy density for protein (i.e. the percentage of energy attributable to protein) was calculated assuming protein contains 17 kJ of energy per gram. Similarly, energy densities for fat and carbohydrate were calculated assuming they contain 37 and 17 kJ of energy per gram, respectively. For all other nutrients, nutrient densities were calculated per 1000 kJ of energy. Observations above or below the upper or lower quartile value, respectively, by an amount >|3 × interquartile range| for each log-transformed absolute nutrient (FFQ1, FFQ2 or FFQfu) or for each log(mean of absolute nutrient from the three 24HR) in separate sex and country of birth strata were identified from box-and-whisker plots. Outliers were identified for all sources of nutrient data used in particular analyses. Thirteen outliers were excluded from our analyses that used complete data from FFQ2 and all three 24HR (Australian-born: two men, five women; Greek/Italian-born: one man, five women). Nine outliers were excluded from analyses that used complete data from both FFQ1 and FFQ2. For analyses that used the whole of the MCCS follow-up sample with nutrient data derived from FFQfu, 146 outliers were excluded.
FFQ data were compared with the reference data from the 24HR by calculating medians and interquartile ranges for the twenty-three nutrient intakes from FFQ2 and for the mean of the three 24HR. The reliability or repeatability of the FFQ was assessed by calculating intraclass correlation coefficients (ICC) between log-transformed absolute nutrients from FFQ1 and FFQ2, separately by country of birth. This was repeated for log-transformed nutrient densities.
Calibration coefficients (correction factors) were obtained from the slope of the linear regression of the log(mean of absolute nutrient from the three 24HR) v. the corresponding log(absolute nutrient from FFQ2), adjusting for sex, age (<60, 60–69, ≥70 years) and BMI at follow-up (<25, 25–<30, 30–<35, ≥35 kg/m2), separately by country of birth( Reference Rosner, Willett and Spiegelman 8 ). This process was repeated to estimate calibration coefficients for log-transformed nutrient densities. Smaller calibration coefficients indicate a larger measurement error in the FFQ estimate of a nutrient, resulting in greater attenuation of a risk estimate in a diet–disease association.
Influential observations were identified using the dfbeta statistic obtained after fitting these regression calibration models. Observations (individuals) were considered to be influential if |dfbeta| >0·5 for at least two different nutrients. Three Australian-born and one Italian-born participant were identified as having influential observations; these were excluded, the regression calibration models were re-fitted and the calibration coefficients were estimated from these models.
Validity coefficients (VC) were calculated using estimates obtained from a structural equation model, after excluding outliers and influential observations identified from the regression calibration models (see Appendix 2). The structural equation model included separate equations relating FFQ2 and each of the three 24HR to true intake (using log-transformed absolute nutrients and then repeated using the log-transformed nutrient densities). The closer the VC to unity, the closer the intake estimated by the FFQ is to ‘true’ intake.
For the validity coefficient and calibration coefficient analyses, we used the second FFQ, which was administered at the end of the 12-month data collection period for the DCS, as this coincided with the period covered by the three 24HR.
Data from the MCCS follow-up were used to illustrate the effect of correcting for measurement error in the FFQfu. Daily K intake was estimated from the FFQfu using the same method as used to estimate daily nutrient intakes from the FFQ for the DCS. Mortality status was assessed at 30 June 2014 as our death data were complete up to this date. Logistic regression models were fitted to estimate the risk of death associated with log-transformed K density (adjusting for age, sex and BMI). Odds ratios are presented comparing the 10th and 90th percentiles of K intake. The calibration coefficient, λ, for log-transformed K density from the DCS analyses was used to correct the odds ratio (ORu) obtained from the logistic regression model, i.e. corrected ${\mathop{\rm OR}\nolimits} _{{\mathop{\rm c}\nolimits} } \,\,{\equals}\,\,{\mathop{\rm OR}\nolimits} _{{\mathop{\rm u}\nolimits} }^{{1\,/\,\lambda }} $
, thus a smaller calibration coefficient has a larger effect on the OR. Confidence intervals for the corrected odds ratios were computed using the %BLINPLUS macro in SAS(
Reference Logan and Spiegelman
22
) (version 8).
${\mathop{\rm OR}\nolimits} _{{\mathop{\rm c}\nolimits} } \,\,{\equals}\,\,{\mathop{\rm OR}\nolimits} _{{\mathop{\rm u}\nolimits} }^{{1\,/\,\lambda }} $
, thus a smaller calibration coefficient has a larger effect on the OR. Confidence intervals for the corrected odds ratios were computed using the %BLINPLUS macro in SAS(
Reference Logan and Spiegelman
22
) (version 8).
All analyses are presented separately by country of birth; there was little difference between men and women, so these have been combined. Statistical analyses were performed using the statistical software package Stata/MP 14.0.
Results
Appendix 3 shows how the final sample sizes were determined. Of the 965 participants who consented to the DCS, 959 completed FFQ1 and 859 completed FFQ2. Of these, the following exclusions were made: missing >10 FFQ items (FFQ1, FFQ2: n 10, n 1); missing all portion size responses (n 136, n 4); missing ≥3 food portion size responses (n 3, n 0); missing some non-specific FFQ food data such that nutrients could not be calculated (n 89, n 76); missing non-alcoholic beverage data (tea, herbal tea, coffee and coffee substitute; n 1, n 1). This left 720 participants from FFQ1 and 777 from FFQ2 with nutrient intakes available from food and non-alcoholic beverages. Of the 959 participants who completed the beverage component of FFQ1, 195 had incomplete alcohol data, leaving 764 participants with nutrients calculated from alcoholic beverages. Similarly, of the 859 participants who completed the beverage component of FFQ2, 129 had incomplete alcohol data, leaving 730 participants with nutrients calculated from alcoholic beverages. Nutrient intakes from food, non-alcoholic and alcoholic beverages (i.e. both the food and beverage components) were available for 600 participants from FFQ1 and 668 from FFQ2; 468 participants had nutrient data from both FFQ1 and FFQ2. For the dietary recalls, the numbers of participants responding were 904 (887 with valid nutrient data) for 24HR1, 882 (870 with valid nutrient data) for 24HR2 and 864 (814 with valid nutrient data) for 24HR3; 814 participants had nutrient data from all three dietary recalls. After excluding thirteen outliers, nutrient data from FFQ2 and all three 24HR were available for 619 participants. A further four influential observations were removed, thus 615 participants were used in the validity coefficient and regression calibration analyses. After removing nine outliers, 459 participants were used to calculate ICC from nutrient data from both FFQ1 and FFQ2. The MCCS follow-up sample had 24 948 participants (75 % Australian-born, 25 % Italian or Greek-born) with nutrient data derived from the FFQfu; after excluding 146 outliers and those with missing confounder data (n 327), 24 475 participants were available for analyses including 2736 who died.
Australian-born participants in the DCS had a lower BMI, a higher education level and had a lower percentage of men compared with those born in Greece or Italy (Table 1). The mean age at the follow-up visit of DCS participants was 61 years.
Table 1 Baseline characteristics of participants from the Dietary Calibration Study of the Melbourne Collaborative Cohort Study
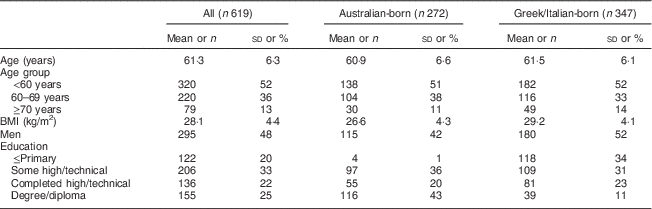
Continuous variables (age, BMI) are presented and mean and sd; categorical variables as n and %.
Table 2 shows the medians and interquartile ranges of the nutrient intakes estimated from FFQ2 and the three 24HR, separately by country of birth. Greek- or Italian-born participants had higher median energy intake estimated from FFQ2 compared with the 24HR (8750 v. 7852 kJ, respectively), in contrast to Australian-born (8217 v. 8549 kJ, respectively). Fat intakes estimated by FFQ2 were higher compared with the 24HR, as was carbohydrate for Greek- or Italian-born participants. In general, micronutrient intakes were more similar across methods for Greek- or Italian-born compared with Australian-born.
Table 2 Medians and interquartile ranges (IQR; 25th percentile–75th percentile) of daily absolute nutrient intakes, measured by the second FFQ (FFQ2) and the mean of three 24 h recalls (24HR), for participants from the Dietary Calibration Study of the Melbourne Collaborative Cohort Study

ICC (Table 3) were high across all absolute nutrients, ranging from 0·66 (β-carotene equivalents) to 0·80 (riboflavin) for Australian-born and from 0·51 (PUFA) to 0·74 (dietary folate equivalents) for Greek- or Italian-born. ICC for absolute and nutrient densities were generally similar except for intakes of protein, Zn and niacin equivalents, which were stronger for absolute nutrients compared with nutrient densities for Greek- or Italian-born. ICC between the two FFQ were generally higher for all nutrients among Australian-born compared with Greek- or Italian-born (Table 3).
Table 3 Intraclass correlation coefficients (ICC) and 95 % confidence intervals for nutrient intakesFootnote * between the first (FFQ1) and second FFQ (FFQ2) for participants from the Dietary Calibration Study of the Melbourne Collaborative Cohort Study

* Log(nutrient).
For absolute nutrients, VC estimated from the structural equation model ranged from 0·37 (Fe) to 0·73 (Ca) for Australian-born and from 0·28 (MUFA) to 0·64 (dietary folate equivalents) for Greek- or Italian-born (Table 4). For Australian-born, VC were low for niacin equivalents (0·44), protein, MUFA and retinol equivalents (all 0·45). For Greek- or Italian-born, VC were low for fat (0·29), saturated fat and protein (both 0·37), and PUFA and cholesterol (both 0·38). For nutrient densities, VC ranged from 0·46 (MUFA) to 0·83 (Ca) for Australian-born and from 0·21 (Na) to 0·64 (riboflavin) for Greek- or Italian-born. For Australian-born, VC from nutrient densities were also high for Na (0·82), P (0·76), K and cholesterol (both 0·75) and low for retinol equivalents (0·47). For Greek- or Italian-born, VC were also relatively high for Ca (0·60), thiamin (0·53) and Mg (0·51) and low for protein (0·30), Zn (0·32), niacin equivalents (0·35) and Fe (0·38). VC estimated from nutrient densities were consistently higher for Australian-born compared with Greek- or Italian-born, except for MUFA where they were very similar. For Australian-born, VC estimated from nutrient densities were higher than those estimated from absolute nutrients but no consistent pattern was observed for Greek- or Italian-born participants.
Table 4 Validity coefficients (VC)Footnote * and 95 % confidence intervals for absolute nutrient intakes and nutrient densities among participants from the Dietary Calibration Study of the Melbourne Collaborative Cohort Study

* From a structural equation model using log(nutrient from FFQ2) and log(nutrient from 24HR1), log(nutrient from 24HR2) and log(nutrient from 24HR3), where FFQ2=second FFQ, 24HR1=first of three 24 h recalls (24HR), 24HR2=second of three 24HR and 24HR3=third of three 24HR.
For absolute nutrients, calibration coefficients obtained from the slope of the linear regression models ranged from 0·25 (Fe) to 0·60 (saturated fat) for Australian-born and from 0·27 (protein) to 0·53 (riboflavin) for Greek- or Italian-born (Table 5). For nutrient densities, calibration coefficients ranged from 0·39 (retinol equivalents) to 0·74 (Mg) for Australian-born and from 0·18 (Zn) to 0·54 (riboflavin) for Greek- or Italian-born. Calibration coefficients from nutrient densities were higher for Australian-born compared with Greek- or Italian-born for all nutrients except for MUFA, where they were the same. For Australian-born, calibration coefficients for nutrient densities were higher than for absolute nutrients for all nutrients, except Ca and retinol equivalents where they were very similar; no consistent pattern was observed for Greek- or Italian-born participants.
Table 5 Calibration coefficients (CC)Footnote * and 95 % confidence intervals for absolute nutrient intakes and nutrient densities among participants from the Dietary Calibration Study of the Melbourne Collaborative Cohort Study

* From the slope of the linear regression of log(mean nutrient from three 24HR) v. log(nutrient from FFQ2), adjusted for sex, age and BMI, where 24HR=24 h recall and FFQ2=second FFQ.
An inverse association was found between mortality and K density estimated from the FFQfu (data not shown) which was statistically significant for Australian-born (ORu=0·60; 95 % CI 0·49, 0·73) comparing the 10th and 90th percentiles of K intake (2107 and 4662 mg/d, respectively), but not for Greek- or Italian-born (ORu=0·85; 95 % CI 0·64, 1·13). Using the calibration coefficients for K density from Table 5, λ=0·67 (Australian-born) and 0·29 (Greek/Italian-born), the corrected OR are ORc=0·47 (95 % CI 0·31, 0·90) and ORc=0·56 (95 % CI 0·16, 1·99) for Australian-born and Greek- or Italian-born, respectively.
Discussion
The FFQ used in the MCCS follow-up had good repeatability, but overestimated several nutrients compared with the 24HR. For Australian-born participants, the VC for nutrient densities were higher than those for absolute nutrient intakes. This was not the case for the Greek- or Italian-born participants. For Australian-born, VC based on nutrient densities were moderate to high and generally higher than for Greek- or Italian-born. Assessed according to the VC, the FFQ performed reasonably well across most nutrient densities for Australian-born (VC > 0·5), with MUFA and retinol equivalents just under this. Calibration coefficients for MUFA, thiamin and retinol equivalents were about 0·4, implying that a true relative risk of 2 would be observed as 20·4=1·32. For other nutrients calibration coefficients were closer to 1, implying attenuation was less. For Greek- or Italian-born participants the FFQ did not estimate intakes as well, with VC for nutrient densities <0·5 for all but fibre, PUFA, Ca, Mg, thiamin, riboflavin and dietary folate equivalents. This was reflected by calibration coefficients of 0·4 or below for most nutrients.
Both the MCCS and DCS included those born in Australia, Greece and Italy which increased the heterogeneity in reported diet and enabled us to evaluate the performance of the FFQ by country of birth. The poorer performance of the FFQ in Greek- or Italian-born participants might be partly attributed to their lower level of education( Reference Freedman, Commins and Moler 23 , Reference Freedman, Commins and Moler 24 ) and their limited English, although these factors would likely impact similarly on both the 24HR and the FFQ. In an assessment of an earlier FFQ used at baseline in the MCCS, repeatability for frequency responses was poorer in the southern European migrants, but VC were not computed( Reference Ireland 25 ). In the earlier FFQ the same average serving size was assigned to each food irrespective of country of birth, but this was shown to miss important variation in serving size by country of birth; the current FFQ includes portion size pictures to capture some of the between-individual variation. However, it is possible that the information collected does not fully account for differences in portion size between those born in southern Europe and Australia. It is also possible that the way oil intake is assessed by household in the FFQ is more accurate for Australian-born participants than for those born in southern Europe, contributing to overestimation of energy, fat and monounsaturated fat by the FFQ for this subgroup.
BMI has been associated with under-reporting of energy intake relative to estimates based on BMR( Reference Heerstrass, Ocke and Bueno-de-Mesquita 26 ). The southern European participants in our study had a higher mean BMI than those born in Australia and Lissner et al. ( Reference Lissner, Troiano and Midthune 27 ) showed using data from the OPEN study that 24HR perform better in non-obese than obese but this difference was not present for the FFQ. This may also contribute to the differences in validity and attenuation observed between those born in southern Europe and Australia.
Our final DCS sample size used in the analysis was reduced due to a large amount of missing data for portion size and alcohol consumption. Overall, those included in our ICC, VC and calibration coefficient analyses were more likely to be Australian-born, younger and with a lower BMI, compared with those who were actually invited to participate in the DCS. Australian-born participants included in our analyses were more likely to be female whereas Greek- or Italian-born participants were more likely to be younger and male compared with those invited. Validation studies are very intensive and only the motivated are more likely to complete all parts of them. Thus the performance of the FFQ to estimate intakes for our validation sample might be better in the present study compared with the general population.
We found little difference between men and women in the validity and calibration coefficients so have presented combined results. However, several other studies have reported findings for men and women separately. In a calibration sub-sample of the National Institutes of Health–American Association of Retired Persons (NIH–AARP) Diet and Health Study, nutrient intakes estimated from the 124-item FFQ used in the study were evaluated using two 24HR as the reference instrument. For unadjusted nutrients the validity and calibration coefficients tended to be higher for men than women, however after energy adjustment the differences between men and women were reduced( Reference Thompson, Kipnis and Midthune 7 ). In the NIH–AARP study, validity coefficients for energy-adjusted nutrients ranged from 0·36 to 0·76, and the calibration coefficients from 0·24 to 0·68, which compared well with results of three other validation studies reviewed by the authors( Reference Carithers, Talegawkar and Rowser 28 – Reference Stram, Hankin and Wilkens 30 ) and are slightly lower than the ranges that we observed in Australian-born participants; although all these studies are likely to overestimate the validity of the test instrument. Among the Australian-born, intakes of retinol equivalents (defined as vitamin A expressed as retinol equivalents=retinol + β-carotene/6+α-carotene/12+cryptoxanthin/12) showed a poor correlation with the 24HR data and also had the lowest calibration coefficient. In a review of about 200 dietary validation studies, Cade et al.( Reference Cade, Burley and Warm 31 ) found that vegetable and vitamin A intakes showed the lowest correlation between the test FFQ and the dietary reference methods and noted this may be associated with the inclusion or exclusion of specific vegetables rich in provitamin A carotenoids. Beaton et al. ( Reference Beaton, Milner and McGuire 32 ) also noted that due to the wide variation in vitamin A contents among individual foods, and hence day-to-day variation in intake, it is difficult to assess ‘usual’ individual intake. In a comparison of FFQ with 7 d weighed food records it was also noted that the lowest validity coefficient and poorest agreement between means were seen for vitamin A( Reference Hodge, Patterson and Brown 33 ). This was attributable to the consumption of liver by two of the study participants on a single day in the diet diary. Liver was not included in the FFQ because it was infrequently consumed by the original population for which the questionnaire was developed. The National Nutrition Survey 1995 found organ meats and offal were the single most important source of retinol in Australian adults( Reference McLennan and Podger 34 ), but were consumed by few people.
The estimation of the validation and calibration coefficients requires that the reference instrument has errors uncorrelated with the FFQ and with true intake. Self-reported instruments such as 24HR have errors which are related to errors in the FFQ( Reference Kipnis, Subar and Midthune 35 ). The main sources of error in both the 24HR and the FFQ relate to memory, interpretation of questions, social desirability and perception of serving sizes, thus between-instrument errors are likely to be correlated. In this case we would expect validity to be overestimated. We used data from the 24HR to estimate average portion sizes for each food used in the FFQ and to identify which foods had portion sizes that varied the most between individuals. This might result in better agreement between methods than if we had used data from a different population. Sensitivity analyses (not reported) showed that, for protein and Na, both the calibration coefficient and VC were sensitive to small departures from the assumption of uncorrelated errors between instruments, given that other model assumptions held. Generally, the sensitivity analysis indicated that both the calibration coefficient and the VC would be overestimated when model assumptions did not hold. Recovery biomarkers provide an unbiased measurement of intake with errors that are independent of the errors in the FFQ and usual intake, and are therefore considered a better reference instrument. However, they are available for only a limited number of nutrients (i.e. energy, protein, K and Na). Data from the OPEN study demonstrated that using multiple 24HR as the reference instrument for energy-adjusted nutrients produced similar results to those using a recovery biomarker, particularly for men, and this approach continues to be recommended( Reference Freedman, Schatzkin and Midthune 4 ).
As an example of the use of the calibration coefficients in adjusting the OR for a diet–disease association we used the association between K intake and all-cause mortality in the MCCS. In the model that was not corrected for dietary measurement error, higher K intake was associated with reduced mortality risk for both those born in Australia and southern Europe, although the uncorrected OR (comparing the 10th and 90th percentiles of K intake) was stronger and significant only for those born in Australia. After correction using the calibration coefficient, the OR were more similar for Australian-born and Greek- or Italian-born participants and, as expected, further from unity than the uncorrected OR. The lower calibration coefficients for Greek- or Italian-born participants compared with Australian-born indicate that there is greater dietary measurement error for the former subgroup and this would be reflected in greater attenuation of risk estimates from diet–disease associations. The observed inverse association between K intake and mortality is consistent with a recent study that assessed K intake based on morning fasting urine samples from over 100 000 people in seventeen countries( Reference O’Donnell, Yusuf and Mente 36 ).
The calibration coefficients we have presented in the current paper could be used to adjust risk estimates associated with dietary intakes in similar populations. The value of the calibration coefficient depends on if and how dietary intake is transformed (e.g. logarithm, nutrient density) as well as the presence of covariates. Regression calibration has been shown to work well for linear and generalised linear models (including logistic and Poisson) and Cox proportional hazards regression(
Reference Fahey, Forbes and Hodge
5
,
Reference Carroll, Ruppert and Stefanski
37
). VC can be used to estimate the required sample size in diet–disease associations. If dietary intake is analysed in categories, the expression $RR_{Q} \,\,{\equals}\,\,RR_{T}^{{vc_{{QT}} }} $
can be used to calculate RR
Q
, which is the relative risk a study should be designed to detect if vc
QT
is the validity coefficient and RR
T
is the true relative risk(
Reference Kaaks, Ferrari and Ciampi
38
). For example, a true relative risk of 2 between upper and lower quantiles would be observed as
$RR_{Q} \,\,{\equals}\,\,RR_{T}^{{vc_{{QT}} }} $
can be used to calculate RR
Q
, which is the relative risk a study should be designed to detect if vc
QT
is the validity coefficient and RR
T
is the true relative risk(
Reference Kaaks, Ferrari and Ciampi
38
). For example, a true relative risk of 2 between upper and lower quantiles would be observed as $2^{{vc_{{QT}} }} $
where vc
QT
is the validity coefficient. Then the approximate sample size required should be calculated for a relative risk of
$2^{{vc_{{QT}} }} $
where vc
QT
is the validity coefficient. Then the approximate sample size required should be calculated for a relative risk of $2^{{vc_{{QT}} }} $
using standard methods(
Reference Freedman, Commins and Moler
23
,
Reference Kaaks, Ferrari and Ciampi
38
).
$2^{{vc_{{QT}} }} $
using standard methods(
Reference Freedman, Commins and Moler
23
,
Reference Kaaks, Ferrari and Ciampi
38
).
Conclusion
The FFQ used in the MCCS follow-up study estimated dietary intakes reasonably well for most energy-adjusted nutrients for Australian-born but not Greek- or Italian-born participants and alternative dietary assessment methods should be considered if dietary intake is to be measured in similar demographic groups. The calibration coefficients reported in the present study could be used to adjust risks in diet–disease associations in the MCCS and other similar Australian populations where study-specific calibration data are unavailable.
Acknowledgements
Acknowledgements: This study was made possible by the contribution of many people, including the original investigators and the diligent team who recruited the participants and who continue working on follow-up. The authors would also like to express their gratitude to the many thousands of Melbourne residents who continue to participate in the study. They would like to acknowledge the work of Elizabeth Williamson who contributed to the statistical aspects of this study and to Manuela Rigo who helped with the data collection. Financial support: Cohort recruitment was funded by VicHealth and The Cancer Council Victoria. This work was supported by infrastructure from The Cancer Council Victoria and grants from the National Health and Medical Research Council (209057, 1004233). The funders had no role in the design, analysis or writing of this article. Conflict of interest: None. Authorship: J.K.B., A.M.H., M.T.F., A.B.F., L.C.G. and J.A.S. were responsible for the design of the statistical analysis. A.M.H., J.A.S. and D.R.E. contributed to the design of the study. M.T.B. acquired the data. J.K.B. drafted the first version of the manuscript and did the analysis. All authors contributed to the interpretation of the results and the critical revision of the manuscript. Ethics of human subject participation: The study protocol was approved by The Cancer Council Victoria’s Human Research Ethics Committee.
Appendix 1
Design and sample size for the Dietary Calibration Study
To determine the design and sample size for the Dietary Calibration Study (DCS), expected values for the correlations between the errors of repeated measures on the test measures (i.e. the FFQ and the 24 h recalls (24HR)) and the validity coefficients between the true exposure (T) and the test measures are required. Assuming the parameter value estimates given below, the design included approximately 750 people, with three 24HR (R) and two FFQ (Q). This gave a relative precision of 15 % (i.e. a CV of 0·15) where the calibration coefficient for the FFQ was estimated to be 6·25 ( $1/vc_{{QT}}^{2} $
).
$1/vc_{{QT}}^{2} $
).
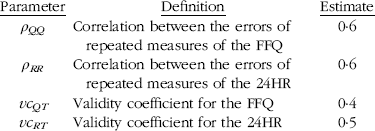
This design and sample size was calculated using the above values and the formulas given by Wong and Day( Reference Wong and Day 17 ). The higher the validity coefficient and the lower the correlation between errors of repeated measures, the more precise the estimate of the validity coefficient. Therefore, we chose moderate estimates for vc QT and vc RT and high estimates for ρ QQ and ρ RR . We chose to include more people (n 900) in order to measure the intakes of less commonly eaten items with better precision.
Appendix 2
Structural equation model
Equations (1) and (2) below define the relationships between the FFQ (Q i ), 24HR (R ij ) and the true (unknown) long-term dietary intake T i , where i represents the ith individual and j represents the jth measurement. In the DCS we have two FFQ (but only the FFQ administered at the end of the study period, FFQ2, has been used in these structural equations as this covers the same 1-year period as the 24HR) and three 24HR.
1×FFQ:
 $$Q_{i} \,{\equals}\,\alpha _{Q} {\plus}\beta _{Q} T_{i} {\plus}{\varepsilon}_{{Q_{i} }} $$
3×24HR:
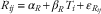 $$R_{{ij}} \,{\equals}\,\alpha _{R} {\plus}\beta _{R} T_{i} {\plus}{\varepsilon}_{{R_{{ij}} }} $$
Where α
Q
and α
R
are additive scaling biases in the FFQ and 24HR, respectively; β
Q
and β
R
are multiplicative scaling biases; ${\varepsilon}_{{Q_{i} }} $
and
${\varepsilon}_{{Q_{i} }} $
and ${\varepsilon}_{{R_{{ij}} }} $
are random errors;
${\varepsilon}_{{R_{{ij}} }} $
are random errors; $\sigma _{{{\epsilon}_{Q} }}^{2} $
and
$\sigma _{{{\epsilon}_{Q} }}^{2} $
and $\sigma _{{{\epsilon}_{R} }}^{2} $
are variances of the random errors; and
$\sigma _{{{\epsilon}_{R} }}^{2} $
are variances of the random errors; and $\sigma _{T}^{2} $
is the variance of true intake.
$\sigma _{T}^{2} $
is the variance of true intake.
With equations (1) and (2) there are ten parameters: μ
T
,
$\sigma _{T}^{2} $
, α
Q
, β
Q
,
$\sigma _{{{\epsilon}_{Q} }}^{2} $
, α
R
, β
R
,
$\sigma _{{{\epsilon}_{R} }}^{2} $
,
$\sigma _{{{\varepsilon}_{Q} {\varepsilon}_{R} }} $
and
$\sigma _{{{\varepsilon}_{{R_{k} }} {\varepsilon}_{{R_{l} }} }}$
, and six moment equations, so it is not identifiable.
The relevant moment equations for estimation of the validity and calibration coefficients are given by the reduced system:
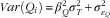
 $$Var(Q_{i} )\,{\equals}\,\beta _{Q}^{2} \sigma _{T}^{2} {\plus}\sigma _{{{\varepsilon}_{Q} }}^{2} $$
 $$Var(R_{{ij}} )\,{\equals}\,\beta _{R}^{2} \sigma _{T}^{2} {\plus}\sigma _{{{\varepsilon}_{R} }}^{2} $$
 $$Cov(R_{{ik}} ,R_{{il}} )\,{\equals}\,\beta _{R}^{2} \sigma _{T}^{2} {\plus}\sigma _{{{\varepsilon}_{{R_{k} }} {\varepsilon}_{{R_{l} }} }} $$
 $$Cov(Q_{{ik}} ,R_{{il}} )\,{\equals}\,\beta _{R} \beta _{Q} \sigma _{T}^{2} {\plus}\sigma _{{{\varepsilon}_{Q} {\varepsilon}_{{R_{l} }} }} $$
This system is identifiable with the following assumptions:
-
1. the multiplicative scaling bias in equation (2), $\beta _{R} \,{\equals}\,1$
;
$\beta _{R} \,{\equals}\,1$
; -
2. the correlated error between replicates of R,
$$\sigma _{{{\varepsilon}_{{R_{k} }} {\varepsilon}_{{R_{l} }} }} {\equals}\,0$$
; and -
3. the correlated error between Q and R,
$\sigma _{{{\varepsilon}_{Q} {\varepsilon}_{R} }} \,{\equals}\,0$
.

By estimating $\sigma _{T}^{2} $
, β
Q
and
$\sigma _{T}^{2} $
, β
Q
and $\sigma _{{{\varepsilon}_{Q} }}^{2} $
, we can estimate the validity coefficient:
$\sigma _{{{\varepsilon}_{Q} }}^{2} $
, we can estimate the validity coefficient:
 $$vc_{{QT}} {\equals}Corr(Q_{i} ,T_{i} ){\equals}\sqrt {{1 \over {1{\plus}(\sigma _{{{\epsilon}_{Q} }}^{2} \,/\,\beta _{Q}^{2} \sigma _{T}^{2} })}} $$
Appendix 3
Determination of the final sample sizes

MCCSfu, follow-up study of the Melbourne Collaborative Cohort Study; DCS, Dietary Calibration Study; FFQ1, first FFQ; FFQ2, second FFQ; 24HR, 24 h recall; 24HR1, first of the three 24HR; 24HR2, second of the three 24HR; 24HR3, third of the three 24HR.


