


Gender has long been a major determinant of health inequalities in low- and middle-income countries (LMIC), as a result of a combination of both sex-linked biology and gender-related social influences on health outcomes( Reference Okojie 1 – Reference Hammarstrom, Johansson and Annandale 4 ). Moreover, in some settings, the nutrition transition and the related growing burden of non-communicable diseases in recent decades has only exacerbated this gender gap in health, as the increase in overweight and obesity has been especially drastic among women, resulting in sizeable inequalities in excess adiposity by gender( Reference Popkin, Adair and Ng 5 , Reference Kanter and Caballero 6 ). The gender gap in obesity detrimental to women is all the more acute in contexts such as the Middle East and North Africa (MENA) region, especially in urban areas( Reference Kanter and Caballero 6 – Reference El Ati, Traissac and Delpeuch 8 ). However, the increase in nutrition-related non-communicable diseases in LMIC does not exclude the persistence of undernutrition phenomena, partly linked to micronutrient deficiencies, like anaemia, which is still highly prevalent in LMIC and to which women are especially prone worldwide( Reference Kassebaum, Jasrasaria and Naghavi 9 ). Thus, beyond gender inequalities in excess adiposity, it is of interest to assess how accounting for both these conditions may change the perspective on the consequences of the nutrition transition on gender inequalities in health.
A double burden of excess adiposity and anaemia can arise from their coexistence at country level in different sub-populations or even within the same households in different members. But it is all the more an issue when, in a given setting, a sizeable proportion of individuals experience both adverse conditions( Reference Delisle 10 ). Without strong assumptions relative to independent co-occurrence of both conditions in the same individuals, estimating the magnitude of such a within-subject type of double burden requires collecting all the relevant data on the same individuals during the same survey( Reference Zeba, Delisle and Renier 11 – Reference Cepeda-Lopez, Melse-Boonstra and Zimmermann 14 ). The within-subject double burden of excess body weight and anaemia has already been documented in some LMIC( Reference Eckhardt, Torheim and Monterrubio 15 , Reference Freire, Silva-Jaramillo and Ramirez-Luzuriaga 16 ); for example, in one woman out of four in urban settings in Tunisia and one out of ten in Morocco( Reference Gartner, El Ati and Traissac 13 ). However, to our knowledge, although gender inequalities in excess body weight have already been documented in the MENA region( Reference Kanter and Caballero 6 – Reference El Ati, Traissac and Delpeuch 8 ), the double burden of overweight and anaemia in LMIC has been studied mostly among women or with only very limited data on gender differences( Reference Zeba, Delisle and Renier 11 , Reference Gartner, El Ati and Traissac 13 , Reference Eckhardt, Torheim and Monterrubio 15 ).
Tunisia is a typical country in the region which today features high prevalences of non-communicable diseases including obesity, especially in urban areas( Reference El Ati, Traissac and Delpeuch 8 , Reference Gartner, El Ati and Traissac 13 , Reference Ben Romdhane, Ben Ali and Aissi 17 ). Tunisia has long been one of the most progressive countries of the MENA region regarding gender legislation( Reference Charrad 18 , Reference El Marzourgui, Ben Jaafar and Larayedh 19 ). But sociocultural values linked to the Arab–Muslim culture are still at the core of widespread traditions and social norms regarding women’s social and household roles in the MENA region( Reference Batnitzky 20 ). Gender inequalities in obesity are very high in Tunisia; for example, in the 35–70 years age range, women are almost four times more prone to obesity than men( Reference El Ati, Traissac and Delpeuch 8 ). Nevertheless, anaemia is still prevalent among women even in urban areas( Reference Gartner, El Ati and Traissac 13 , Reference El Ati, Lefevre and Beji 21 ). In this context, for a broader assessment of the influence of the nutrition transition on gender health issues, the objectives of the present work were to assess the magnitude of gender inequality vis-à-vis the double burden of excess adiposity and anaemia and its variations according to sociodemographic characteristics of the subjects or of the household.
Methods
Study design and subjects
Study area
Tunisia is a North African country with an upper middle level of development and two-thirds urbanization( 22 ). Our study area is the Greater Tunis region, the area around the capital grouping the four governorates of Tunis, Ariana, Ben Arous and Manouba, which comprises a quarter of the country’s population and is mostly urban or peri-urban, and also the most developed region.
Design and sampling
The target population for our study was adults of both genders aged 20–49 years. In the ‘Obe-Maghreb’ research project( Reference Gartner, El Ati and Traissac 13 ), a cross-sectional survey, carried out from March 2009 to January 2010, used a two-stage cluster sample of households( Reference Levy and Lemeshow 23 ): seventy-six census districts were sampled with probability proportional to size, then in each district twenty eligible households (i.e. featuring at least one woman aged between 20 and 49 years) were randomly selected and all individuals aged 6 months to 49 years old were included. We used the sub-sample comprising 20–49-year-old adults of both genders (excluding pregnant women).
Data collection
Data were collected by trained personnel using a standardized measurement protocol and questionnaire.
Measurements and derived variables
Sociodemographic characteristics
Place of residence was recorded as urban v. rural and as one of the four governorates of the Greater Tunis area (Table 1). Data on age, marital status and, for women, the number of children were collected during interviews. The level of education and the professional occupation of the subjects were recorded. The wealth of the household was assessed using an asset-based proxy derived from multivariate analysis of items pertaining to housing characteristics and ownership of appliances( Reference Howe, Galobardes and Matijasevich 24 , Reference Traissac and Martin-Prevel 25 ).
Table 1 Distribution of sociodemographic factors, by gender, among Tunisian adults (n 2619) aged 20–49 years, Greater Tunis area, 2009–2010
* Weighted proportions, taking sampling and post-stratification weights into account.
† P value for women v. men contrast.
‡ Asset-based household wealth score: increasing wealth from lower to upper tertile.
Anthropometry
Height was measured to the nearest 1 mm using a stadiometer (Person-check®, Kirchner & Wilhelm, Germany). Weight was measured to the nearest 100 g using calibrated scales (Detecto, USA). Waist circumference (WC) was measured to the nearest 1 mm using a flexible tape measure at the midpoint between the lower rib and the iliac crest( Reference Lohman, Roche and Martorell 26 ). BMI (=weight/height2)≥25·0 kg/m2 defined overweight and BMI≥30·0 kg/m2 obesity. For women, WC≥80 cm defined ‘increased risk abdominal obesity’ and WC≥88 cm ‘high risk abdominal obesity’; corresponding values for men were WC≥94 cm and WC≥102 cm, respectively( 27 ).
Hb
Fasting blood samples were collected into EDTA-coated tubes. Hb concentrations were determined in whole blood using a T540 automated Beckman Coulter counter. Anaemia was defined as Hb <120 g/l for women and <130 g/l for men( 28 ).
Double burden of malnutrition
We assessed four types of subject-level double burden of malnutrition: (i) overweight and anaemia (Ow&An); (ii) obesity and anaemia (Ob&An); (iii) increased risk abdominal obesity and anaemia; and (iv) high risk abdominal obesity and anaemia. In the analyses, these were coded as variables with four categories, for example: (i) overweight and anaemia; (ii) overweight only (i.e. overweight and no anaemia); (iii) anaemia only (i.e. no overweight and anaemia); and (iv) no overweight and no anaemia.
Data management and statistical analysis
Epidata 3·1 (2008) was used for data entry and validation, and the statistical software package Stata 13 (2013) for data management and analysis. The type I error risk was set at 0·05 (0·20 for interactions). All analyses took into account the sampling design as well as post-stratification on gender, age and place of residence, using svy Stata commands( Reference Korn and Graubard 29 ). Weighted estimates are presented with design-based standard error or a 95 % confidence interval.
Gender inequality measures in the framework of the multinomial logistic model
Gender inequalities for single and/or double burden were assessed in the framework of multinomial logistic models, using the double burden of malnutrition in four categories as response variables (for each double burden variable, the subjects featuring neither of the conditions was the response reference category). Hence the gender inequality measures were women v. men relative prevalence ratios (RPR), estimated by generalized logit regression models using the mlogit Stata command( Reference Hosmer and Lemeshow 30 ). Thus for example for Ow&An we computed gender inequality measures for overweight only, anaemia only, and both overweight and anaemia. Overall gender inequality measures (i.e. women v. men RPR over the whole population) were estimated from univariate multinomial logistic models, with gender as the only dependent variable. We then assessed how these inequalities might vary according to sociodemographic characteristics by analogy to what in the social sciences is referred to as ‘intersectional analysis’ (i.e. how gender intersects with other determinants regarding health issues( Reference Hammarstrom, Johansson and Annandale 4 )). For unadjusted analyses, for each covariate we fitted a bivariate model where the four-category response variable was modelled as a function of gender, covariate and gender × covariate; for adjusted analysis, the models included gender and covariate and gender × covariate terms for all covariates. As our main interest was in gender inequality measures, the gender × covariate interactions terms were then detailed by assessing the variation of the women v. men RPR inequality measure according to the categories of the covariates (i.e. assessing the modifying effect of covariates on the associations between gender and health outcomes)( Reference El Ati, Traissac and Delpeuch 8 , Reference Robinson, Gordon-Larsen and Kaufman 31 ), rather than the other possible symmetric interpretation of the same interaction terms (assessing the modifying effect of gender on the relationship between health outcomes and covariates)( Reference Jones, Hayter and Baker 32 ). Adjusted RPR were estimated based on marginal estimates of probabilities computed at the mean value of all other covariates using the margins command in Stata. As it was obviously not possible to fit our models including parity as a covariate (as it is not defined for men), possible confounding by parity was dealt with by performing the analyses separately for women with no children (v. all men) and other women (v. all men).
Double burden gender inequality measure factorization
The generalized logit multinomial model (i.e. RPR gender inequality measure) was emphasized for several reasons. The first was the possibility to assess single and double burdens of malnutrition gender inequalities within the same model. Second, the model has separate sets of intercept parameters and regression parameters for each category of the response variable so that there is no underlying assumption regarding the relative probability of each response category (i.e. does not include any assumption regarding whether or not excess adiposity and anaemia are independent); but it nevertheless features desirable consistency between estimates of single and double burden of malnutrition gender inequalities if that latter assumption happens to hold in the population. Regarding this latter point computations are presented in the following for overweight (Ow) and anaemia (An) as an example, using standard notations for conditional probabilities and logical operators. Under the assumption of conditional independence of the two types of malnutrition (i.e. for a given subject its probability of featuring anaemia does not depend on whether or not he/she is overweight), the probability of double burden P(Ow&An/G) factorizes as P(Ow&An/G)=P(Ow/G)P(An/G), where G is gender (i.e. W, women; M, men). In the multinomial generalized logit setting, i.e. when using overweight × anaemia in four categories (Ow & An, $Ow\ \&\, \overline{{An,}} $ $\overline{{Ow}} \,\&\,An,$ $\overline{{Ow}} \,\&\,\overline{{An}} $
) as the response variable, the probability of the response reference category (i.e. of featuring neither overweight nor anaemia)
$\overline{{Ow}} \,\&\,\overline{{An}} $
) as the response variable, the probability of the response reference category (i.e. of featuring neither overweight nor anaemia) $P(\overline{{Ow}} \,\&\,\overline{{An}} /G) $
can then also be expressed as
$P(\overline{{Ow}} \,\&\,\overline{{An}} /G) $
can then also be expressed as $P(\overline{{Ow}} \,\&\,\overline{{An}} /G)=P(\overline{{Ow}} /G)P(\overline{{An}} /G)$
. So that if RPR
(Ow&An)(Wv.M) is the measure of gender double burden inequality in the multinomial setting, i.e. the women v. men relative prevalence ratio of having both overweight and anaemia (v. having neither overweight nor anaemia), then, using standard notations:
$P(\overline{{Ow}} \,\&\,\overline{{An}} /G)=P(\overline{{Ow}} /G)P(\overline{{An}} /G)$
. So that if RPR
(Ow&An)(Wv.M) is the measure of gender double burden inequality in the multinomial setting, i.e. the women v. men relative prevalence ratio of having both overweight and anaemia (v. having neither overweight nor anaemia), then, using standard notations:
 $$\eqalignno{ RPR_{(Ow\,\&\,An)(Wv.M)}\cr\quad ={{P(Ow\,\&\,An/W)/P(\overline{{Ow}} \,\&\,\,\overline{{An}} /W)} \over {P(Ow\,\,\&\,An/M)/P(\overline{{Ow}} \,\&\ \overline{{An}} /M)}} \cr & ={{[P(Ow/W)P(An/W)]/[P(\overline{{Ow}} /W)P(\overline{{An}} /W)]} \over {[P(Ow/M)P(An/M)]/[P(\overline{{Ow}} /M)P(\overline{{An}} /M)}} \cr & ={{[P(Ow/W)/P(\overline{{Ow}} /W)]\,[P(An/W)/P(\overline{{An}} /W)]} \over {[P(Ow/M)/P(\overline{{Ow}} /M)]\,[P(An/M)/P(\overline{{An}} /M)]}} \cr & ={{\displaystyle\{ [P(Ow/W)P(\overline{{An}} /W)]/[P(\overline{{Ow}} /W)P(\overline{{An}} /W)]\} \atop \displaystyle\ {\times} \{ [P(An/W)P(\overline{{Ow}} /W)]/[P(\overline{{An}} /W)P(\overline{{Ow}} /W)]\} } \over {\displaystyle\{ [P(Ow/M)P(\overline{{An}} /M)]/[P(\overline{{Ow}} /M)P(\overline{{An}} /M)]\} \atop \displaystyle\ {\times} \{ [(P(An/M)P(\overline{{Ow}} /M)]/[P(\overline{{An}} /M)P(\overline{{Ow}} /M)]\} }} \cr & ={{[P(Ow\,\&\,\overline{{An}} /W)/P(\overline{{Ow}} \,\&\,\amp\,\overline{{An}} /W)][P(An\,\&\,\overline{{Ow}} /W)/P(\overline{{An}} \,\&\,\overline{{Ow}} /W)]} \over {[P(Ow\,\&\,\overline{{An}} /M)/P(\overline{{Ow}} \,\&\,\overline{{An}} /M)][P(An\,\&\,\overline{{Ow}} /M)/P(\overline{{An}} \,\&\,\overline{{Ow}} /M)]}} \cr & =RPR_{{(Ow)(Wv.M)}} RPR_{{(An)(Wv.M)}} $$
This means that, if the two conditions are independent, the double burden gender inequality measure can be expressed as the product of gender inequality measures for each health outcome separately (single burdens). As the model does not impose a priori constraints on the relative values of parameters for the different response variable categories, whether or not the factorization holds for observed measures of gender inequality depends only on whether or not this assumption holds in the population studied (and/or in specific subgroups). Data-based estimates of the single and double burden inequality measures can then be either close to that ‘reference’ factorization in case of independence, or not, depending on the data themselves; positive or negative synergy between excess adiposity and anaemia could result in $RPR_{{(Ow\,\&\,An)\left( {Wv.M} \right)}} $
being respectively either greater or less than the product of single burden gender inequality measures.
$RPR_{{(Ow\,\&\,An)\left( {Wv.M} \right)}} $
being respectively either greater or less than the product of single burden gender inequality measures.
It can be noted that this property would not hold using binary logistic models (i.e. coding the double burden of malnutrition as binary variables, e.g. Ow&An v. not). In this case, the double burden gender inequality measure would be the women v. men odds ratio of having both overweight and anaemia v. not (having both overweight and anaemia). In this framework, the probability of the response reference category $\overline{{Ow\,\&\,An}} $
(i.e. subjects who not simultaneously feature overweight and anaemia) is for any gender G
$\overline{{Ow\,\&\,An}} $
(i.e. subjects who not simultaneously feature overweight and anaemia) is for any gender G $ P(\overline{{Ow\,\&\,An}} /G)=1{\minus}P(Ow\,\&\,An/G)$
. Even under the assumption of conditional independence this generally cannot be factorized as [1 − P(Ow/G)][1 − P(An/G)], so that
$ P(\overline{{Ow\,\&\,An}} /G)=1{\minus}P(Ow\,\&\,An/G)$
. Even under the assumption of conditional independence this generally cannot be factorized as [1 − P(Ow/G)][1 − P(An/G)], so that $ OR_{{(Ow\,\&\,An)\left( {Wv.M} \right)}} =OR_{{(Ow)\left( {Wv.M} \right)}} OR_{{(An)\left( {Wv.M} \right)}}$
would not generally hold without even further assumptions.
$ OR_{{(Ow\,\&\,An)\left( {Wv.M} \right)}} =OR_{{(Ow)\left( {Wv.M} \right)}} OR_{{(An)\left( {Wv.M} \right)}}$
would not generally hold without even further assumptions.
Results
From the 1520 randomly selected households, 1689 women and 930 men were included, a response rate of respectively 89·5 % and 67·7 %. The mean age was 33·9 (sd 0·3) years for women; mean parity was 1·7 (sd 0·1) for all women (n 1689) and 2·8 (sd 0·1) among the parous women (n 1068). About two-thirds of the participants were married (Table 1). Men had a slightly higher level of education, but 53·0 % of the women had no professional activity v. only 7·0 % of men and only 9·9 % of women had upper level or intermediate level jobs v. 28·5 % of men.
Overall mean BMI was high, more so in women than in men (Table 2). Underweight (BMI<18·5 kg/m2) was rare among women (2·4 %; 95 % CI 1·6, 3·6 %) as well as men (3·9 %; 95 % CI 2·5, 5·9 %, P=0·093; detailed data not shown). Two-thirds of the women were overweight v. half the men, and a third of the women were obese v. less than one-sixth of the men. Prevalence of anaemia was much higher among women than men. Overall 13·6 % of the subjects featured Ow&An, but 24·1 % of women v. 3·4 % of men (Fig. 1), resulting in high gender inequality measures (Table 3), much higher than for overweight or anaemia separately (Table 3). One subject out of ten had Ob&An but with high gender inequalities (women 11·6 % v. men 1·1 %), much higher than for obesity or anaemia alone (Fig. 1, Table 3). Due to the higher gender contrasts in abdominal adiposity than in overweight or obesity, gender inequalities in abdominal obesity and anaemia were even higher than in OW&An or Ob&An (Table 3).
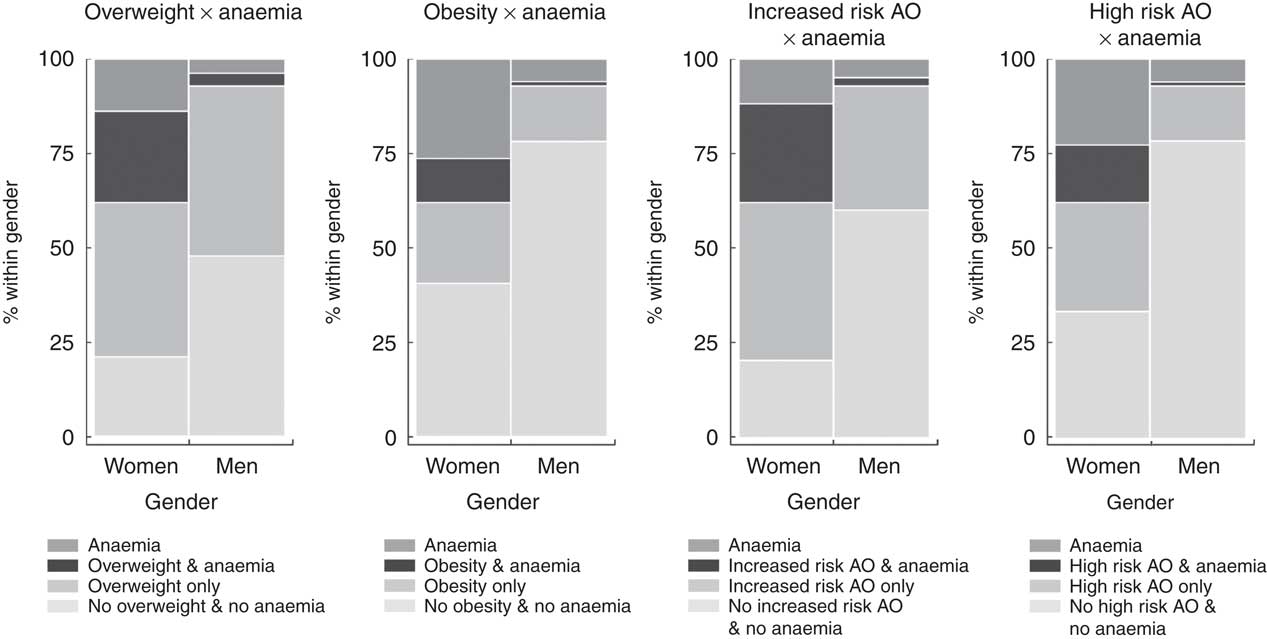
Fig. 1 Double burden of overweight and anaemia, obesity and anaemia, increased risk abdominal obesity (AO) and anaemia, and high risk abdominal obesity and anaemia, by gender, among Tunisian adults (women, n 1689; men, n 930) aged 20–49 years, Greater Tunis area, 2009–2010
Table 2 Anthropometry and Hb data, by gender, for Tunisian adults (n 2619) aged 20–49 years, Greater Tunis area, 2009–2010
* Mean for interval variables or prevalence proportion for binary variables (weighted estimates taking sampling and post-stratification weights into account) and standard error of estimates taking sampling design into account.
† P value for women v. men contrast.
‡ Waist circumference ≥94 cm for men, ≥80 cm for women.
§ Waist circumference ≥102 cm for men, ≥88 cm for women.
|| Hb<130 g/l for men, <120 g/l for women.
Table 3 Crude gender inequality measures for overweight, obesity, abdominal obesity, anaemia and their individual-level co-occurrence among Tunisian adults (n 2619) aged 20–49 years, Greater Tunis area, 2009–2010: multinomial logit model
* RPR: relative prevalence ratio of women v. men featuring the simple or double condition v. having neither one (multinomial logistic regression using individuals having neither condition as response reference category).
† 95 % CI, taking into account sampling design.
‡ Overweight: BMI≥25·0 kg/m2; obesity: BMI≥30·0 kg/m2.
§ Hb<120 g/l for women, <130 g/l for men.
|| AO, abdominal obesity. Increased risk AO: waist circumference ≥80 cm for women, ≥94 cm for men; high risk AO: waist circumference ≥88 cm for women, ≥102 cm for men.
Table 4 presents detailed results of variations in gender inequalities with co-factors for overweight, anaemia and Ow&An due to the sizeable prevalence of the latter. There was no variation in overweight, anaemia or Ow&An gender inequalities with place of residence. Gender inequalities in overweight increased strongly with age, while inequalities in anaemia tended to be higher among the younger subjects, so that there was no association of age with gender inequalities in Ow&An. Gender inequalities in Ow&An were stronger among married subjects than unmarried. Gender inequalities in overweight were lower among those with a professional activity, but not gender inequalities in anaemia or Ow&An. There was a decreasing gradient of gender inequalities in overweight with higher household wealth but not in anaemia or Ow&An. Gender inequality RPR were lower in nulliparous women (n 621) v. other women (n 1068) for overweight (0·9; 95 % CI 0·6, 1·2 v. 4·7; 95 % CI 3·5, 6·5), anaemia (7·3; 95 % CI 4·8, 11·3 v. 10·3; 95 % CI 6·2, 17·0) and Ow&An (4·3; 95 % CI 2·5, 7·4 v. 43·1; 95 % CI 26·4, 70·0). In these stratified analyses there was no adjusted residual variation of gender inequalities in Ow&An with marital status in either class of parity (detailed data not shown). Similar results were observed for increased risk abdominal obesity and anaemia regarding how gender inequalities varied with categories of covariates (detailed data not shown).
Table 4 Gender inequalities in overweight, anaemia, and overweight and anaemia, by place of residence and sociodemographic variables, among Tunisian adults aged 20–49 years, Greater Tunis area, 2009–2010: generalized logit multinomial regression (complete case analysis, n 2619)
* Versus response variable reference category: no overweight and no anaemia (overweight: BMI≥25·0 kg/m2, anaemia: Hb<130 g/l for men, <120 g/l for women).
† Weighted prevalence, taking into account sampling weights and post-stratification weights.
‡ Adjusted for all variables in column 1: multivariate model includes all main effects and interactions of covariates with gender.
§ RPR: crude or adjusted women v. men relative prevalence ratios of having the condition (v. no overweight and no anaemia) within category of covariate; adjusted RPR based on marginal estimates of probabilities computed at mean value of all other covariates.
|| 95 % CI, taking into account sampling design.
¶ Crude or adjusted P value for gender × covariate interaction: null hypothesis of identical gender contrasts (RPR) in all categories of covariate.
Discussion
In a typical nutrition transition setting in an urbanized and developed area in the MENA region, we found a large gender gap detrimental to women for excess adiposity and an even larger one for anaemia. Their combination at individual level resulted in a striking gender double burden of malnutrition inequality never previously documented. The gender inequality in excess adiposity showed a marked socio-economic gradient but not for anaemia or for the within-subject double burden of excess adiposity and anaemia.
Huge gender inequality in double burden of excess adiposity and anaemia
In a context of high prevalence of excess adiposity, we observed twice higher odds of overweight for women v. men (and three times higher for obesity). These marked gender inequalities, which are detrimental to women, were somewhat less marked than those observed in previous studies in the same region although in a different age range and at a national scale rather than in our mostly urban setting( Reference Atek, Traissac and El Ati 7 , Reference El Ati, Traissac and Delpeuch 8 ). For anaemia, the observed prevalence for women (consistent with previous studies( Reference El Ati, Lefevre and Beji 21 )) suggests a borderline ‘severe public health problem’ (≥40 %) v. a borderline ‘no public health problem’ (<5 %) for men according to WHO( Reference De Benoist, McLean and Egli 33 ). Indeed, the odds of anaemia were eight times higher in women than in men (with a similar gender gap for Fe-deficiency anaemia( Reference Gartner, El Ati and Traissac 13 , Reference Gartner, Berger and Bour 34 ): women 16 % v. men 2·4 %, RPR=8·4; 95 % CI 4·8, 14·5; detailed data not shown). These figures point to much higher gender inequality in anaemia in this specific setting even compared with the generally higher prevalence of anaemia among women v. men worldwide( Reference Kassebaum, Jasrasaria and Naghavi 9 ).
The double burden of malnutrition inequality resulting from the combination of within-subject excess adiposity and anaemia was huge as, for example, estimated in the multinomial framework, the odds of a double burden of overweight and anaemia were sixteen times higher in women than in men (with even higher gender inequalities in obesity and anaemia but with much lower overall levels of prevalence). External comparison of this specific issue of double burden inequalities with other countries is difficult as published data are scarce. In India, the subjects of the Hyderabad Nutrition Trial nevertheless also featured a higher prevalence of the double burden of overweight and anaemia among women v. men (9 % v. 1 %, respectively), although at much lower overall level mainly due to the much lower overall prevalence of overweight( Reference Jones, Hayter and Baker 32 ). In our setting, gender differences in malnutrition measured from the point of view of this double burden resulted in much higher values than when each type of malnutrition was measured separately. This should not be surprising as we showed that under the assumption of conditional independence of excess adiposity and anaemia, the estimate of our chosen RPR double burden gender inequality measures should be close to the product of the estimates of inequality measures for each separate condition. As for evidence in favour of or against this hypothesis, the risk of anaemia (especially Fe-deficiency anaemia) could be higher among more corpulent subjects due to the low quality of their high-energy diets, although in the same setting (albeit in a different age range) a modern diet was shown to be correlated with both higher energy and absolute Fe intakes( Reference Aounallah-Skhiri, Traissac and El Ati 35 ). Fe absorption could also be reduced in the case of excess adiposity( Reference Cepeda-Lopez, Melse-Boonstra and Zimmermann 14 ). Some authors have also suggested that the risk of anaemia could be increased in connection with low-grade inflammation due to excess adiposity, while other authors found no association( Reference Qin, Melse-Boonstra and Pan 12 , Reference Cepeda-Lopez, Aeberli and Zimmermann 36 , Reference Ausk and Ioannou 37 ). This issue is still an open question but which is beyond the scope of the present study, as it would warrant specific analyses not necessarily involving gender inequality issues. Nevertheless, and this is not constrained by the analysis model, but a feature of the data, our observed results are mostly consistent with this assumption of independence, underlining that women (v. men) are not protected from adverse conditions partly linked to undernutrition (such as anaemia) because of their much higher excess adiposity. This double burden would seem all the more to be fuelling gender inequalities in health to the disadvantage of women, as the two types of malnutrition may interact to also increase the risk of CVD( Reference Winther, Finer and Sharma 38 ).
If one combines the two indicators differently, it is also worth noting even higher proportions of subjects featuring at least one (instead of both) of the conditions and also with significant gender inequalities: for example, 78·8 % of women v. 52·2 % of men had either overweight or anaemia or both (P<0·0001), respectively 59·4 % v. 21·9 % (P<0·0001) for either obesity or anaemia or both (detailed data not shown).
Factors associated with gender inequalities in excess adiposity and anaemia
Gender inequalities in health usually result from complex interactions between sex-linked biology and gender-related social influences on health outcomes; in our case, with the additional complexity due the composite outcome we studied( Reference Krieger 3 ). For excess adiposity, we observed a strong socio-economic gradient of gender inequalities as we showed for instance for overweight that there were fewer gender inequalities in wealthier households and the fewest among subjects with a professional activity, although with almost no variation according to the level of education. This is consistent with the results of previous studies showing that a higher level of education is not sufficient if it is not translated into a professional activity outside the home. In fact, working outside the home seems foremost in promoting empowerment of women within and outside the household, and for more egalitarian households and social roles with beneficial associations towards less excess adiposity among women, through a variety of mediating factors (e.g. such as less sedentary behaviour, decreased food stimuli or slimmer body image models)( Reference El Ati, Traissac and Delpeuch 8 , Reference Batnitzky 20 , Reference Garawi, Devries and Thorogood 39 , Reference Tlili, Mahjoub and Lefevre 40 ). Indeed, it is striking that, in this population, despite rather similar levels of education, half the women had no professional activity as opposed to only a small percentage of the men (as in many countries of the MENA region). But other pathways to gender inequalities in excess adiposity are likely more related to sex-linked biology; for example, the documented greater increase in adiposity with age in women than in men, which we also observed( Reference Kimokoti, Newby and Gona 41 ). Likewise, the adiposity accumulation related to reproductive history (e.g. the increased gender gap in overweight we observed among parous women) obviously has biological roots but is also linked to social issues( Reference Krieger 3 , Reference Kim, Yount and Ramakrishnan 42 ).
For anaemia, we found much less variation in the very high gender inequality based on the factors studied: as prevalence is quite low among men, this result is in accordance with results of other studies, in this mostly urban North African setting, showing weak socio-economic patterning in anaemia among women only( Reference Gartner, El Ati and Traissac 13 , Reference El Ati, Lefevre and Beji 21 ), although this does not appear to be so in all LMIC( Reference Balarajan, Ramakrishnan and Özaltin 43 ). The very large gender inequality in anaemia could be due to gender differences in genetic Hb disorders, exposure and inflammation response to infectious diseases or adiposity-induced inflammation, or the adequacy of nutrient intake and absorption( Reference Gartner, Berger and Bour 34 , Reference Balarajan, Ramakrishnan and Özaltin 43 ), which are linked to both sex-linked biological differences and social gender issues. Generally, women appear not to be more prone to genetic Hb disorders than men( Reference Kassebaum, Jasrasaria and Naghavi 9 ). We observed a strong socio-economic gradient of gender inequalities in excess adiposity, which could be a major source of differences between men and women in inflammatory causes of anaemia in a context where infectious diseases are residual( Reference Gartner, Berger and Bour 34 ), all the more if, as suggested by some, women have more excess body fat for a given BMI( Reference Heo, Faith and Pietrobelli 44 ). Women, especially in our 20–49 years age range, are specifically more prone to Fe-deficiency anaemia than men, likely due to sex-linked biological differences related to reproductive life which result in higher requirements for Fe and other micronutrient intakes( 45 ). But whether these higher requirements are actually met mostly has to do with how these special needs are taken into account socially, which is not always the case; on the contrary, in some settings, intra-household food allocation discriminates against women and may affect gender differences in anaemia( Reference DeRose, Das and Millman 46 ). In our urban economically developed study area, we found no definitive evidence for either positive or negative discrimination regarding micronutrient-rich food( Reference Aounallah-Skhiri, Traissac and El Ati 35 ). Concerning factors that limit bioavailability in our context, for example tea drinking is widespread among women in Tunisia but appears to be even more so among men( Reference Aounallah-Skhiri, Traissac and El Ati 35 ).
We did not identify many specific factors of variation in gender inequality in Ow&An in our population. This is in accordance with the fact that gender inequality in anaemia (which, according to our factors, varied little) is a major component of inequality in Ow&An. For some factors, it could also be due their inverse trend of association with gender inequality in obesity and anaemia (e.g. for age). The only exception was higher gender inequality in Ow&An among married v. single participants, but we showed that this is likely due to confounding by parity. Beyond the within-population factors discussed above, it is also worth noting that in certain contexts (e.g. Western Europe) gender inequality in both excess adiposity and anaemia is much less marked, pointing to a variety of factors at country level including socio-economic or sociocultural factors and their interactions with biology( Reference Kassebaum, Jasrasaria and Naghavi 9 , Reference Garawi, Devries and Thorogood 39 , Reference Moss 47 ). Indeed, even though regarding women’s rights and legal status Tunisia is one of the most advanced countries of the MENA region, it is nevertheless in the lowest tertile of a gender gap index worldwide( Reference Charrad 18 , Reference Hausmann, Tyson and Zahidi 48 ).
Strength and limitations of the study
The cross-sectional design has a number of limitations, but our main exposure (gender) is likely not prone to reverse-causality bias. Despite the lower response rate for men (frequent in such contexts), as data on within-subject combined excess adiposity and anaemia are rare, one strength is being the first study to assess this issue based on a large random sample of both genders. A strength of our study is the detailed analyses of variations in gender inequalities with sociodemographic factors, by analogy to the concept of ‘intersectional analysis’ in qualitative studies( Reference Hammarstrom, Johansson and Annandale 4 ). A limitation is that the results of our study would need to be complemented by a more in-depth analysis of the underlying sociocultural causes of these marked double burden gender health inequalities using qualitative methods as done in a similar context but only for overweight-related issues( Reference Batnitzky 49 ).
Conclusion
In a typical nutrition transition setting, when the increase in excess adiposity and the persistence of anaemia are both taken into account, this transition appears to have resulted in gender health inequalities much higher than if one accounts only for the increase in adiposity; so that women face huge biological and gender-related hurdles regarding the negative consequences from both the over- and undernutrition point of view. There is thus a need both to challenge the social norms that underlie this gender double burden of malnutrition inequalities and to tackle the consequences of sex-linked biological determinants, with the added difficulty of simultaneously addressing excess adiposity and anaemia. Special attention also needs be paid to the interaction between gender-related issues and sex-linked biology, as successfully done for other health outcomes in the same setting( Reference Farhat, Chaouch and Chelli 50 ), so that women be positively discriminated in terms of their specific needs. This positive discrimination should be a priority: not only because women are at the centre of the intergenerational cycle of malnutrition so that this dual burden of malnutrition will impact the next generations of both women and men( Reference Osmani and Sen 51 ), but also for reasons of social justice and gender equity( Reference Hammarstrom, Johansson and Annandale 4 , Reference Marmot 52 ).
Acknowledgements
Financial support: This work was supported by the National Institute of Nutrition (INNTA) of the Ministry of Health, Tunis, Tunisia; the CORUS program (Coopération pour la Recherche Universitaire et Scientifique, contract number 6028-2) of the French Ministry of Foreign Affairs; and IRD (Institute of Research for Development), Marseille, France. The funders had no role in the study design, data collection and analysis, decision to publish, or writing of the manuscript. Conflict of interest: None. Authorship: J.E.A., F.D., A.G. and P.T. designed the study. J.E.A. and H.B.G. supervised data collection in the field. P.T. planned and performed data analysis, drafted the manuscript and had responsibility for the final content. All authors contributed to interpretation of the results and writing the manuscript. All authors have read and approved the manuscript. Ethics of human subject participation: This study was conducted according to the guidelines laid down in the Declaration of Helsinki and all procedures involving human subjects were approved by the Ethics Committee on Human Research of the National Institute of Nutrition, the Tunisian National Council of Statistics and the Ethical and Deontological Consultative Committee of the Institute of Research for Development. Informed consent was obtained from all subjects in writing or verbally when not possible otherwise (e.g. illiteracy, verbal consent was then witnessed and formally recorded). Data were analysed anonymously. The study was registered at clinicaltrials.gov as NCT01844349.


