


Most Americans do not eat enough fruits and vegetables( Reference Krebs-Smith, Guenther and Subar 1 ) in spite of the demonstrated benefits of consuming adequate amounts( 2 ). The Dietary Guidelines for Americans, 2010 encourage Americans to increase their intakes of fruits and vegetables to add important nutrients that are frequently lacking from their diets, reduce the risk of many leading causes of death and illness, and aid in healthy weight management by substituting fruits and vegetables for higher-energy foods( 2 ). However, in 2007–2010, among individuals aged ≥1 year, only approximately 13 % met the age- and sex-specific vegetable intake and 25 % met the age- and sex-specific fruit intake recommended in the US Department of Agriculture (USDA) Food Patterns( 3 ).
To date, little research has been done using nationally representative data on how people incorporate fruits and vegetables into their day( 4 – Reference Sandeno, Wolf and Drake 6 ), especially among those who consume amounts recommended by the USDA Food Patterns v. those who do not. Given this, in the present study we explored how US children (aged 2–18 years) and adults (aged ≥19 years) who consumed recommended amounts of fruits and vegetables on a given day incorporated fruits and vegetables into their diets, compared with those who did not, using nationally representative data from 2007 to 2010. We identified where (source), when (meal) and in what form(s) individuals consumed their fruits and vegetables among those who consumed recommended amounts on a given day v. those who did not.
Methods
We used data from the National Health and Nutrition Examination Survey (NHANES) 2007–2010 to estimate fruit and vegetable intakes among individuals aged ≥2 years. NHANES is a nationally representative survey of the non-institutionalized US population that is conducted in two-year cycles using a stratified multistage probability design. Details on the survey and sampling are described elsewhere( Reference Zipf, Chiappa, Porter and Ostchega 7 ). Respondents participated in a household questionnaire and a physical examination, including a 24 h dietary recall, at the mobile examination centre (MEC). Trained interviewers collected 24 h dietary recalls using the USDA automated multiple-pass method by proxy for those aged 1–5 years, with proxy assistance for those aged 6–11 years and directly from participants aged ≥12 years. A total of 20 686 individuals were interviewed and 20 015 completed a physical examination in the MEC. MEC response rates were 75·4 % and 77·3 % for NHANES 2007–2008 and 2009–2010, respectively. There were 17 571 individuals aged ≥2 years with 1 d of reliable 24 h recall data who participated in NHANES 2007–2010 and were included in analyses. All participants in NHANES provided written informed consent.
For all foods and beverages participants reported, we used USDA Food Patterns Equivalent Databases (2007–2008 and 2009–2010) to disaggregate each food and beverage item into its individual food components( 8 , 9 ). The total amounts of fruits and vegetables for each individual, in cup-equivalents, were summed across all foods and beverages that were reported. Cup-equivalents of fruits and vegetables consumed were calculated separately by the meal, source and form of each food item. Categories of meal, source and form were derived from survey responses. Of the twenty different types of eating occasion( 10 ), we classified foods and beverages into five meal categories: (i) breakfast; (ii) lunch; (iii) dinner; (iv) snack; and (v) other eating occasions such as brunch and drinking occasions. Of the twenty-three different source options( 10 ), we collapsed foods and beverages into four mutually exclusive categories: (i) retail (e.g. retail stores, mail order purchases); (ii) restaurants (e.g. restaurants, bars, street vendors, and sport, recreation or entertainment facilities); (iii) cafeterias (e.g. school and other institutional cafeterias, residential dining facilities, vending machines, common snack tray, childcare centre, family/adult day care centre); and (iv) other (e.g. soup kitchens or food pantries, Meals On Wheels, other community food programmes, home grown or gifted, and any other reported source). Lastly, of the sixteen different types of food and beverage combinations( 10 ), we collapsed foods and beverages into four mutually exclusive form categories: (i) raw/alone (e.g. whole or cut-up apple or carrots); (ii) a salad or sandwich ingredient; (iii) an ingredient in a fruit or vegetable mixed dish (e.g. salsa, hummus, tomato sauce on pizza or spaghetti); and (iv) all other forms.
Individuals were classified as consuming the recommended amounts based on the total cup-equivalents of fruits and vegetables consumed on the recall day. Recommended amounts (Table 1) ranged from 1 to 2 cup-equivalents of fruits and from 1 to 3 cup-equivalents of vegetables, were age- and sex-specific, and appropriate for individuals with less than 30 min of daily physical activity( 11 , 12 ). Ratios of means were calculated to compare the relative proportions of fruits and vegetables consumed at different meals, from different sources and in different forms among those who consumed recommended amounts v. those who did not. Ratios of means were estimated by dividing each group’s mean amount of fruit and vegetable intake from different meals, sources and forms by the group’s mean total fruit and vegetable intake. Ratio of mean estimates and P values for differences in the ratio of means using t tests for linear contrasts were calculated using PROC RATIO in the statistical software packages SAS 9·3·2 and SAS-Callable SUDAAN 10·1 to account for the complex sampling design. Analyses were conducted separately for those aged 2–18 years and those aged ≥19 years. Due to the number of statistical tests performed, a Bonferroni adjustment was used to set the significance level at 0·001.
Table 1 Intakes of fruits and vegetables, by age and sexFootnote *, recommended in the US Department of Agriculture Food Patterns
* These amounts are appropriate for individuals who get less than 30 min of moderate physical activity daily, beyond normal daily activities. Those who are more physically active may be able to consume more while staying within energy needs.
† One cup-equivalent is approximately equal to one small apple (149 g), eight large strawberries (144 g), twelve baby carrots (120 g) or one large tomato (182 g).
Results
Children who consumed the recommended amounts of fruits or vegetables ate or drank about an additional cup-equivalent each of fruits and vegetables compared with those children who did not consume the recommend amounts (Table 2). Adults who consumed the recommended amounts ate or drank an additional 2·5 cup-equivalents of fruits and 2·6 cup-equivalents of vegetables compared with those who did not consume the recommended amounts.
Table 2 Amounts of fruit and vegetables consumed by source, form and meal v. total intake (ratio of means) among those who met the fruit and vegetable intakes recommended by the US Department of Agriculture Food Patterns on a given day of recall v. those who did not meet the targets, National Health and Nutrition Examination Survey 2007–2010
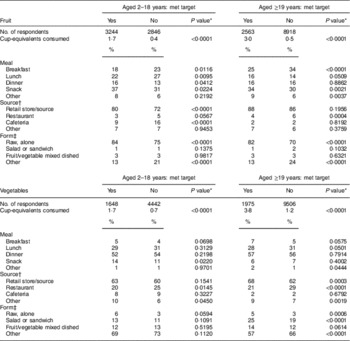
* P values for differences in the ratio of means using t tests for linear contrasts.
† Stores include retail stores and mail order purchases; Restaurants include restaurants, bars, street vendors, and sport, recreation or entertainment facilities; Cafeterias include cafeterias, residential dining facilities, vending machines, common snack tray, childcare centre, family/adult day care centre; Other sources include food assistance programmes, home grown or gifted, and any other reported sources.
‡ Form categories include: (i) raw and not an ingredient; (ii) an ingredient in a salad or sandwich; (iii) an ingredient in a fruit- or vegetable-based dish; and (iv) an ingredient in other types of mixed dish. Ingredient in a fruit or vegetable dish includes salsa, bean dips, guacamole and other dried bean vegetable, and fruit-based mixed dishes.
Meals
In general, the proportions of fruits and vegetables consumed at different meals were similar between those who consumed recommended amounts and those who did not. For example, among adults, 59–64 % of fruit was consumed during breakfast or as a snack regardless of whether or not these individuals met fruit recommendations on the day of recall. However, adults who did not consume recommended amounts of fruit reported consuming a larger share during breakfast (34 % v. 25 %, P<0·0001). Among all children, the largest share of fruit was consumed as a snack (31–37 %), followed by lunch (22–27 %) and then breakfast (18–23 %); however, children who consumed recommended amounts were not significantly different in their intake patterns from those who did not consume recommended amounts. For both adults and children, dinner was the meal in which the greatest proportion of vegetables was consumed (ranged from 52 to 57 %), regardless of whether they consumed recommend amounts or not.
Source
Among all adults, almost 90 % of fruit was obtained from retail stores (86–88 %). Most fruit for children came from retail stores as well (72–80 %); however, cafeterias accounted for 16 % of fruit intake for children who did not consume recommended amounts compared with 9 % for children who met recommendations (P<0·0001). Overall, retail stores and restaurants were the most commonly reported source for vegetables among both adults and children (retail, 60–68 %; restaurant, 20–29 %). A higher proportion of vegetables came from restaurants for adults who did not consume recommended amounts compared with adults who did meet recommendations (29 % v. 21 % respectively, P<0·0001).
Form
A higher proportion of fruit was eaten raw and alone (e.g. a raw, whole or sliced apple) among adults and children who consumed recommended amounts compared with those who did not (all P<0·001). Both adults and children consumed the majority of their vegetables in forms other than raw and alone, as part of a salad or sandwich, or in a fruit/vegetable mixed dish, regardless of meeting the recommendations. However, adults who did not consume recommended amounts also reported consuming fewer vegetables as part of a salad or sandwich (19 % v. 25 % respectively, P<0·0001) than those who consumed recommended amounts.
Discussion
In general, the proportions of fruits and vegetables consumed at different meals, from different sources and in different forms were similar between those who consumed recommended amounts and those who did not. Individuals who reported consuming recommended amounts of fruits and vegetables incorporated them into their diets in similar ways to those who did not. Compared with those who did not report consuming recommended amounts, those who did reported consuming an additional 2 cup-equivalents of both fruits and vegetables, which equated to six times as much fruit and three times as many vegetables.
The findings from the present study are consistent with prior work( 4 – Reference Sandeno, Wolf and Drake 6 ). For example, a NHANES 2007–2010 analyses indicated that about 90 % of fruits and 70 % of vegetables are consumed at home( 4 ). A survey of 2000 households in the USA indicated that two-thirds of vegetables were eaten at dinner and fruits were consumed at all eating occasions but especially breakfast (44 %) and lunch (24 %)( 5 ). Similarly, most fruits and vegetables were consumed at home and a large proportion was consumed fresh. A small-scale study among fourth to sixth graders also found that higher fruit intake was associated with starting the day with juice or fruit( Reference Sandeno, Wolf and Drake 6 ). While the above studies have examined how small populations or sub-populations obtain fruits and vegetables and when they eat them( 4 – Reference Sandeno, Wolf and Drake 6 ), the present study differs from others in that we used updated nationally representative data to explore how intakes of fruits and vegetables on a given day differed between those who consumed recommended amounts and those who did not.
Limitations of the study include reliance on the Food Patterns Equivalents Databases to estimate cup-equivalents of fruits and vegetables for each food reported. The Food Patterns Equivalents Databases disaggregate foods reported, including composite foods and mixtures, into their nutritionally relevant components and translate these amounts into cup-equivalents consistent with federal food guidance. Although the databases are uniquely designed to examine diets reported via 24 h recall methodology in NHANES, assumptions are made regarding the consistency of recipes and cooking methods to disaggregate foods into appropriate components. A second limitation of the analysis is that we did not examine whether usual intake of fruits and vegetables exceeded recommendations. One 24 h dietary recall does not capture day-to-day variation in diets and thus does not represent usual dietary intake, but is accurate for estimating differences in mean intakes as we did in these analyses( Reference Thompson and Byers 13 ). Third, individuals may not report their food consumption accurately by weight status( Reference Thompson and Byers 13 , Reference Burrows, Martin and Collins 14 ) and possibly between meals( Reference Poppitt, Swann and Black 15 ). NHANES may under-report mean energy intake by 11 % compared with total energy expenditure estimated using doubly labelled water( Reference Moshfegh, Rhodes and Baer 16 ). Normal-weight adults under-reported mean energy intake by <3 %( Reference Moshfegh, Rhodes and Baer 16 ). Fruit intake estimates especially may be higher than reported given that approximately a third of fruit intake occurs as snacks. Next, while most Americans should consume more fruits and vegetables to meet recommendations, increased intake should be balanced within energy needs. Fruit and vegetable intake recommendations account for energy needs; however, individual needs may differ from those in the USDA Food Patterns. Finally, we examined patterns among children and adults overall even though fruit and vegetable intakes vary within these broad age groups( 3 ). In general, we observed no significant differences when we stratified by age in children (see online supplementary material, Supplemental Table 1) but further research may be needed to explore patterns by age.
Eating patterns by meal, source and form for those who consumed recommend amounts of fruits and vegetables on a given day v. those who did not were very similar and differed mainly in the amount consumed. Overall, this indicates that people may not need to shift their current habits substantially with regard to when, from where and how they eat in order to meet recommendations. Increasing the amount of fruit consumed by 1 cup-equivalent equates to eating a banana or a small apple( 11 ). Increasing the amount of vegetables consumed by 1 cup-equivalent equates to eating twelve baby carrots or a large tomato( 12 ). Small shifts in everyday eating patterns like these could help the majority of the US population who are not consuming enough fruits and vegetables reduce their risk of many leading causes of illness and death, add important nutrients to their diet, and help with weight control( 2 ).
Acknowledgements
Financial support: This research received no specific grant from any funding agency in the public, commercial or not-for-profit sectors. The findings and conclusions in this report are those of the authors and do not necessarily represent the official position of the Centers for Disease Control and Prevention. Conflict of interest: None. Authorship: L.V.M conceptualized the study, drafted the manuscript and performed the primary statistical analyses. S.A.K. contributed to the conceptualization of the study. H.C.H. contributed to the statistical analyses. All authors contributed to the writing of the final manuscript. Ethics of human subject participation: This research utilized existing publicly available data and subjects cannot be identified directly or indirectly through identifiers linked to the subjects.
Supplementary material
To view supplementary material for this article, please visit http://dx.doi.org/10.1017/S1368980016000586


