


India is home to a large number of indigenous tribal people, who are still largely untouched by globalization and its impact on conventional lifestyles( 1 ). These indigenous communities live in a rich habitat replete with food resources and practise deep-rooted knowledge of the forest environment. However, despite this environmental endowment, challenges of geography, limited use of agricultural technology, cultural habits, lack of formal education, poor access to health-care facilities and poverty have resulted in poor nutrition and health in these communities.
Consumption of indigenous wild foods like wild plant foliage, vegetables and fruits can be an important mode of dietary diversification and a direct food-based intervention to address food insecurity( Reference Misra, Maikhuri and Kala 2 , Reference Frison, Smith and Johns 3 ). Apart from foraging, indigenous communities in India are often small farm holders who cultivate plots of land or backyard gardens (also known as kitchen gardens). Green leafy vegetables are grown in these kitchen gardens and are used for everyday cooking. Indigenous crops are seen to contain more micronutrients than non-native species of vegetables and promotion of indigenous crops is shown to be integral for ensuring that households consume more diverse diets( 4 ). Various traditional leafy vegetables native to specific regions promoted by home gardening programmes have shown a positive impact on food and nutrition security. Specifically, such home garden interventions with or without vitamin supplementation strategies have resulted in a substantial decline in vitamin A deficiency( Reference Bhattacharjee, Saha and Nandi 5 ).
Other studies have also reported that regular consumption of indigenous varieties of fruits and vegetables in communities could potentially fulfil dietary recommendations for various micronutrients like vitamin A, Ca and trace elements( Reference Roche, Creed-Kanashiroa and Tuestaa 6 – Reference Englberger, Lyons and Foley 11 ). Further, increased consumption is also indicated as a strategy for improving rural economies by increasing their production and assisting in the creation of markets for these foods. Food quantity and quality are the most direct indicators of the synergy between public health nutrition, agriculture and food security; understanding the extensive diversity and complexity of food systems of indigenous peoples and improving and strengthening these systems in the context of nutrition and health thus merit attention( Reference Bhattacharjee, Kothari and Priya 12 ).
In spite of huge natural resources, Jharkhand, a state in the central eastern part of India, is a poor performing state with some of the worst nutrition indicators. The prevalence of underweight and anaemia among women in the state is 42·6 % and 70·6 %, respectively( Reference Arnold, Parasuraman and Arokiasamy 13 ). The state is home to thirty-two Scheduled Tribes. The Santhal communities are the most populous, comprising about a third of the indigenous population in the state( 14 ). Studies have reported a high prevalence of undernutrition, chronic energy deficiency (CED) and Fe-deficiency anaemia in adults and children of the Santhal community residing in different states of India, including Jharkhand, Orissa and West Bengal( Reference Dutta, Chakraboraty and Ghosh 15 – Reference Rao and Vijay 19 ). This is despite a rich inventory of indigenous foods of both plant and animal origin in these states( Reference Sinha and Lakra 20 ). Although there are studies in India that document the nutritive value of indigenous foods consumed by tribal groups, there is a paucity of data on quantitative consumption estimates of actual intakes of these foods and their contributions to recommended dietary intakes( Reference Longvah and Deosthale 21 – Reference Deosthale and Longvah 23 ). It is imperative that health scientists and nutrition researchers explore and conduct empirical research on the potential of traditional food systems in increasing dietary diversity and contributing to food security( Reference Johns and Eyzaguirrea 24 ). This is also relevant in the context of current efforts globally that are looking at ways to increase consumption of local foods as well as for conserving biodiversity and indigenous knowledge, both within the community and as a knowledge resource for the scientific community. To the best of our knowledge, no study among Santhal tribal communities in India has explored the contribution of indigenous foods to nutrient intakes and their potential role in addressing food security.
The present study is a part of larger project that investigated the nutrient composition of common indigenous foods consumed by two tribal communities of Jharkhand and their contribution to food and nutrition security of women and children in the study communities. In the present paper we document our findings on the contribution of indigenous foods to nutrient intakes and nutritional status of women in the Santhal tribal community of Jharkhand.
Methods
Study design
This was an exploratory, cross-sectional survey with a longitudinal component on dietary intake assessment to account for seasonal variations.
Study settings
Four villages in the Sunderpahari block of Godda district of Jharkhand were covered.
Study period
The data were collected in three seasons. In June 2013 (rainy season), a detailed household (HH) and dietary survey was conducted. This was supplemented with a 24 h dietary recall (DR) on two consecutive days of one woman of reproductive age (15–49 years) per HH. A third of the same women were followed up in November 2013 (winter) and May 2014 (summer) by undertaking a two-day 24 h DR to capture seasonal variations in food and nutrient intakes.
Sample size calculation
In order to assess CED (BMI<18·5 kg/m2) in the study community, the objective of the sampling was set to capture at least 40 % prevalence of CED( Reference Arnold, Parasuraman and Arokiasamy 13 ). With α level of 5 %, design effect of 1·5 and an error range of ±10 % with 95 % confidence, a sample size of 140 was arrived at. We also calculated the sample size based on the proportion of the Indian rural population who are projected to be consuming inadequate energy (which is 62 %)( 25 ) and the prevalence of micronutrient deficiency in women (Fe-deficiency anaemia, 59 %)( Reference Arnold, Parasuraman and Arokiasamy 13 ). The sample size estimates using these different assumptions were the same.
Sampling framework
Based on the estimated sample size, 151 HH were selected from the chosen block in Godda district with a high concentration of Santhal population. A total of four villages were identified using probability-proportional-to-size sampling( Reference Grinnell and Unrau 26 ) and at least thirty-five HH were selected from each village. Since the main study aimed to look at both maternal and child undernutrition, HH surveyed were those with at least one child under the age of 5 years. These HH were selected randomly from the list of eligible HH provided by the anganwadi centre (community-based maternal and child health and nutrition care centre where every child under 5 years is enrolled) catering to the villages. To ensure random selection of at least thirty-five HH, additional HH were surveyed from adjacent villages inhabited by Santhal tribes if a village had less than seventy HH with children under the age of 5 years. One woman of reproductive age from each HH was selected using the Kish selection table (a method for randomly selecting members within a HH to be interviewed)( 27 ) for the purpose of the two-day 24 h DR and anthropometric assessment.
Data collection
Quantitative methods were used for data collection. An interviewer-administered questionnaire was used. This questionnaire was pre-tested in two Santhal villages. Information was collected on HH socio-economic and demographic profile, food consumption patterns with emphasis on the intake of indigenous food, procurement of food and money spent on food. HH food security was assessed using questions from the Household Food Security Scale–Short Form developed by the US Department of Agriculture( Reference Blumberg, Bialostosky and Hamilton 28 , Reference Bickel, Nord and Price 29 ). The frequency of consumption of different food groups was assessed using an FFQ. Pre-survey visits and qualitative enquiries through key informant interviews and focus group discussions were conducted to capture the variety of foods consumed by the Santhal community and their knowledge of the nutritional and medicinal properties of these items. Food items identified during the focus group discussions were extensively used to develop the FFQ. We developed a Santhal FFQ, pre-tested it in two villages with Santhal tribal communities and expanded the list of food items to a 243-item FFQ. These included both commonly consumed Indian food items as well as indigenous tribal foods. The reference period for the FFQ was 1 month. The field workers were provided extensive training including hands-on training in the field. This FFQ was administered during the survey conducted in the rainy season.
A two-day 24 h DR was taken for one woman of reproductive age per HH. For the DR, the selected woman was asked by an interviewer to remember, in as much detail as possible, her food intake during the past 24 h by using a food recall kit. For each meal, the respondent was asked to recall and wherever possible show or describe the foods eaten (i.e. each food item consumed along with a detailed recall of ingredients used, method of preparation, etc.) based on the recipe. A food recall kit which included standard utensils, measuring cups, spoons, glasses and a weighing scale was used for this purpose. This exercise of eliciting a 24 h DR was repeated on one-third of the population in two more seasons. So, data were collected during three seasons (summer, rainy and winter) in order to capture seasonal variations in nutrient intakes. Prior to the dietary survey, the study team had explored the availability and utilization of commonly consumed indigenous foods in the community. These commonly consumed foods were collected from the field and sent for taxonomic classification. Based on their scientific names, they were looked up in the Indian food composition tables called Nutritive Value of Indian Foods ( Reference Gopalan, Sastri and Balasubramanian 30 ). Efforts were made to collect samples of those food items that were reported in the DR but for which nutritive values were not available. These food samples were sent for nutrient analysis in an NABL (National Accreditation Board for Testing and Calibration Laboratories) certified laboratory in Delhi. Nutrient analysis was done using standard protocols and methodology. Mandatory quality control and quality assurance procedures of the laboratory were followed during analysis of each nutrient. The nutritive values of these foods were then entered into the software that was used for conducting nutrient analysis of the DR.
Anthropometric assessments to measure height and weight were carried out using standard protocols and equipment (weighing scale and anthropometer rod) on the same woman from whom DR were taken.
All study tools were translated by a native speaker into the local language (Santhali) and back-translated into English to check for fidelity, accuracy and consistency. The study tools were in the native language and administered by the field workers who were well versed in the local language/dialect. These field workers were accompanied by the study team members who supported them in eliciting accurate information from the study participants.
Data analysis
Nutrient intake data from the DR were entered into the validated software ‘DietCal’ version 3·0 (Profound Tech Solution; http://dietcal.in/), which is based on values from the Nutritive Value of Indian Foods ( Reference Gopalan, Sastri and Balasubramanian 30 ). Nutrient intake data (as represented by mean) were then compared with the Recommended Dietary Allowances for Indians for a moderately active adult woman( 31 ). The adequacy of nutrient intake by each participant was computed in terms of the nutrient adequacy ratio (NAR)( Reference Malhotra and Passi 32 ):
 $$\rm NAR\,{\equals}\,{\rm {participant ’ s \;nutrient \;intake/\!d} \over \rm {RDA \;of \;the \;respective \;nutrient}}.$$
Cut-offs for NAR were considered as ‘inadequate’ when the ratio was less than 0·66; ‘fairly adequate’ when the ratio was 0·66 to <1·00; and ‘adequate’ when the ratio was ≥1·00.
For the HH food security scores, the sum of affirmative responses to the six questions in the Household Food Security Scale–Short Form provided the HH’s raw score on the scale. Food security status was then classified based on the raw score: 0–1 as high or marginal food security (raw score=1 may be considered as marginal food security); 2–4 as low food security; and 5–6 as very low food security. BMI was calculated as weight (in kilograms) divided by the square of height (in metres). The women were classified as being underweight and as having CED or not using standard BMI cut-offs( 33 ). In order to assess any misreporting of dietary intake data in the context of energy intake estimation, we calculated Goldberg’s cut-off( Reference Black 34 ) for mean ratio of energy intake to BMR at a group physical activity level (PAL) of moderately active women.
Continuous variables were summarized as mean and standard deviation or as median and interquartile range, while categorical variables were summarized as number of subjects and percentages.
Women were categorized into two groups: those who consumed and those who did not consume indigenous foods based on 24 h DR data. The nutrient intakes in the two groups were then compared. Similarly, the nutritional status of women was compared between the groups. We used the t test or Wilcoxon rank-sum test and the χ 2 test to compare the differences in distribution of continuous and categorical variables, respectively, between the two groups. Seasonal variation in nutrient intakes was identified using ANOVA and the pairwise t test was done after Bonferroni correction using a P value of 0·02 (i.e. 0·05 divided by the number of comparisons, in this case three) to identify where differences existed between groups. This was performed if the F value in ANOVA was significant. We used two-sided tests and considered statistical significance at P<0·05. Analyses were performed using the statistical software package STATA version 13.
Results
Thirty-six to thirty-nine HH each in the four villages of Mahuatand, Teelabad, Bariyarpur and Kadampur in the Sundarpahari block of Godda district of Jharkhand, belonging to Santhal tribal community, were covered. Table 1 shows the socio-economic and demographic profile of HH as well as their food security status. The ratio of males to females in the study population was 0·83. The mean household size was 5·5 (sd 1·8; range: 2–12). Adult women comprised 28·04 % of the population (n 831). The mean age of the reproductive-age women was 27·8 (sd 7) years.
Table 1 Socio-economic and demographic profile of the sampled households in the Santhal tribal community of Jharkhand, India

* Missing data on socio-economic and demographic profile of the households ranged from 0·7 to 7·9 %.
† The Public Distribution System (PDS) is an Indian food security system under the Ministry of Consumer Affairs, Food, and Public Distribution. In this, major food commodities including staple food grains (such as wheat and/or rice), sugar and kerosene oil (a fuel used for cooking) are distributed through a network of public distribution shops (also known as ‘ration shops’) at subsidized prices. The PDS ration card is an official document entitling the holder to a ration of food under various categories of poverty.
‡ Below the poverty line.
§ AAY (Antyoday Ann Yojana), a category based on degree of poverty, entitles the holder to access food products at highly subsidized prices.
Land ownership for agriculture and access to food
Santhal communities are small landholder farmers; almost all HH (97·4 %) owned land for agricultural purposes. The majority of HH (97·3 %) utilized the food they grew for household needs. The HH (90·7 %) also utilized their backyard gardens, popularly called bari, for growing vegetables and fruits which were mostly (96·4 %) used for household consumption. Most of the participating HH (76·8 %) owned livestock: goats, sheep, cattle, poultry and pigs. A quarter of the food consumed by the majority (41·6 %) of HH was either home-produced food and/or procured from nearby forests. Foods that were procured from market or haat (weekly local market) included rice, oil and sugar, on which money spent per month (n 150) was INR 1279·3 (sd 968·9; range: INR 100–5000). Most of the HH (60·0 %) had very low food security. In spite of this, the access to food security programmes as observed through possession of a PDS (Public Distribution System) ration card (a government programme addressing food security for socio-economically disadvantaged households or those belonging to various grades of poverty) was low (about 23 %) in the study community.
Consumption and production of indigenous foods
The present study focused predominantly on eliciting information about the consumption and contribution of indigenous foods to the dietary intake of Santhal women. The consumption of a variety of indigenous foods including green leafy vegetables (GLV; 100·0 %), meat and meat products (98·7 %), fruits (98·7 %), vegetables (98·0 %) and roots and tubers (92·1 %) during specific seasons or throughout the year was reported by majority of HH. Indigenous GLV mostly consumed included (local name (scientific name)): gandhari (Amaranthus spinosus); munga arak (Moringa oleifera); kantha arak (Euphorbia granulate); sin arak (Bauhinia purpurea); dhurup arak (Leucas cephalotes); haisa arak (Ficus religiosa); matha arak (Antidesma diandrum); turi arak (scientific name not known); lapaung arak (Areua lanata); ohio arak (Boerhaavia diffusa); garundi arak (Alternanthera sessilis); but arak (Cicer arietinum); and aalu arak (Solanum tuberosum). Commonly consumed meat varieties included varieties like: pigeon, local name perua (Columbia livia intermedia); boar, local name barha (Sus indicus); mussel, local name jhinuk (Margaritifera margaritifera); snail, local name ghongi (Pila globosa); field rat, local name moosa (Rattus argentiventer); crab, local name kenkda (Paratephusa spinigera); and duck (Anaspplatyrhyncha spp.). Indigenous varieties of fruits included: tarop (scientific name not available); tiril (Diospyros melanoxylon); dahu (Artocarpus lakoocha Roxb.); mahua (Madhuca latifolia); and layu (scientific name not known). Indigenous varieties of vegetables included: sem (Dolichos lablab); bada ghangra (Dolichos iat Jang, Linn.); and pindra (scientific name not available). Commonly reported indigenous tubers included kapu (Dioscorea bulbifera). The majority of the HH reported that indigenous foods like GLV (65·6 %), vegetables (71·6 %), roots and tubers (66·9 %), fruits (73·2 %) and meat and meat products (67·1 %) were consumed by all family members irrespective of age and sex. Most of the HH also reported storing and preserving indigenous foods for consumption during lean periods and throughout the year. These included GLV like aalu arak, but arak, gandhari, garundi arak, haisa arak, kaddu arak, kantha arak, matha arak, muli arak, pyaz arak, mustard leaves, sin arak and turi arak; vegetables like brinjal and sem; fruits like mango and ber; and mushrooms. Methods of preservation included sun drying or boiling the vegetables followed by sun drying.
Dietary intake pattern of adults in the households
Most of the HH interviewed in the study villages (90·0 %) were non-vegetarians. Most of the adults consumed two (51·0 %) or three (48·3 %) main meals daily. Consumption of in-between meals was reported by 68·2 %. The foods commonly consumed as in-between meals included both fresh and processed foods like puffed rice (87·4 %), rice flakes (60·2 %), fruits (75·7 %), biscuits (50·5), tea (44·7 %), papad (crisps made of lentil flour; 14·6 %) and others (14·6 %) like dalmoth (a savoury made of fried lentils), maad bhaat (rice soup), pao roti (bread) and roti (Indian bread). The majority of HH (99·3 %) consumed packaged iodized salt. Consumption of alcohol by any member of the family was reported by almost all HH (93·4 %).
Although a variety of indigenous foods were reportedly consumed, a detailed FFQ carried out during the main survey in the rainy season (June 2013) revealed poor consumption of these foods on a daily basis. The majority of HH (57·6 %) consumed rice as a staple more than twice daily. GLV were the most common group of food items besides rice in the habitual diet. Almost a quarter of the population consumed GLV once daily while the consumption of other vegetables was reported to be only once or twice weekly by a majority (37·7 %). Frequent and copious consumption of seasonal fruits from the trees within the villages was also reported. Almost a quarter of the community (23·2 %) reported the consumption of fruits more than twice daily during the month of the survey. Almost a third (33·8 %) of the community reported consuming flesh foods once or twice per week in the last month and only a quarter of the community reported monthly consumption of any kind of fish. About half of the community (46·3 %) did not consume any milk or milk products during the month of the survey while only a third (33·1 %) consumed pulses/legumes one or two times weekly. Oil consumption twice or more than twice daily was reported by the majority of HH (75·0 %), with most of them consuming mustard oil. Most HH reported sugar consumption (16·6 %) once or twice weekly. Consumption of many indigenous varieties of alcoholic drink was reported which included taadi (alcohol made from palm sap), khajur taadi (alcoholic drink made from dates), mahua taadi (alcohol made from mahua) and handiya (alcoholic drink made from rice). A quarter (27·8 %) of the HH reported consuming these alcoholic beverages once daily.
Nutrient intakes of women of reproductive age
A two-day 24 h DR was conducted with one randomly selected woman per HH during the first survey in the rainy season (n 147). DR were also carried out in one-third of these women in winter (n 60) and summer (n 47) seasons. For the analysis of DR data, we could find the nutrient composition or carry out nutrient analysis for all foods except for three (one GLV, one unidentified food item, one fruit) that were reported in the DR of women. The food items for which we did not conduct nutrient analysis were reported in the DR of only two women each in winter and summer season. Table 2 provides a detailed description of the nutrient intakes of the study women in the three seasons. When the dietary intakes were compared with the Indian RDA for moderately active women, the adequacy of mean energy, protein, niacin and Zn intakes of the study population was more than 80 % in all seasons. However, the percentage adequacy for fat was below 60 %. For micronutrients, the percentage adequacy was below 60 % for Ca, folic acid, riboflavin and Zn among the study women (n 147) in the rainy season. Among the women who were followed up in winter (n 60), the percentage adequacy was below 60 % for Fe, Ca, folic acid, vitamin A, riboflavin and vitamin B12 while in summer (n 48) the percentage adequacy was below 60 % for vitamin A, vitamin C and vitamin B12. The NAR for Fe, Ca, folic acid, riboflavin and vitamin B12 was inadequate in more than 50 % of the study participants in all three seasons. The NAR for vitamin A and vitamin C was inadequate in more than half of the study population in both winter and summer seasons, while the NAR for thiamin was inadequate in 50 % of the study population in the winter season.
Table 2 Daily nutrient intakes of women of reproductive age (15–49 years) in the sampled households, Santhal tribal community of Jharkhand, India

NAR, nutrient adequacy ratio (inadequate, <0·66 of the RDA; fairly adequate, 0·66 to <1·00 of the RDA; adequate, ≥1·00 of the RDA); E%, percentage of total energy.
Bold font indicates that more than 50 % of the study population had inadequate intake of the specific nutrient.
* ‘% adequacy’ is the mean nutrient intake expressed as a percentage of the RDA, i.e. mean intake of nutrient/RDA of nutrient.
† RDA for moderately active women.
Seasonal variation in median intakes of nutrients in women
In order to explore any seasonal variation in the nutrient intakes of the study population, thirty-seven women (a quarter of the study population) were followed in all three seasons for assessment of their dietary intake. Table 3 shows their median nutrient intakes in the three seasons.
Table 3 Seasonal variations in median daily nutrient intakesFootnote * of women of reproductive age (15–49 years) in the sampled households, Santhal tribal community of Jharkhand, India

IQR, interquartile range.
* Since most of the nutrient variables were not normally distributed, the median and IQR are presented. Test of comparisons used ANOVA on log-transformed variables. Comparisons of vitamin A and vitamin B12 intakes are not reported as many of the women had almost negligible intakes.
The intakes of protein (P=0·002), vitamin C (P<0·001), folic acid (P=0·028), thiamin (P=0·004) and riboflavin (P=0·014) were significantly different in the three seasons. The pairwise differences in nutrient intake between seasons are detailed in the online supplementary material, Table S1.
Contribution of indigenous foods to nutrient intakes of women
In order to explore the contribution of indigenous foods to the nutrient intakes of the women surveyed, we compared the median nutrient intakes in women who had consumed any indigenous food in the past 2 d with those who had not. This comparison was done for the DR conducted during the rainy season only (n 147). Only 50 % of the study population consumed any kind of indigenous food during the recall period. The median intakes of commonly consumed indigenous foods under various food groups by those who reported consumption (n 74) are shown in Table 4. Although there were no differences in the median macronutrient intakes of women who consumed indigenous foods v. those who did not, the intakes of Ca (P=0·006) and Fe (P=0·010) were significantly lower in the group not consuming indigenous foods during the period of the DR (Table 5).
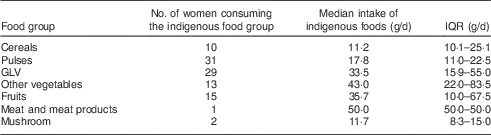
Table 4 Quantitative estimates of indigenous food intakes according to food group among those who reported consumption of indigenous foods in the past 2 d in the 24 h dietary recall (n 74); women of reproductive age (15–49 years), Santhal tribal community of Jharkhand, India
IQR, interquartile range; GLV, green leafy vegetables.
Table 5 Comparisons of median daily nutrient intakesFootnote * between those who reported consumption of indigenous foods in the past 2 d in the 24 h dietary recall and those who did not; women of reproductive age (15–49 years), Santhal tribal community of Jharkhand, India

IQR, interquartile range.
* Since most of the nutrient variables were not normally distributed, the median and IQR are presented. Test of comparisons used either the simple t test or the t test on log-transformed variables or Wilcoxon’s rank-sum test. Comparisons of vitamin A and vitamin B12 intake are not reported as many of the women had almost negligible intakes.
Anthropometric assessment of women
Based on their weight and height, women (n 139) were classified under various categories of underweight using CED classification (Table 6). Almost half of the women (48·9 %) had various degrees of CED with about 14·7 % of the women falling in the category of CED III (BMI <16·0 kg/m2). This high level of CED among study women existed in spite of a mean energy adequacy of above 80 % in all three seasons. In order to assess any misreporting, we checked the data for any systematic bias towards over-reporting or under-reporting. This was done by applying Goldberg’s cut-off for energy intake to BMR for assessing any misreporting( Reference Black 34 ). Based on the equation suggested, we calculated the PAL cut-offs at the upper and lower 95 % confidence limits and found the cut-offs to be 1·75 and 1·85, at a group PAL of 1·8 (moderately active women). The mean PAL for our study population was found to be 1·79, which was well within the acceptable limits. There was also no significant association (P=0·546) between indigenous food consumption and prevalence of underweight in women.
Table 6 BMI classification of the women of reproductive age (15–49 years), Santhal tribal community of Jharkhand, India

CED, chronic energy deficiency.
* The term ‘risk’ here denotes risk for overweight or obesity.
Discussion
The Santhal community in the present study were small landholder farmers, where the majority of HH owned land for farming and for backyard gardening. The HH reported utilizing the produce from the agricultural field, bari and the land resources within and around the villages for household consumption. Other studies among Santhal tribes have also documented forest-dependent systems with the community utilizing products such as roots, tubers, firewood, etc. sometimes for subsistence and sometimes as supplements to their routine diet. Some of these forest products are also known to be particularly rich sources of energy and protein( 35 ). Indigenous foods such as some shellfish, mushrooms and plant seeds are consumed for their rich protein content. The regions inhabited by the Santhal community also have a number of genetically diverse rice varieties that are known to have better nutrient profile in terms of protein content, digestibility and micronutrient levels (e.g. niacin) as compared with routinely cultivated rice varieties( Reference Rai and Nath 36 , 37 ).
The high level of CED observed in the study community is of concern. Such levels of CED have also been reported in Santhal communities across different states of India( Reference Bose, Chakraborty and Mitra 17 , Reference Ghosh 38 ). Access to PDS as reflected by the possession of a ration card was low despite the high prevalence of CED and low food security in the community. Other studies have also documented a poor access to PDS among Santhals as well as socio-economic deprivation and nutritionally deficient diets in this community( Reference Gupta 39 – Reference Moitra and Choudhary 41 ).
Although many indigenous varieties of cereals, GLV, roots and tubers, other vegetables as well as fruits were reportedly consumed, the frequency of consumption was low. A typical day’s diet for a large majority consisted of rice and some kind of GLV that was procured from agricultural land, bari or forest. Poor consumption of protein-rich foods like pulses, milk and meat products was observed. Seasonal intake of fruits was observed in the survey that was conducted during the rainy season. Similar food intake patterns along with traditional food practices and use of a variety of edible weeds in this community have been reported earlier( Reference Sinha and Lakra 20 , Reference Ghosh and Malik 42 ).
The nutrient intake profile of the women showed poor intakes of various macro- and micronutrients. The mean intakes of some of the crucial nutrients like Fe, Ca and folic acid were inadequate in a large majority of the population during the three seasons. Poor protein intake has also been reported in the Santhal community in West Bengal( Reference Ghosh 38 ). Seasonal variations in intakes of many micronutrients were also observed. This could possibly be attributed to the availability of seasonal indigenous foods rich in these micronutrients at specific times of the year. Community-based programmes teaching women how to optimize the practices of preservation of foods for later consumption could be a suitable strategy in this scenario that may compensate for lower nutrient intakes during lean seasons.
Another significant study observation was that women consuming indigenous foods in the past 24 h had higher intakes of Fe and Ca than those who did not. This clearly indicates that indigenous foods might contribute to better intakes of crucial micronutrients like Fe and Ca provided they are routinely consumed. It has also been seen that regular consumption of indigenous varieties of fruits can potentially contribute to fulfilling dietary recommendations for vitamin A( Reference Davey, Van den Bergh and Markham 7 , Reference Englberger, Kuhnlein and Lorens 8 ). In addition, Ogle et al. found that the daily intake of some naturally occurring vegetables could fulfil up to 30 and 40 % of the recommended allowances for vitamin A and Ca, respectively( Reference Ogle, Dao and Mulokozi 9 ). Previous research and our findings both strongly support the premise that the indigenous foods identified in the present study can contribute to nutrition security and may address poor micronutrient intake or ‘hidden hunger’ in the Santhal community if optimally consumed and promoted for their nutritional benefits. Evidence from other research on indigenous food systems indicates that indigenous plants could facilitate improvement in health status of individuals in both food-secure and food-insecure HH. Individual case studies also document the success of traditional food systems in improving nutritional status in communities that could, in certain conditions, provide over half of daily dietary energy requirements( Reference Durst and Bayasgalanbat 43 ).
Thus our study indicates the potential of encouraging cultivation and/or regular consumption of nutrient-dense seasonally available indigenous foods to address dietary inadequacies in the study population. In this context, a model home garden plot has been developed for two districts of India, with different sets of cropping sequences that can provide vegetables for a family of four all year round( Reference Keatinge, Chadha and Hughes 44 ). Most of the existing national food security schemes focus on improving only macronutrient intakes (i.e. of energy, protein and fat), rather than a holistic approach to ensure adequate diversity of nutrients necessary for a healthy and productive life( Reference Graham, Welch and Saunders 45 ). The present scenario demands a complementary strategy of availing schemes that promote food security along with optimizing the utilization of agricultural lands and baris. This could be done through efforts that increase the proportion of food procurement from the nearby environment, higher production of nutrient-dense indigenous foods and dissemination of knowledge on the nutritive value of these foods. This approach may prove to be a highly cost-effective strategy for increasing consumption and addressing undernutrition, micronutrient deficiency and food security in this community( Reference Chatterjee, Dhar and Sengupta 18 , Reference Rao and Vijay 19 ).
Limitations of the study
The 24 h DR were conducted for 2 d only in each season and estimating the percentage of inadequacy (<66 % of the RDA) using a 2 d DR may overestimate the true population prevalence of inadequacy.
Various foods for which we did not have nutritive values documented in the Indian food composition tables were stated to be consumed by women in 2 d of DR in three seasons. While efforts were made to carry out nutrient analysis of those foods in an NABL-certified laboratory using standard procedures and laboratory quality control and quality assurance practices as part of the present study, we could not get nutrient analysis done on three food items. These foods were consumed by two participants each in summer and winter season. Therefore, we expect some underestimation of nutrient intakes in those study participants.
The nutritive values of some of the food items used for dietary analysis were not published data and were analysed as part of the study. However, the findings on the nutritive values have been submitted as a manuscript to another journal and are currently under review.
The FFQ used in the study was developed and pre-tested as a part of the study. We did not use any validated Santhal food FFQ for the present study.
Conclusion
The inadequate nutrient intakes observed in our study community exist amid an environment in which many nutrient-rich indigenous foods are available. The community has the traditional knowledge about the availability and access to these foods, but perhaps does not utilize these optimally because of lack of awareness regarding their nutritive value. Efforts in terms of effective nutrition education and behaviour change regarding the importance of these foods and promotion of the preferential cultivation of nutrient-dense plants can go a long way in promoting better micronutrient intakes in the Santhal community of Jharkhand.
Acknowledgements
Acknowledgements: The authors would like to acknowledge the contribution of all respondents belonging to the Santhal community and residing in the study villages for sharing their knowledge about their rich heritage of indigenous and traditional foods and their dietary intake. The authors thank the efforts of Ms Keya Chatterjee, Mr Sarfraz and their team at ‘Ekjut’, a non-governmental organization, for providing them with support for data collection and facilitating an excellent team of data collectors who were well versed in the local dialect and experienced in field work. The authors would also like to thank all the field staff, anganwadi workers in the study villages, Mr Manoj Kumar Soni, the database administrator and the data entry operators for their support. Financial support: This work was funded by Wellcome Trust Capacity Strengthening Strategic Award to the Public Health Foundation of India and a consortium of UK universities. The funders did not have any role in study design, the collection, analysis and interpretation of data, the writing of the article or the decision to submit this article for publication. Conflict of interest: The authors declare that they have no competing interests. Authorship: S.G.-J., A.S. and M.S.M. conceived and designed the study with overall supervision from G.G. S.G.-J., P.K. and A.S. developed the tools for data collection, the data analysis plan, and supervised the data collection and data entry. T.L. did the statistical analysis. S.G.-J. prepared the first draft of the manuscript. G.G., M.S.M., A.S. and T.L. commented on drafts of the manuscript. All authors contributed to critique and modification of the manuscript, read and approved the final version. S.G.-J. had final responsibility for the decision to submit for publication. Ethics of human subject participation: This study was conducted according to the guidelines laid down in the Declaration of Helsinki and all procedures involving human subjects were approved by the Institutional Ethics Committee of the Public Health Foundation of India. The data collection team consisted of the core team along with local field investigators who were well versed with the local Santhali dialect spoken by the study population. A household level consent was taken from an adult member, who in most of the cases was an adult woman of the household. The field investigators explained the purpose of the study including detailed information on assessment of individual diet for three seasons and anthropometric assessment of a selected adult female from the household. For literate respondents written consent was taken, while for illiterate respondents verbal consent witnessed by a third party was taken. All interviews and anthropometric measures were done inside the household which afforded privacy for the participant.
Supplementary Material
To view supplementary material for this article, please visit http://dx.doi.org/10.1017/S1368980016000318


 Open access