


INTRODUCTION
Despite broad support for endangered species conservation, rapid and effective actions to prevent extinction can be elusive. Rare species tend to be locally scarce compared to wider spread species, making them inherently more difficult to monitor (Pimm et al. Reference Pimm, Jenkins, Abell, Brooks, Gittleman, Joppa, Raven, Roberts and Sexton2014). Species that are not represented in conservation areas are in an especially precarious position, relying on scattered habitat remnants with little to no protection. Isolated populations in fragmented habitats can experience negative demographic effects, as well as restricted gene flow between populations (Fahrig Reference Fahrig2003).
The lack of basic knowledge regarding the biology of rare species further contributes to conservation inaction. The best available data for many rare species, particularly in tropical regions, may not include metapopulation information, tracking data or other behavioural information, let alone sufficient understanding of their distributions (Sarkar et al. Reference Sarkar, Pressey, Faith, Margules, Fuller, Stoms, Moffett, Wilson, Williams, Williams and Andelman2006; Swenson et al. Reference Swenson, Young, Beck, Comer, Córdova, Dyson, Embert, Encarnación, Ferreira, Franke, Grossman, Hernandez, Herzog, Josse, Navarro, Pacheco, Stein, Timaná, Tovar, Tovar, Vargas and Zambrana-Torrelio2012). Collecting this data requires substantial investment, and must be balanced with minimizing disturbance to remaining populations. When data are limited and there is a high risk of habitat loss, an alternative approach can be to use connectivity simulations as a surrogate measure of habitat quality to inform conservation decisions or to evaluate habitat restoration scenarios (Rabinowitz & Zeller Reference Rabinowitz and Zeller2010; Gurrutxaga & Saura Reference Gurrutxaga and Saura2014).
Connectivity is a widely used term applied to many geographical scales, but fundamentally refers to ‘the degree to which the landscape facilitates or impedes movement among resource patches’ (Taylor et al. Reference Taylor, Trost and Jamison1993). Maintenance of habitat connectivity is one of the most commonly cited approaches used to mitigate the negative effects of habitat fragmentation (Heller & Zavaleta Reference Heller and Zavaleta2009). Well-connected habitat is expected to increase the probability that a species will survive local disturbances and that individuals dispersing from higher quality habitats, or habitats that were not subjected to disturbance, will recolonize unoccupied habitat (Hanski Reference Hanski1998). Hereafter when we use the general term ‘connectivity’, we refer to ‘functional connectivity’, which describes an organism-specific response to the spatial arrangement of the landscape (Tischendorf & Fahrig Reference Tischendorf and Fahrig2000).
An ever-increasing number of methods are being developed to simulate connectivity; three of the most popular are least cost paths, least cost corridors and network analysis (Calabrese & Fagan Reference Calabrese and Fagan2004; Cushman et al. Reference Cushman, McRae, Adriansen, Beier, Shirley, Zeller, MacDonald and Willis2013). Most of these models rely on landscape resistance surfaces or rasters that indicate the cost incurred by an animal moving through each cell in the landscape (Zeller et al. Reference Zeller, McGarigal and Whiteley2012). A least cost path is the single cell-width pathway between two patches with the lowest accumulated cost of movement (Adriaensen et al. Reference Adriaensen, Chardon, De Blust, Swinnen, Villalba, Gulinck and Matthysen2003). Least cost paths are computationally simple, but can be unrealistically narrow and do not account for other close to optimal routes (Sawyer et al. Reference Sawyer, Epps and Brashares2011). Least cost corridors identify a wider swathe of potential movement areas between two or more patches, but are computationally more intensive to produce (Pinto & Keitt Reference Pinto and Keitt2009). Network analysis identifies areas that are important for movement across a network of multiple patches (Urban & Keitt Reference Urban and Keitt2001).
Graph theory and circuit theory are complementary network analysis models that may both prove useful for identifying corridors (McRae et al. Reference McRae, Dickson, Keitt and Shah2008; Spear et al. Reference Spear, Balkenhol, Fortin, McRae and Scribner2010). Models based on electrical circuit theory evaluate all potential pathways between patches and highlight regions of high ‘conductance’ (McRae et al. Reference McRae, Dickson, Keitt and Shah2008). Graph theory models determine the optimal least cost routes between all pairs of habitat patches and permit bi-direction flow relevant for source and sink dynamics (Urban & Keitt Reference Urban and Keitt2001). Patch networks can be constructed with a range of accumulated cost thresholds in the graph theory framework (Anderson et al. Reference Anderson, Epperson, Fortin, Holderegger, James, Rosenberg, Scribner and Spear2010). While circuit theory may be most useful for representing gene flow and movement over multiple generations, graph theory might be more relevant for localized individual movement (Anderson et al. Reference Anderson, Epperson, Fortin, Holderegger, James, Rosenberg, Scribner and Spear2010; Spear et al. Reference Spear, Balkenhol, Fortin, McRae and Scribner2010).
The San Martin titi monkey (Callicebus oenanthe), is a critically endangered primate whose highly fragmented forest habitat presents an urgent and well-suited opportunity for connectivity analysis to inform conservation actions. This arboreal Peruvian species was recently added to the International Union for Conservation of Nature's list of the 25 most endangered primates in the world (Schwitzer et al. Reference Schwitzer, Mittermeier, Rylands, Taylor, Chiozza, Williamson, Wallis and Clark2014). Field surveys have only recently provided a reliable estimate of the species limited range, which is centred in an area of active deforestation (Fig. 1; DeLuycker Reference DeLuycker2006; Bóveda-Penalba et al. Reference Bóveda-Penalba, Vermeer, Rodrigo and Guerra-Vásquez2009). The titi monkey inhabits temperate subtropical humid forests and tropical dry forests at elevations from 200–1350 m, typically occupying the subcanopy (Josse et al. Reference Josse, Navarro, Comer, Evans, Faber-Langendoen, Fellows, Kittel, Menard, Pyne, Reid, Schulz, Snow and Teague2003; DeLuycker Reference DeLuycker2007; Bóveda-Penalba et al. Reference Bóveda-Penalba, Vermeer, Rodrigo and Guerra-Vásquez2009; Proyecto Mono Tocón [PMT], unpublished data 2015). The titi monkey requires a connected tree canopy for movement, travelling an average of 663 m per day; movement over the ground has not been documented (DeLuycker Reference DeLuycker2007). Recent research suggests that the species can navigate very narrow tree corridors, and may preferentially use edges, making it a prime candidate for corridor design and reforestation efforts (van Kujik Reference van Kujik2013).
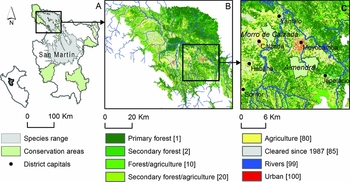
Figure 1 Study area in the department of San Martin, Peru: (a) Callicebus oenanthe’s modelled distribution; (b) land cover mapping and connectivity study area in the northern range; (c) Morro de Calzada–Almendra corridor sub-area. Connectivity models were parameterized using movement costs based on land cover, which are shown in square brackets. Land cover was mapped from Aster, Landsat 5 and Landsat 8 images (Supplementary Material, Table S1).
Peru is experiencing increasing levels of deforestation from a variety of land conversion forces including logging enterprises, agriculture, surface mining activities and urbanization (Swenson et al. Reference Swenson, Carter, Domec and Delgado2011; Piu & Menton Reference Piu and Menton2014). The department of San Martin, to which the titi monkey is endemic, is subject to some of the highest rates of forest loss (Bóveda-Penalba et al. Reference Bóveda-Penalba, Vermeer, Rodrigo and Guerra-Vásquez2009; Shanee et al. Reference Shanee, Tello-Alvarado, Vermeer and Bóveda-Penalba2013). From 2001–2011 alone, an estimated 9% of humid tropical forest in San Martin was converted from forest to land used for agriculture (Potapov et al. Reference Potapov, Dempewolf, Talero, Hansen, Stehman, Vargas, Rojas, Castillo, Mendoza, Calderón, Giudice, Malaga and Zutta2014). As of 2007, immigration was growing at a rate of 20.9% per year, double the national rate (Instituto Nacional de Estadística e Informática [INEI] 2011). These trends accelerated following the completion of a highway through San Martin, which connects Peru's Pacific coast with the interior (International Center for Tropical Agriculture 2012). Remaining habitat for the titi monkey consists primarily of unprotected forest fragments surrounded by land used for agriculture and human settlement.
Our objective is to use connectivity models to inform a rapid, low-cost habitat quality assessment for an endangered species in a region of active land cover change. In particular we explore how to best maintain connectivity between two existing conservation areas. This study can serve as a model for the design of locally appropriate conservation solutions to protect habitat networks for other threatened species. Furthermore, it serves as an example of successful collaboration to complement work by on the ground conservation scientists with geospatial modelling analyses.
MATERIALS & METHODS
We modelled the titi monkey's distribution, mapped remaining habitat at high resolution and conducted movement simulations to quantify the value of remaining forest fragments. Using modelled connectivity and local knowledge regarding the costs and feasibility of conservation in the region, we identified priority forest patches for additional research, conservation and outreach.
Study area
While we modelled the entire distributional range of the titi monkey across the department of San Martin, Peru (Fig. 1 a), the habitat mapping and connectivity analyses were focused on the species northern range in the Alto Mayo Valley (Fig. 1 b), specifically to contribute to local conservation planning decisions. Northern range populations are particularly constrained by the mountainous Cordillera Oriental to the southwest, the Cahuapanas Mountains to the northeast, and by broad rivers and extensive deforestation. We used a smaller case study area to demonstrate potential applications of landscape connectivity tools (Fig. 1 c). For this sub-area, we conducted a detailed comparison of circuit theory and graph theory approaches between two existing conservation areas: the Morro de Calzada and Almendra (Fig. 1 c).
Species distribution modelling
To determine geographic boundaries for our analysis, we generated an updated distribution model for the titi monkey using the MaxEnt maximum entropy algorithm (Phillips et al. Reference Phillips, Anderson and Schapire2006; Elith et al. Reference Elith, Phillips, Hastie, Dudík, Chee and Yates2011). Proyecto Mono Tocón (PMT), a Peruvian non-profit that seeks to protect the titi monkey and preserve lowland forest, documented 92 localities between 2007 and 2013 (Bóveda-Penalba et al. Reference Bóveda-Penalba, Vermeer, Rodrigo and Guerra-Vásquez2009; PMT, unpublished data 2015). To predict the distribution we included elevation (Jarvis Reference Jarvis2006) and six variables derived from monthly temperature and rainfall data (Hijmans et al. Reference Hijmans, Cameron, Parra, Jones and Jarvis2005); 11 other variables were excluded due to high correlation (Pearson's >0.7). We used 75% of the localities to train the model and 25% to assess predictions using bootstrapping. We created a binary presence map based on the logistic threshold where the model predicted at least a 5% probability of occurrence (Liu et al. Reference Liu, Berry, Dawson and Pearson2005).
Land cover mapping
Land cover mapping in this region has been limited in the past because of persistent cloud cover. We mapped remaining forest in the northern range from recent, virtually cloud-free Aster and Landsat imagery (Table S1). More information regarding classification methods is available in Appendix 1.
Landscape resistance surface
We used a stage-one expert approach to assign landscape resistance values to each land cover type, based on existing knowledge regarding the movement capability of the species (Zeller et al. Reference Zeller, McGarigal and Whiteley2012). Primary forest (the highest quality habitat) was assigned the lowest resistance to movement, while barriers such as high density urban areas and other low tree cover areas were assigned high resistance (Fig. 1 b). In our early exploration of the model, we tested a range of resistance values for non-forested land cover areas to assess sensitivity of the model to assumptions built into the resistance surface. We found that the movement patterns and major corridors highlighted were consistent, likely because the cost order of the landscape was not changed dramatically.
Two additional resistance surfaces were created to represent plausible development: 1) loss of remaining habitat within registered mining concessions and 2) land conversion within the regional government's high urban industrial planning zone (Instituto de Investigaciones de la Amazonía Peruana [IIAP] 2009; Instituto Geológico Minero y Metalurgico [IGMM] 2015). Registration of mining concessions for limestone and other non-metal resources has accelerated in the region in recent years (IGMM 2015). Many of these proposed surface mines are located within the larger contiguous areas of remaining habitat for the titi monkey (IGMM 2015). To create these resistance surfaces, we reclassified forest within areas of potential impact to cleared land.
Circuit theory analysis of the northern range habitat network
We used Circuitscape, a circuit theory model, to estimate connectivity across the titi monkey's northern range (Urban & Keitt Reference Urban and Keitt2001; McRae et al. Reference McRae, Dickson, Keitt and Shah2008). Remaining forest patches at least 2.5 ha in area, which is greater than the documented home range for the species, were represented as occupied habitat (DeLuycker Reference DeLuycker2007). We modelled movement along all pathways between 956 potentially occupied patches using the all-to-one mode, which iteratively selects one occupied patch as the ‘ground’ that individuals from other occupied ‘source’ patches are moving toward. The resulting conductance map summarizes how many times each cell was part of a movement pathway during simulations. We also ran the model for the development scenarios, substituting the appropriate resistance surfaces.
For the remaining forest in the current and modified landscapes, we used the Geospatial Habitat Assessment Toolkit (GeoHAT; Fay & Urban Reference Fay and Urban2012) for ArcGIS to compute patch-level metrics that may be associated with habitat quality, including: patch area, mean distance to forest edge and shape index (McGarigal Reference McGarigal, El-Shaarawi and Piegorsch2006). We used ArcGIS to compute Euclidean distance to conservation areas and percentage forest cover within a 1.5 km radius surrounding each cell. We also determined the mean and total conductance value of each habitat patch. To determine whether the development scenarios would have significant effects, we applied Kruskal–Wallis tests in R to compare the current and modified habitat networks (Zar Reference Zar2010; R Core Team Reference Core Team2012). Dunnett tests adjusted for different sample sizes determined how habitat characteristics changed under each scenario (Hothorn et al. Reference Hothorn, Bretz and Westfall2008; Zar Reference Zar2010).
Connectivity analysis of the Morro de Calzada–Almendra corridor sub-area
Within the Morro de Calzada–Almendra corridor, we generated a habitat graph using GeoHAT, which identified multiple least cost paths between 258 suitable patches (>2.5 ha) based on the resistance surface, using 10 500 as the maximum accumulated cost threshold where the network is optimally connected. This threshold was identified by generating multiple graphs increasing the cost threshold by 500 units at each iteration; the ‘diameter’ of the graph, or the longest of the shortest paths connecting patch pairs, decreased when a higher threshold was applied. We generated modified graphs for the development scenarios based on the appropriate resistance surfaces. For each patch we also considered the ‘degree’ (the number of other occupied patches connected to it), ‘connected area’ of accessible habitat, minimum travel cost to a conservation area and minimum travel cost to another occupied patch (Urban et al. Reference Urban, Minor, Treml and Schick2009; Fay & Urban Reference Fay and Urban2012).
To account for the potential presence of suitable narrow tree lines that may not have been detected by the 15-m resolution land cover classification, we computed a least cost path density measure summarizing the number of paths within 90 m of each forested cell. We compared each modified habitat network to current conditions using Kruskal–Wallis tests and Dunnett tests, adjusted for different sample sizes. To assess the differences between connectivity model results, we computed Pearson's product–moment correlations between graph measures and circuit theory measures of connectivity. We also assessed whether the modelled connectivity value of patches was associated with other patch characteristics.
Habitat patch prioritization for the Morro de Calzada–Almendra corridor sub-area
We prioritized remaining suitable habitat patches in the Morro de Calzada–Almendra corridor by ranking patches according to patch area, connectivity value (i.e. degree) and relative cost of protection. Based on their experience in the region, PMT estimated the current relative costs of land protection using zoning maps and other relevant data available from the regional government. In their evaluation, they considered several factors that would be expected to affect the costs of land protection, including the presence of: human settlements, lands owned by native communities, road access, monocultural crop cultivation, pastures and forest concessions. PMT also integrated their knowledge of dynamic local social factors, including rates of immigration, politics and community interest in conservation.
RESULTS
Habitat extent
Our revised distribution model estimates the titi monkey's total range at 13 709 km2. We mapped land cover within the northern range, with an overall accuracy of 87.9% (Fig. 1 b). Clouds, haze and shadows were prominent in high elevation areas, limiting our ability to map forest cover in approximately 2% of the northern range of the species. We found that at least 34% of the species northern range has been deforested. Up to 228 000 ha of forest remains, however, we estimate that 9% (20 300 ha) of this area is palm-dominated flooded forest. Less than 8% (18 740 ha) of remaining habitat lies within conservation areas, most of which are at the upper elevation limit for the species (Figs 1 a and 1 b).
Connectivity across the northern range
We identified nearly 22 000 distinct forest fragments in the northern range, over 90% of which are smaller than the titi monkey's home range (Table 1; DeLuycker Reference DeLuycker2007). Patches large enough to support populations have relatively low conductance. These patches tend to be isolated (as indicated by low local forest cover) and far from conservation areas (Table 1). High conductance patches tend to be smaller than the average patch in the northern range (mean = 4.59 ha). These patches tend to be located in heavily deforested areas, closer than average to conservation areas (Table 1).
Table 1 Northern range mean habitat characteristics and Dunnett test significance level (*) for differences between modified scenario landscapes and current conditions. The most connected patches within each landscape represent those above the 90th percentile for mean conductance. Complete significance testing results are provided in Supplementary Material, Appendix 1 and Tables S1 and S2.

Although habitat would be modified under both of the development scenarios, each scenario produced distinct impacts on the habitat network (Table 1). Development of mining concessions could result in a loss of over 25 000 ha (11%) of the remaining forest in the northern range (Table 1). Full build out within areas zoned for high urban-industrial development could affect nearly 30 000 ha (13%) of forest. Kruskal–Wallis tests and Dunnett tests indicated that the mining scenario could result in a significant decrease in local forest cover and the total conductance value of patches (Tables S2 and S3). Under the urban development scenario, the forest patches not affected by development would have slightly higher forest cover in their immediate vicinity, greater distance to patch edge and would be closer to conservation areas; however, the mean conductance value of patches would be dramatically reduced (Tables S2 and S3). The mining scenario could affect disproportionately larger patches, whereas the urban development scenario would tend to impact smaller patches (Table 1). Results indicate that larger patches could become more important for movement as endorsed by higher conductance values; however, this change was not significant (Table 1).
Connectivity within the Morro de Calzada–Almendra corridor sub-area
We evaluated the same scenarios using both circuit theory and graph theory measures of connectivity within the Morro de Calzada–Almendra corridor area (Fig. 2, Table 2 and Tables S4 and S5). In order to distinguish between the two models, outputs from circuit theory analysis are described in terms of conductance, while the various outputs from graph theory analysis are individually described.

Figure 2 Habitat connectivity analysis for the Morro de Calzada–Almendra corridor under current conditions and two development scenarios (a). Connectivity was modelled using Circuitscape and GeoHAT across the current habitat network (b and e), after development of mining concessions (c and f) and after development within high urban-industrial zones (d and g).
Table 2 Morro de Calzada–Almendra corridor mean habitat characteristics and Dunnett test significance level (*) for differences between modified scenario landscapes and current conditions. Complete significance testing results are provided in Supplementary Material, Appendix 1 and Tables S3 and S4.

Remaining patches in the Morro de Calzada–Almendra corridor are larger than average and have higher local forest cover compared to the entire northern range (Tables 1 and 2). Patches >2.5 ha have a higher than average importance in the habitat network based on their degree, contrary to the results for the northern range as a whole based on conductance (Tables 1 and 2). Large patches have lower than average cost of travel to conservation areas as well as lower than average travel cost to the nearest patch (Table 2). However, large patches are further from least cost paths, seemingly consistent with the low conductance values of large patches for the northern range as a whole (Tables 1 and 2).
We found that the mining scenario could result in significantly increased degree (number of patches connected to a given patch), increased shape index (a measure of complexity), decreased local forest cover, increased cost of travel to a conservation area and decreased minimum cost of travel to another occupied patch (Table 2, and Tables S4 and S5). The urban development scenario would result in significantly increased degree, increased shape index, increased cost of travel from unprotected patches to a conservation area, increased least cost path density and decreased cost of travel to nearest neighbouring patch (Table 2, Tables S4 and S5).
There was little association between patch level estimates produced by circuit theory and graph theory approaches for the remaining patches in the Morro de Calzada–Almendra corridor. There was a weak but significant relationship between total conductance and degree (Pearson's = 0.4, p < 0.005). The total conductance of a given patch was weakly associated with area, mean distance to edge and shape index (0.3 < Pearson's < 0.5, p < 0.001). The strongest predictor of degree was patch area (Pearson's = 0.68, p < 0.001), followed by mean distance to edge (Pearson's = 0.55, p < 0.001), shape index (Pearson's = −0.48, p < 0.001) and mean local forest cover (Pearson's = 0.46, p < 0.001).
Conservation prioritization for the Morro de Calzada–Almendra corridor
Using a prioritization scheme based on patch area, degree and the relative cost of protection, we highlighted important habitat patches that merit further investigation on the ground. We identified priority patches >2.5 ha, with a high contribution to connectivity based on their degree value, which would be relatively inexpensive to protect based on local expert opinion (Fig. 3 c). We also identified priority patches for community outreach and education programs. These patches also have high degree values, but are located within areas where protection is costly or infeasible (Fig. 3 d).

Figure 3 Prioritization of remaining forest patches in the Morro de Calzada–Almendra corridor considering patch area, degree (a graph measure of connectivity) (a), and cost of protection based on Proyecto Mono Tocón's expert opinion (b). Patches large enough to support Callicebus oenanthe's home range with high degree values and low protection costs represent priority areas for additional research and conservation (c); similar patches where conservation is infeasible or costly represent priorities for outreach and education (d).
DISCUSSION
Species distribution modelling, land cover mapping and connectivity modelling have provided insight into the status of titi monkey populations. Our revised distributional range estimate is 14% smaller than a previous estimate by NatureServe, which was limited by a smaller number of localities (Fig. 1 a; Patterson et al. Reference Patterson, Ceballos, Sechrest, Tognelli, Brooks, Luna, Ortega, Salazar and Young2007). Our revised range very likely overestimates the occupied area, given that PMT has not documented the species presence in flooded forests (PMT, unpublished data 2015). The range of the species has very little overlap with conservation areas.
The survival of the titi monkey will likely depend on maintaining functional connectivity between remaining lowland forest fragments and restoring connections between isolated populations. Unfortunately, patches that are more likely to support populations (>2.5 ha) tend to be isolated and far from conservation areas. Therefore patches serving as stepping stones between viable habitat areas need urgent conservation and reforestation measures should be considered. Patches with high conductance value tend to be located in areas of existing fragmentation, but closer than average to conservation areas (Table 1). This may be due to the high levels of existing fragmentation in lowland forests within the central portion of the species northern range, constraining movement into fewer pathways. These patches, which comprise 10 092 ha of forest (c. 4% of remaining habitat; Table 1), demand attention for conservation of remaining corridors and for reforestation efforts to reconnect fragments.
The Morro de Calzada–Almendra corridor area represents an ideal conservation opportunity based on our analysis of habitat characteristics in this subregion compared to the entire northern range (Tables 1 and 2). Remaining forest patches are larger than average for the northern range and suitable patches for the species have a high relative contribution to connectivity according to graph theory analysis. Modelled connectivity is concentrated in relatively few major pathways in this corridor; one large patch was part of 50 distinct least cost routes (Fig. 2). A majority of remaining forest patches had low conductance values, likely due to relatively high forest cover in the area enabling diffuse movement. Our prioritization highlighted important patches for protection and other conservation strategies (Figs 3 c and 3 d). PMT will conduct surveys in these areas to assess titi monkey population levels and to further investigate protection feasibility.
Given the lack of metapopulation and tracking data for the species, connectivity modelling has provided a useful alternative source of quantitative data. Circuit theory and graph theory measures of connectivity were not strongly correlated, which supports previous assertions that these models are complementary (McRae et al. Reference McRae, Dickson, Keitt and Shah2008; Anderson et al. Reference Anderson, Epperson, Fortin, Holderegger, James, Rosenberg, Scribner and Spear2010; Spear et al. Reference Spear, Balkenhol, Fortin, McRae and Scribner2010). Prioritizations using the individual model results could produce different recommendations; for understudied species such as the titi monkey, use of multiple models may produce more conservative estimates of connectivity and provide some consideration of uncertainty. If observations of movement, metapopulation data or genetic data become available, more thorough model selection and evaluation would be possible (Spear et al. Reference Spear, Balkenhol, Fortin, McRae and Scribner2010).
Model results are useful for predicting the potential impacts of land use change scenarios. Although urban development would affect smaller patches and only a slightly larger area of land than surface mining, the projected impacts are more severe (Table 1, and Tables S2 and S3). This is likely due to the geographic position of affected habitat; patches in the central portion of the range are expected to be more important for connectivity. Other habitat loss or restoration scenarios could be investigated with this approach.
We have demonstrated several applications of connectivity modelling for endangered species conservation, but there are certainly limitations. We used publicly available imagery to map land cover in the northern range, which served as the primary input for the connectivity analyses. The Aster imagery did not include short-wave infrared bands, which are particularly important for explaining variability in forest cover; this could explain the relatively poor results achieved with supervised classification (Cohen & Goward Reference Cohen and Goward2004). Although our land cover map offers the highest resolution map of remaining forest currently available for this region, it may not account for the full range of suitable corridors for the species. We have observed an individual using a tree corridor < 8 m wide. Finer levels of land cover detail could be obtained with higher resolution imagery, but this may not be an option for conservation practitioners with limited budgets. Tracking or genetic data could also be used to validate and improve future modelling efforts (Sawyer et al. Reference Sawyer, Epps and Brashares2011).
Additional study of titi monkey movement and the dimensions of the forested corridors they use is warranted. Understanding these factors could help optimize conservation schemes and reforestation plans to reconnect forest fragments. We found that modelled connectivity was associated with some habitat patch characteristics. Validated models could assist in more reliably identifying important patches for connectivity based on area, arrangement and other significantly correlated patch attributes. Pioneer neotropical trees, such as Cecropia species, are capable of achieving a connected canopy with an average height >3 m in less than 3 years (Chazdon Reference Chazdon2014). Given that titi monkeys use mid-canopy trees to travel between patches (PMT, unpublished data 2015), reforestation is a viable option for near term connectivity restoration.
PMT is currently investigating population densities and behaviour in several conservation areas, including the Morro de Calzada and Almendra. They will be able to customize our geospatial tools for their needs and incorporate additional data into prioritization schemes to protect the titi monkey as new results emerge. This species may serve as a useful subject for testing management strategies to maintain viable populations of other endangered species subject to extreme habitat fragmentation.
CONCLUSION
For rare species threatened by active habitat modification, inaction due to lack of data may result in continued habitat loss and extinction. Connectivity simulations guided by species distribution modelling and current, high-resolution land cover mapping can provide supplementary data to inform conservation initiatives. Modelling of connectivity under development or reforestation scenarios can identify potential land use conflicts and assist in the development of locally appropriate conservation strategies. Our method is flexible and could easily be modified to integrate multiple measures of connectivity, and any additional attributes that can be linked to a habitat patch database. While data gaps remain, our analysis provides the basis for future research and conservation efforts for endangered species.
ACKNOWLEDGEMENTS
The authors acknowledge funding from Cleveland Metroparks Zoo, Duke Center for Latin American and Caribbean Studies and Nicholas School of the Environment. Aster satellite imagery was provided by NASA. Eder Murrieta-Villalobos, F. Leandro García-Castro, Daniel Morales-Rodríguez, Julio C. Tello-Alvarado and Carolina García Suikkanen assisted with executing landcover verification in the field. Jan Vermeer provided comments on the manuscript. John Fay provided technical support for the analysis using GeoHAT.
Supplementary material
To view supplementary material for this article, please visit http://dx.doi.org/10.1017/S0376892915000405


