


1 Introduction
The application of small-amplitude symmetry-breaking, non-axisymmetric magnetic fields ( ${\it\delta}\boldsymbol{B}/\boldsymbol{B}\sim 10^{-4}{-}10^{-3}$) to tokamak plasmas can be very useful. In H-mode plasmas, edge-localized modes (ELMs) can be suppressed, mitigated and sometimes controlled using these fields (Evans et al. Reference Evans, Moyer, Thomas, Watkins, Osborne, Boedo, Doyle, Fenstermacher, Finken and Groebner2004; Canik et al. Reference Canik, Maingi, Evans, Bell, Gerhardt, Leblanc, Manickam, Menard, Osborne and Park2010), but this mechanism is not fully understood. Early theories of resonant magnetic perturbation ELM suppression suggested that resonant perturbing fields opened overlapping island chains, leading toward stochastic regions (Fenstermacher et al. Reference Fenstermacher, Evans, Osborne, Schaffer, Aldan, Degrassie, Gohil, Joseph, Moyer and Snyder2008), but this can be at odds with a high electron temperature H-mode profile. More recent developments suggest that the ELM cycle can be interrupted (suppressed) if some transport mechanism stops the inward growth of the pedestal width (Snyder et al. Reference Snyder, Osborne, Burrell, Groebner, Leonard, Nazikian, Orlov, Schmitz, Wade and Wilson2012). It has been suggested from modelling that an RMP-induced single harmonic island chain could stop the inward pedestal growth (Wade et al. Reference Wade, Nazikian, Degrassie, Evans, Ferraro, Moyer, Orlov, Buttery, Fenstermacher and Garofalo2015). Despite extended MHD modelling that predicts the possibility of this island formation (Ferraro Reference Ferraro2012), it is difficult to verify this suggestion experimentally.
Understanding the role of island formation due to RMPs is thus an important aspect of ELM suppression and a main goal of the work in this paper. While this understanding is most crucial in the H-mode pedestal region, we focus on a more tractable island scenario: low-rotation L-mode plasmas with RMPs. These plasmas provide a better test bed for evaluating numerical models (which presently lack rotational effects) addressing island formation.
Resistive nonlinear MHD simulations are used to model island formation in plasmas. In this paper, we study numerically the effect of varying RMP strengths on the production of islands and the level of induced magnetic stochasticity in low-rotation L-mode plasmas. An efficient, parallel version of the Scalable Iterative Equilibrium Solver for Toroidal Applications (SIESTA (Hirshman, Sanchez & Cook Reference Hirshman, Sanchez and Cook2011; Seal, Perumalla & Hirshman Reference Seal, Perumalla and Hirshman2013)) code has been developed to compute non-ideal, three-dimensional (3-D) equilibria in tokamaks and stellarators. Here, it is used to analyse the effect of different resonant perturbation strengths at the dominant  $q=2$ ( $m=2$, $n=-1$) rational surface in a representative DIII-D (Luxon Reference Luxon2002) plasma. We then compare the numerically modelled islands to measurements.

Figure 1. Toroidal flux contours for DIII-D shot no. 154 921,  $\text{time}=2530~\text{ms}$. The blue contours correspond to normalized toroidal flux ${\it\Phi}<1/3$; the green contours are intermediate values $1/3<{\it\Phi}<2/3$; and the red contours are ${\it\Phi}>2/3$.
A fully self-consistent, 3-D free-boundary calculation is beyond the calculational capability of the (at present, fixed boundary) SIESTA code. Therefore, in this paper we have studied the effect of varying a model amplitude which should be interpreted to account approximately for the applied RMP magnetic field at the dominant resonant surface. Not surprisingly, the amplitude found to yield the best agreement with experimental data is also close (to within a factor of 2) to the applied vacuum perturbation superimposed on the DIII-D fields at the resonant surface (which can be amplified or shielded by the plasma response).
We will demonstrate that the fixed boundary assumption of axisymmetry does not preclude the internal island structure found by SIESTA, which is a nonlinear (saturated) tearing mode driven by the dominant  $m=2,n=-1$ component of the RMP spectrum. In particular, the final state of the plasma – after applying this resonant perturbation – has a lower energy than the pure axisymmetric equilibrium, even with an axisymmetric boundary – so it will not spontaneously revert to the pure axisymmetric state.
2 Ideal equilibrium properties
The numerical analysis presented here is based on DIII-D shot no. 154921,  $\text{time}=2530~\text{ms}$. This discharge is a nearly up–down symmetric, D-shaped plasma limited on the inner wall, with magnetic energy $W_{B}=33.8~\text{MJ}$ and a plasma thermal energy $W_{T}=(3/2)W_{P}=0.25~\text{MJ}$, corresponding to a low volume-averaged ${\it\beta}\sim 0.5\,\%$. It is a low ${\it\beta}_{n}\sim 0.5$, low torque (nearly balanced neutral beam injection), and therefore a low rotation L-mode dischargeFootnote 1. In figure 1, contours of magnetic normalized toroidal flux ${\it\Phi}$ are shown for an axisymmetric equilibrium corresponding to these discharge parameters. These were calculated by the Variational Moments Equilibrium Code (VMEC (Hirshman, Van Rij & Merkel Reference Hirshman, Van Rij and Merkel1986)) and agree very well with the equilibrium and reconstruction code EFIT (Lao et al. Reference Lao, John, Stambaugh, Kellman and Pfeiffer1985, Reference Lao, St. John, Peng, Ferron, Strait, Taylor, Meyer, Zhang and You2005). In these computations, stellarator symmetry was enforced in the 2-D equilibrium, since presently the SIESTA code can only compute equilibria with this constraint. This approximation is justifiable since the free-boundary equilibrium computed by VMEC (and EFIT) is indeed approximately up–down symmetric. The nested flux contours are spaced equally in the SIESTA radial coordinate $s=\sqrt{{\it\Phi}}$. The $s$ coordinate, together with the poloidal and toroidal angles $u,v$, form the SIESTA computational grid. The profile for the safety factor $q$ is shown in figure 2. It was obtained from EFIT reconstruction using motional Stark effect (MSE) data to constrain the internal current profile. A low-order rational surface occurs at $s\sim 0.7$, where the resonance condition $m+nq=0$ is satisfied for $m=2$, $n=-1$. Here, $m$ and $n$ are the poloidal and toroidal Fourier numbers in the spectrum of the applied helical perturbation. Island formation is expected to occur at this location when a helical radial magnetic field perturbation is applied using RMP coils, as described in the next section. Finally, the axisymmetric (unperturbed) pressure profile is shown in figure 3. A finite pressure gradient exists at the rational surface for the axisymmetric equilibrium.

Figure 2. Safety factor  $q$ versus the SIESTA minor radius $s$.
$s$.

Figure 3. Unperturbed pressure profile (in mks units, Pa) versus the SIESTA minor radius  $s$.
$s$.
3 Application of non-ideal (tearing) perturbation
The SIESTA computations for the selected discharge were performed using a fixed plasma boundary corresponding to the axisymmetric equilibrium shape shown in figure 1. The spectrum of the applied RMP is dominated by a helical perturbation with the  $q=2$ helicity and should not have a significant effect on the boundary shape. This has been confirmed by 3-D free-boundary VMEC calculations with the RMP coils. In SIESTA, resonant perturbations need to be applied to the VMEC equilibrium to break the surfaces, regardless of whether an underlying 2-D or 3-D VMEC equilibrium is used. The effect of the RMP is therefore modelled here by applying a tearing-parity helical perturbation localized around the $q=2$ resonant surface in the plasma. The strength of this perturbation is varied to examine the resulting ideally stable sequence of equilibria computed by SIESTA. These equilibria correspond to local (ideal) minima of the magnetic energy, which can, however, be lowered by increasing the RMP strength. The simulated RMP is of the form:
 $$\begin{eqnarray}{\it\delta}\boldsymbol{B}=\boldsymbol{{\rm\nabla}}\times \boldsymbol{A}_{\Vert }.\end{eqnarray}$$
 Here,  $\boldsymbol{A}_{\Vert }=-\boldsymbol{E}_{\Vert }{\rm\Delta}t$ is the projection of the vector potential parallel to the local magnetic field $\boldsymbol{B}$, where $\boldsymbol{E}_{\Vert }=(\boldsymbol{E}\boldsymbol{\cdot }\boldsymbol{B})\boldsymbol{B}/\boldsymbol{B}^{2}$ is the non-ideal (resistive) parallel component of the electric field. In SIESTA, the quantity $\boldsymbol{E}\boldsymbol{\cdot }\boldsymbol{B}\equiv e$ is chosen to gain access to lower energy states with enhanced islands:
 $$\begin{eqnarray}{\it\delta}W=-\int \boldsymbol{J}\boldsymbol{\cdot }\boldsymbol{E}\,\text{d}V=-\int |\sqrt{g}|Ke\,\text{d}s\,\text{d}u\,\text{d}v.\end{eqnarray}$$
 Here,  $K=\boldsymbol{J}\boldsymbol{\cdot }\boldsymbol{B}/\boldsymbol{B}^{2}$ is the component of the parallel current. In a VMEC equilibrium with no islands, this localized current sheet ‘shields’ the islands from forming around rational surfaces. The steepest descent choice $e\approx K$ corresponds physically to parallel resistivity. However, this value for $e$ would alter the equilibrium properties (such as the rotational transform ${\it\iota}=1/q$ due to the resulting ‘resistive’ changes of the current. Instead, the value of $e$ is chosen so that the non-resonant equilibrium current profile is preserved while the resonant shielding components of the parallel current are diminished. The following ansatz accomplishes this:
 $$\begin{eqnarray}e\approx K^{\prime }\equiv \mathop{\sum }_{m,n\text{-}\mathit{resonant}}(\sqrt{g}K)_{mn}(s)\cos (mu+nv).\end{eqnarray}$$
 In the sum in (3.3), the  $m=0$, $n=0$ average component of the parallel current is excluded and only the resonant Fourier modes of $K$ are retained. These resonances occur in the plasma at radial positions $s_{mn}$, where $m+nq(s_{mn})=0$. Stellarator symmetry has been assumed in retaining only $\cos (mu+nv)$ modes for the parallel current. A final constraint on the parallel electric field used in SIESTA is to impose ‘tearing’ parity on the radial distribution of $e$. This parity is required to create magnetic islands (odd parity, or ‘rippling’ modes, do not create islands). Moreover, the odd-parity modes give rise to the equilibrium Pfirsch–Schlüter parallel current (Pfirsch & Schlüter Reference Pfirsch and Schlüter1962; Boozer Reference Boozer1983) required to balance curvature-driven perpendicular currents from the current continuity equation:
 $$\begin{eqnarray}\left.\begin{array}{@{}rcl@{}}\boldsymbol{{\rm\nabla}}\boldsymbol{\cdot }\boldsymbol{J}\ & =\ & 0\\ \ & =\ & \boldsymbol{B}\boldsymbol{\cdot }\boldsymbol{{\rm\nabla}}K+\boldsymbol{{\rm\nabla}}_{\bot }\boldsymbol{\cdot }\boldsymbol{J}_{\bot }.\end{array}\right\}\end{eqnarray}$$
 In SIESTA, tearing mode parity is applied by introducing  $k_{mn}(s)$, which is the parallel current Fourier amplitude $K_{mn}(s)$ symmetrized with respect to the resonant surface $s_{mn}$:
 $$\begin{eqnarray}k_{mn}(s)={\textstyle \frac{1}{2}}a_{mn}(s)[(\sqrt{g}K)_{mn}(|s-s_{mn}|+s_{mn})+(\sqrt{g}K)_{mn}(-|s-s_{mn}|+s_{mn})].\end{eqnarray}$$
 In (3.5), the filter function  $a_{mn}(s)=a_{mn}^{0}>0$ when the arguments of $K_{mn}$ are in the allowable range $0\leqslant s\leqslant 1$, and $a_{mn}(s)=0$ outside this range. The constant perturbation strength is $a_{0}$. With this ansatz for the tearing perturbation, the resistive energy change becomes (note that the odd-parity part of $K$ integrates to zero):
 $$\begin{eqnarray}{\it\delta}W=-\mathop{\sum }_{m,n\text{-}\mathit{resonant}}a_{mn}(s)k_{mn}^{2}(s)<0.\end{eqnarray}$$
 The perturbation strength  $a_{mn}$ in (3.6) must be small enough so that the linearization of the energy in (3.2) is valid.
For an axisymmetric equilibrium, there are no initial resonant current components. In that case, the initial parallel electric field perturbation required to create islands has tearing parity and a narrow Lorentzian shape in radius centred about low-order rational surfaces. This approximates the localized (delta function) shielding currents that suppress islands in a VMEC/EFIT equilibrium in the presence of small applied RMPs. A Lorentzian was chosen as a simple representation for a localized even-parity perturbation which is required to tear the magnetic surfaces. Its width was varied to minimize the resulting perturbation of the MHD energy. From (3.2) the energy change will be second-order (quadratic) for small applied perturbation strengths.
4 Numerical results: island formation scaling with perturbation amplitude
All of the numerical results obtained here were computed using a single radial mesh  $N_{s}=101$. The Fourier mode spectra were chosen to be $M\in (0,12)$ and $N\in (-3,3)$ for the poloidal and toroidal mode numbers, respectively. Normalized MHD force residuals were converged to a tolerance of less than $10^{-20}$ in all cases. For these parameters, the parallel SIESTA code converged in about 200 s using 8 processors. The running time scaled approximately linearly with the number of processors up to about $N_{s}/2$ processors, at which point no further reduction in computation time occurred.
Figure 4 shows the resulting magnetic flux contours for the outer half of the DIII-D plasma  $(s>0.5)$ after application of the tearing perturbation $|\boldsymbol{A}_{\Vert }|\sim |\boldsymbol{E}_{\Vert }|\sim a_{2,-1}^{0}$ in (3.1). These perturbations have helicity $m=2$, $n=-1$ in VMEC coordinates with a small amplitude $a_{2,-1}^{0}=10^{-5}$ in figure 4(a) and large amplitude $a_{2,-1}^{0}=10^{-3}$ in figure 4(b). In all cases, the perturbation is centred at the $q=2$ surface $(s=0.7)$. These are the initial states arising from these perturbations and do not correspond to actual equilibria. In fact, the MHD force $\boldsymbol{F}=\boldsymbol{J}\times \boldsymbol{B}-\boldsymbol{{\rm\nabla}}p$ is quite large for both of these configurations, corresponding to a normalized force residual $|\boldsymbol{F}|^{2}\sim 10^{-6}$, since the pressure is unperturbed and no longer satisfies the equilibrium condition $\boldsymbol{B}\boldsymbol{\cdot }\boldsymbol{{\rm\nabla}}p=0$. The magnetic field in SIESTA is normalized to $|\boldsymbol{B}|\sim 1$ so that $|\boldsymbol{F}|^{2}\sim 1$ indicates a large departure from equilibrium. In all cases, departure from the axisymmetric VMEC equilibrium, which corresponds to horizontal lines in the flux plots, is clearly visible due to emergence of islands. Island widths increase approximately as the square root of the perturbation strength, in accordance with theoretical expectations, until overlap of adjacent resonant chains occurs and stochastic magnetic field lines occur, as clearly shown in figure 5(c), which corresponds to the largest tearing perturbation strength ${\sim}3\times 10^{-3}$. Note that the $m=5$, $n=-2$ island chain visible after the initial perturbation in figure 4(c) is almost lost in the stochastic sea of the converged result in figure 5(c).

Figure 4. Flux surface contours immediately after application of a tearing perturbation.  $s$ is the radial flux coordinate and ${\it\theta}$ is the poloidal angle in ${\rm\pi}$ radian units. Only the outer half of the plasma is shown. (a) Small tearing perturbation; (b) large tearing perturbation; (c) largest tearing perturbation.

Figure 5. Converged (equilibrium) flux contours for various perturbation strengths.  $s$ is the radial flux coordinate and ${\it\theta}$ is the poloidal angle in ${\rm\pi}$ radian units. Only the outer half of the plasma is shown. (a) Small tearing perturbation; (b) larger tearing perturbation; (c) largest tearing perturbation.
While the surface splitting is largest at the  $q=2$ surface where the applied perturbation is largest, additional smaller island chains are excited at adjacent low-order rational surfaces corresponding to $q=3$, 4. This spectral ‘pollution’ is due to the fact that the VMEC coordinate system used for the SIESTA calculations is not a straight magnetic field-line set of coordinates (where the resonance operator $B^{u}/B^{v}=1/q$ is a pure number, independent of poloidal and toroidal angles). Small satellite resonances are excited by the primary $m=2$, $n=-1$ perturbation in VMEC coordinates when it is decomposed into straight PEST (Chance et al. Reference Chance, Greene, Grimm, Johnson, Manickam, Kerner, Berger, Bernard, Gruber and Troyon1978) coordinates (as discussed further in § 5), accounting for the excitation of the additional island chains seen in figures 4 and 5.
SIESTA was iterated to reduce the force residuals for these perturbed states to levels below  $|\boldsymbol{F}|^{2}\sim 10^{-20}$. Here, $|\boldsymbol{F}|^{2}$ should vanish in equilibrium. The final equilibrium contours are shown in figure 5. The basic topology of the islands was preserved during the equilibrium iterations by applying only ideal displacements after the initial resistive perturbations. For this study, additional non-ideal perturbations were suppressed to preserve both the island topology generated by the applied perturbation and the equilibrium rotational transform ( $1/q$) profile. In this way, equilibria corresponding to local ideally stable states were generated. It should be noted that although the magnetic contours in figures 4 and 5 look very similar, the same is not true for the pressure contours (not shown). Indeed the unperturbed (2-D) pressure does not satisfy $\boldsymbol{B}\boldsymbol{\cdot }\boldsymbol{{\rm\nabla}}p=0$ for the perturbed state until the equilibrium is achieved.
The reduction in the total energy (magnetic plus kinetic pressure, see figure 6) from the original VMEC equilibrium without islands is quite small for all three cases shown in figure 5, corresponding to  ${\it\delta}W=-(0.16,2.24,8.5)\times 10^{-6}$, respectively. Here, ${\it\delta}W=(W_{\mathit{final}}-W_{\mathit{VMEC}})/W_{\mathit{VMEC}}$ is the normalized energy change in the final equilibrium with islands compared to the initial VMEC equilibrium state. The equilibria with larger islands (figure 5b and c) correspond to lower energy than those with smaller islands and, if physically accessible, would be the preferred equilibrium state for the plasma. The stability of these equilibria could be tested by using them as initial states for time-dependent simulations (Sovinec et al. Reference Sovinec, Glasser, Barnes, Gianakon, Nebel, Kruger, Schnack, Plimpton, Tarditi and Chu2004; Breslau, Ferraro & Jardin Reference Breslau, Ferraro and Jardin2009). The fact that ${\it\delta}W$ continues to decrease with the applied perturbation strength for strengths ${>}2\times 10^{-3}$ suggests that even more stochastic equilibria could be achieved. (Convergence of SIESTA deteriorated for large amplitudes, so this premise could not be tested.) The flattening of the energy decrease versus normalized perturbation strength around 2 suggests that this might be a stable equilibrium (at least with respect to this class of perturbations). It is also coincides with a perturbation strength that gives an equilibrium in closest agreement with experimental temperature profiles (see § 6).

Figure 6. Energy change as a function of the applied resonant  $m=2$, $n=-1$ perturbation strength.

Figure 7. Perturbed pressure and current profiles in PEST and VMEC coordinates for various tearing perturbation strengths. Note that the small-amplitude grid-scale oscillations predominantly appearing in figure 7(a) can be eliminated by recomputing on a finer radial grid (not shown here). (a) Small ( $10^{-5}$) tearing perturbation; (b) larger ( $10^{-3}$) tearing perturbation; (c) largest ( $3\times 10^{-3}$) tearing perturbation.
5 Effect of islands on resonant parallel current
In this section we demonstrate that the equilibrium states shown in figure 5 are characterized by substantially different parallel resonant currents. The equilibrium in figure 5(a), corresponding to very small island widths, is very nearly the same as the original VMEC equilibrium. It has a localized, even-parity resonant parallel current centred on the primary resonance surface near  $s=0.5$ (see figure 7a). This is a remnant of the delta-function ‘shielding current’ which excludes island formation in VMEC. Figure 7(b) shows the same resonant parallel current for the equilibrium in figure 5(b), corresponding to larger island widths. The parity of the parallel current has now become approximately odd so that the radially integrated resonant current is nearly zero in the case of a well-formed island. This is the equilibrium Pfirsch–Schlüter current (in the presence of an island) required by current continuity. In this case it vanishes at the resonant surface because the pressure gradient drive vanishes as the island forms and a small radial component of the magnetic field (allowed by resistive MHD) resolves the resonance singularity. Figure 7(c) shows the resonant current corresponding to the stochastic magnetic field in figure 5(c). The current amplitude around the resonance has increased by almost a factor of 2 compared with figure 7(b). It also has broadened in radial width while maintaining the Pfirsch–Schlüter odd radial structure. Apparently the curvature of the stochastic field lines has increased, which in conjunction with the small residual pressure gradient is enough to drive this moderate amplitude increase.

Figure 8. Profiles of (a) axisymmetric (2-D) electron temperature and (b) toroidal rotation before RMP.
The two sets of curves labelled ‘VMEC’ and ‘PEST’ in figure 7 correspond to the original VMEC angular coordinates and the straight magnetic field-line PEST coordinates, respectively. Both coordinate systems use the geometric toroidal angle (the long way around the torus) as one of the angular coordinates. In PEST, the straight-line poloidal angle is  ${\it\theta}_{\mathit{PEST}}={\it\theta}_{\mathit{VMEC}}+{\it\lambda}(s,{\it\theta}_{\mathit{VMEC}},{\it\varphi})$, where ${\it\lambda}$ is the VMEC current renormalization function. For the case of small, well-separated islands (figure 5a, RMP strength of $10^{-5}$), the VMEC current shows satellite resonances at the $q=3$ and $q=4$ surfaces, whereas these disappear in the PEST representation. For the case of larger magnetic islands (figure 7b and c), the satellite resonances appear in both representations due to nonlinear effects.
6 Comparison with experiment
Experimentally, islands can be characterized via profile flattening. On DIII-D, electron temperature ( $T_{e}$) profiles are measured with poloidally and toroidally displaced Thomson scattering and electron cyclotron emission (ECE) diagnostics. Thomson scattering is located at the toroidal angle ${\it\phi}=120^{\circ }$ along a vertical path that approximately covers poloidal angles ${\it\theta}=45^{\circ }{-}72^{\circ }$. ECE is located at ${\it\phi}=80^{\circ }$ and ${\it\theta}=0^{\circ }$ (outboard midplane). Axisymmetric L-mode temperature profiles measured by Thomson scattering and ECE are shown in upper part of figure 8. The toroidal rotation ( ${\it\Omega}_{c}$) measured by carbon charge-exchange recombination is shown in the lower part of figure 8.

Figure 9. Profiles of electron temperature measured at separate toroidal and poloidal locations at RMP phases  ${\it\phi}=185^{\circ }$ (a) and ${\it\phi}=5^{\circ }$ (b) and toroidal rotation (c) after application of RMP.
The RMP is applied by an external set of correction coils (C-coils) in an  $n=1$ configuration using a 13.6 kA waveform. This applies a dominantly $n=1$ radial magnetic field perturbation that has a resonant pitch-aligned amplitude ${\it\delta}B_{mn}/B_{T}$ at the $q=2$ surface of ${\sim}4\times 10^{-4}$. This amplitude is calculated by Fourier decomposition of the radial field perturbation normal to unperturbed flux surfaces (Schaffer et al. Reference Schaffer, Menard, Aldan, Bialek, Evans and Moyer2008). With sufficiently low neutral beam torque ( $T_{\mathit{inj}}\leqslant 0.3~\text{N}~\text{m}$) and subsequently low rotation, the RMP opens a chain of islands at the $q=2$, 3, 4 surfaces, indicated by temperature flattening in figure 9. This also acts to lock the rotation at the dominant $q=2$ surface, bringing the toroidal rotation to near zero. Modelling the low-rotation island state with SIESTA is appropriate in these conditions because rotation is not treated within the code. The toroidal phase of the applied perturbation is rotated between two positions, $f_{RMP}=5^{\circ }$ and $f_{RMP}=185^{\circ }$. This serves to have the ECE intersect the island X-point at applied $f_{RMP}=5^{\circ }$ phase and the island O-point in the $f_{RMP}=185^{\circ }$ phase for the $2/-1$ island. Thomson scattering samples midway between the O-points and X-points in both phases. The $2/-1$ island is sampled best by Thomson scattering (extending across four channels) and ECE (extending across four channels) in the $f_{RMP}$ 185° phase. This corresponds to an approximate width of $s=0.14$.

Figure 10. Flux contours at toroidal angle  ${\it\phi}=120^{\circ }$ with RMP phase $=$ 5° for initial tearing perturbation of $1.8\times 10^{-3}$ in SIESTA compared to vacuum. Note: the ECE points have been mapped along the magnetic field from different toroidal and poloidal locations.
In the  $5^{\circ }$ phase, the ECE-measured $T_{e}$ profile resembles the axisymmetric L-mode profile from figure 9, suggesting an intact flux surface within the resolution of the diagnostic. Profiles measured with Thomson scattering show clearer $m=2$, 3, 4 island flattening, while the $2/-1$ width appears smaller than in the 185° phase. This is likely the result of sampling a smaller island cross-section and is used to compare with the modelling results below.
The sampling of the diagnostics through the island topology is illustrated in figure 10 (applied 5° phase) and figure 11 (applied 185° phase). Here, a helical perturbation of  $1.8\times 10^{-3}$ and vacuum approximation are shown for each applied phase. (The vacuum approximation consists of superimposing the RMP vacuum fields with the 2-D DIII-D equilibrium.) The ECE and Thomson scattering channel locations are overlaid to show the relative positions where the islands are sampled. Because ECE is toroidally displaced from the Thomson scattering points, the sampling locations are mapped along equilibrium field lines to the toroidal angle of the Thomson scattering. This better illustrates ECE sampling near the O-point in the 185° phase and near the X-point in the 5° phase. The flattened regions measured by the diagnostics are indicated by dashed blue lines. In the 185° phase, the island modelled by SIESTA extends over nearly the full range of the sampled temperature perturbations. The sampling in the 5° phase indicates the possibility that ECE could sample a narrow stochastic region, but it is not large enough to measure on more than one channel. Furthermore, the $2/-1$ island width along the Thomson scattering sampling path is larger than the indicated island size, but similarly under-resolves the edges of the island due to sparse measurements. In both cases, the vacuum estimated island sizes are shown to illustrate that plasma amplification of the tearing response is needed to match experimental conditions. For both toroidal phases shown, the vacuum modelling under-predicts the island width as the region covered by the experimental measurements is wider. The ECE data sampling the X-point in the vacuum case appears in good agreement with the measurements, but this is expected – a temperature profile will not show flattening through the X-point of any arbitrarily small island. For this reason, it is more important to compare the experimental data to regions of measured flattening.

Figure 11. Flux contours at toroidal angle  ${\it\phi}=120^{\circ }$ with RMP phase $=$ 185° for initial tearing perturbation of $1.8\times 10^{-3}$ in SIESTA compared to vacuum. Note: the ECE points have been mapped along the magnetic field from different toroidal and poloidal locations.
The correlation of widths of these flattened regions with the strength of the helical amplitudes applied to the VMEC equilibria is demonstrated in figure 12. The radial width of the island of the primary  $2/-1$ resonance as calculated from figure 5 (and similar plots for intermediate helical perturbations) is plotted versus the applied helical strength. This is compared with the island width estimated from the Thomson scattering and ECE data shown in figure 8. The conclusion is that perturbation strengths between $1.5\times 10^{-3}$ and $2.0\times 10^{-3}$ are in closest agreement with the data, which is approximately 50 % larger than the vacuum islands. In this range, the shielding current is completely eliminated and only odd-parity resonant currents are present, as shown in figure 7(b) and (c). Above the experimentally matched perturbation strengths, the $2/-1$ and $3/-1$ islands overlap (as seen in figure 5c) and create a wide stochastic region (indicated by large error bars in figure 12).

Figure 12.  $m=2$, $n=-1$ island width as a function of the applied initial $2/-1$ tearing perturbation.
This parity change is illustrated in figure 13, where the parallel current is averaged over twice the pressure width (distance between even-parity pressure perturbation peaks as shown in figure 7) and divided by the averaged absolute value, 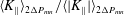 $\langle K_{\Vert }\rangle _{2{\rm\Delta}P_{mn}}/\langle |K_{\Vert }|\rangle _{2{\rm\Delta}P_{mn}}$. Thus, an even parity (screening) current is indicated by $-1$ and an odd parity (resonant) current is indicated by 0. Figure 13 shows that as the perturbation is increased, the parity smoothly varies between the shielding to resonant parallel currents and the experimentally matched perturbation strength shows an odd-parity current. The parity estimate at larger perturbations continues to increase above 0. This is not the result of increased even-parity shielding currents, but is instead a consequence of averaging only over twice the pressure width, while the current perturbation extends much deeper into the core (as shown in figure 7b and c).

Figure 13. Pressure width and resonant current parity as a function of the applied initial  $2/-1$ tearing perturbation.
7 Conclusions
Numerical modelling of 3-D equilibria with applied perturbations using the SIESTA code illustrates key features about the island structure and access to the low-energy island state. The equilibria are based on a DIII-D discharge with islands resulting from external non-axisymmetric magnetic perturbations. Varying the applied magnetic perturbation at the dominant low-order resonant surface  $(q=2)$ within SIESTA accesses a series of 3-D equilibria. Increasing the perturbation level provides access to successively lower energy states that can eventually match experimental conditions. Here, the experimental conditions are matched on the basis of island size measurements. Increasing the perturbation beyond the experimental regime results in further lower energy states that are inaccessible to experiment, likely due to the lack of sufficiently large applied magnetic perturbations.
At very low perturbations, small magnetic islands appear, corresponding to a minimal departure from the original VMEC equilibrium with nested magnetic surfaces. In this case, the resonant parallel current is peaked around the low-order rational surfaces and is a remnant of the shielding current delta function (even parity) required by the VMEC solution. As the perturbation strength increases, the island width increases and the parallel current structure transitions to one that has an odd parity about the resonant surface and vanishes there due to the pressure profile flattening associated with island formation. The island size with odd-parity current best matches the experimental island condition. Further increase of the perturbation strength leads to island overlap and stochastic magnetic fields that in turn lead to pressure (temperature) flattening beyond that seen experimentally.
In experiments, a sufficiently large magnetic perturbation induces a nonlinear transition to a saturated island state beyond that predicted by vacuum modelling absent additional plasma response. Interestingly, the perturbation applied in SIESTA that corresponds to the experimentally observed vacuum island width lies in the region between clear even-parity screening currents and fully odd-parity Pfirsch–Schlüter currents. It is possible that the SIESTA solution indicates nonlinearly unstable internal resistive modes that are difficult to access without sufficient magnetic perturbation. Otherwise, the odd-parity current solution could be found at other perturbation levels, depending on initial conditions. Modelling the access to this nonlinear state is difficult, and it is to be hoped that future work will better address this.
Acknowledgements
The authors thank T. Evans and L. Lao for useful discussions and are grateful for the support of the DIII-D team. The comments from the referees were quite valuable for improving the exposition of the manuscript. This material based on work is supported both by the US Department of Energy, Office of Science, under contract DE-AC05-00OR22725 with UT-Battelle, LLC.


