


School-provided meals are a major source of food for children in the USA. The average daily participation during the fiscal year 2014 was 13·5 million children for school breakfast and 30·3 million children for school lunch( 1 ). On a given day, 18 % of children attending public schools participated in school breakfast, and 62 % participated in school lunch( 2 ). Child nutrition interventions often target schools( 3 – 8 ), and dietary recalls have been used to assess intake of children in upper elementary grades( Reference Baranowski, Baranowski and Cullen 9 – Reference Wong, Boushey and Novotny 16 ). Of the dietary recall, food diary and FFQ, the dietary recall may be more appropriate for obtaining dietary intake information from elementary-school children as it can be administered without advance notice, and is thus unlikely to alter intake( Reference McPherson Day, Hoelscher and Byrd-Williams 17 ), is less burdensome than the food diary( Reference McPherson Day, Hoelscher and Byrd-Williams 17 ) and does not require certain cognitive skills (i.e. averaging consumption) required by a FFQ( Reference Baranowski, Smith and Baranowski 18 – Reference Field, Peterson and Gortmaker 20 ). Nevertheless, validation studies show that children’s dietary recalls can be substantially inaccurate( Reference Baranowski, Islam and Baranowski 21 – Reference Baxter, Thompson and Smith 25 ). Thus, it is important to investigate methods to improve children’s recall accuracy, and to identify conditions in which children’s recall accuracy is maximised.
For a 24-h dietary recall (24hDR), a respondent is to report all foods and drinks consumed during a 24-h period; the recall may be obtained in person, by telephone or by automated self-administration( Reference Neuhouser 26 ). Prominent 24hDRs are multiple-pass procedures, with several passes to elicit reports of different aspects of intake for the target 24 h. The United States Department of Agriculture originally developed the multiple-pass 24hDR method( Reference Moshfegh, Rhodes and Baer 27 ). In passes one through five, respectively, a respondent lists all foods consumed in a 24-h period; an interviewer elicits additional recall by asking about nine categories of foods that are often forgotten; the interviewer collects the time at which each food was eaten and the name of the eating occasion; in chronological order by eating occasion, the interviewer collects details of, and additions to, each food, amount eaten, source (e.g. restaurant or store), and whether it was eaten at home, and then reviews each eating occasion and interval between occasions to elicit additional recall; and the interviewer provides a final opportunity to recall foods( Reference Moshfegh, Rhodes and Baer 27 ).
There are various ways to specify the target 24 h for a 24hDR (e.g. prior 24 h (immediately before the interview), or previous day (midnight to midnight of the day before the interview)). For any such specification, a 24hDR may occur at any time of the day (e.g. morning, afternoon or evening). Choices of target period and interview time determine the elapsed time between the to-be-reported meals and interview, referred to as retention interval (RI). Studies with children in the USA (Georgia and South Carolina) and Wales have shown that dietary recall accuracy decreases as the RI increases( Reference Baxter, Hardin and Guinn 28 – Reference Moore, Tapper and Murphey 34 ).
In addition to RI, any 24hDR has prompts – questions asked in the first pass of a multiple-pass 24hDR to elicit a respondent’s report. As examples, a respondent may be prompted to report intake for the target period in forward order (beginning to end), in reverse order (end to beginning), by meal name (e.g. breakfast, lunch, etc.) or with open prompts (no specific instructions). Prompts may influence recall accuracy, but few validation studies have examined this relationship( Reference Baxter, Thompson and Smith 25 , Reference Baxter, Smith and Guinn 35 ). For a recent validation study( Reference Baxter, Smith and Hitchcock 36 ), we examined the effects of prompts on children’s dietary recall accuracy for school meals, and assessed whether and how the effects of prompts depended on RI.
Dietary recall procedures ask where reported meals were eaten, and recall accuracy is plausibly related to eating location, or variability of eating locations. Our validation study conducted in schools permits investigation of the role of meal location in recall accuracy. In some schools, breakfast is provided and consumed in classrooms; in other schools, breakfast is provided and consumed in the school cafeteria. Children’s breakfast accuracy may be better for classroom than for cafeteria breakfast because location cues could help discriminate classroom breakfast from lunch, located in the cafeteria.
Dietary recall accuracy in validation studies has usually been assessed by transforming reference (e.g. observed) and reported sets of foods to energy and/or nutrients and comparing these( Reference Smith, Baxter and Hardin 37 ). Using this ‘conventional’ approach, reported items are transformed into energy and/or nutrients without regard to whether those items were actually eaten, or determining the amount of each reported item that was actually eaten. Conventional ‘accuracy’ is measured by report rate – the ratio of reported kilocalories to reference kilocalories – with report rates about 100 % interpreted as accurate. However, reported kilocalories include not only kilocalories from items reported eaten that were eaten, but also kilocalories from over-reported amounts of items eaten, and kilocalories from items not eaten. We used these three categories of reported kilocalories, along with reference kilocalories, to calculate two ‘reporting-error-sensitive’ measures – correspondence rate and inflation ratio( Reference Smith, Baxter and Hardin 37 ). Correspondence rate quantifies the match between kilocalories from items reported and kilocalories observed eaten; inflation ratio quantifies over-reporting relative to what was observed eaten. (For any analysed meal, the sum of the correspondence rate and the inflation ratio is the report rate.)
Most publications about validation studies that have used direct observations of school breakfast and school lunch to examine children’s dietary recall accuracy have provided results for the two meals combined, as we did for our recently completed study of the effects of prompts on children’s dietary recall accuracy, and whether and how prompts’ effects depended on RI( Reference Baxter, Smith and Hitchcock 36 ). However, examining accuracy for individual meals can be informative, revealing, for example, particular ways in which reports of different meals differ systematically. In this article, we used data from that study to investigate factors that influence reports of school breakfast and of school lunch, and also compared the pictures of recall accuracy provided by conventional and error-sensitive measures. Our first goal for this article was to examine separately the relationship of accuracy of children’s school-breakfast reports and school-lunch reports in 24hDRs to the variables manipulated in the study. Our second goal was to compare the accuracy of reports for school breakfast located in the classroom and in the cafeteria.
Methods
The study was conducted according to the guidelines laid down in the Declaration of Helsinki and all procedures involving human subjects were approved by the University of South Carolina human subjects review board. Written informed parental consent and child assent were obtained from all subjects. The sample size estimation, sample and data collection methods have been described in detail elsewhere( Reference Baxter, Smith and Hitchcock 36 ), and thus only a summary is provided here.
Sample size
Power calculations were based on the methodologies of Neter et al.( Reference Neter, Kutner and Nachtsheim 38 ) and Winer( Reference Winer 39 ). The required sample sizes were estimated by using rates for omissions (items observed eaten but not reported eaten) and intrusions (items reported eaten but not observed eaten) from school-meal reports in fourth-grade children’s 24hDRs in past studies( Reference Baxter, Thompson and Smith 25 , Reference Baxter, Hardin and Guinn 28 , Reference Baxter, Smith and Litaker 32 ). Assuming α=0·025, we determined that a total of 480 children, with thirty children in each of sixteen cells (two RIs×four prompts×two sexes), were required to detect main effects, two-way interactions and the three-way interaction with power of at least 0·77 for even the smallest effect size of interest.
Sample
Data were collected on fourth-grade children during three school years (2011–2012, 2012–2013 and 2013–2014). Children were from all regular fourth-grade classes from a total of ten public schools from four school districts. At these schools, for the three respective school years, the percentage of children eligible for free or reduced-price school meals ranged from 69 to 85, 58 to 90 and 59 to 90 %. Of 569, 782 and 429 children invited to participate for the three respective school years, 407 (71·5 %), 521 (66·6 %) and 280 (65·3 %) agreed. Each school year, distributions of race/ethnicity and sex of the children who agreed to participate were similar to those of children invited. For the three respective school years, data were collected in six, ten and five schools (twenty-six, thirty-eight and twenty-one classes).
Each district had implemented offer v. serve food service, and thus at each school, of the meal components available at each meal, children could refuse one at breakfast, and one or two at lunch, but had to select a fruit or vegetable at each meal( 40 ). A standard breakfast included fruit, grains and milk, whereas a standard lunch included meat or alternate, grains, fruit, vegetable and milk( 40 ); children had a choice of food items (e.g. fruit, juice, milk flavour, vegetable, entrée) at most meals. In the 3 consecutive years, breakfast was located in the classroom for all classes at two, two and two schools, respectively, and in the cafeteria for all classes at four, seven and three schools, respectively. For one school during the 2012–2013 school year, breakfast was in the cafeteria for all classes but one; some children in that class ate breakfast in the cafeteria, whereas others ate in the classroom. Breakfast locations were designated by school principals and were constant throughout a school year. For the three respective school years of data collection, at the schools in the study where breakfast was located in the cafeteria, the percentage of children eligible for free or reduced-price school meals ranged from 69 to 85, 58 to 90 and 71 to 90 %; at the schools in the study where breakfast was located in the classroom, the respective values ranged from 74 to 81, 60 to 82 and 59 to 82 %. Lunch was located in the cafeteria for all classes at all schools for all school years. Participation in breakfast, regardless of location, and participation in lunch, were optional for each child at each school. Research has shown that participation in school breakfast is related to location, with higher participation rates for classroom than for cafeteria breakfast( Reference Bartfeld and Kim 41 , Reference Bernstein, McLaughlin and Crepinsek 42 ).
Data were collected until 480 children, randomly selected from the pool of consented children each school year with the constraint that half were girls, were observed eating school-provided breakfast and lunch (with both meals observed on the same day for any child), with sixty (half were girls) interviewed to obtain a 24hDR in each of the eight protocol conditions formed by crossing two RIs (‘short’ – prior-24-h recall obtained in the afternoon and ‘long’ – previous-day recall obtained in the morning) with four prompts (forward, meal name, open and reverse). Within school year and school, assignment to condition (by sex) was balanced across classes as much as possible.
Direct meal observations
Research staff observed children eating school breakfast and school lunch according to a standard protocol. One of three observers watched one to three children simultaneously, and, on a paper form, noted items and amounts eaten in servings of standard school meal portions. Observers were present during the entire meal period so that any food trades could be noted( Reference Crawford, Obarzanek and Morrison 23 , Reference Baxter, Thompson and Davis 43 ). For breakfast located in the classroom, children ate at their desks. For breakfast and lunch in the cafeteria, children sat according to the school’s typical arrangement. Interobserver reliability was assessed before and throughout data collection each school year; mean agreement between observers to within one-fourth of a serving on amounts eaten was ≥97 %, which is considered excellent( Reference Baranowski, Dworkin and Henske 44 , Reference Simons-Morton and Baranowski 45 ).
Dietary recall interviews
To obtain 24hDRs, one of four research staff interviewed children (without parental assistance) in person in private at school during the school day, using the protocol for the condition to which the child had been assigned. All interviews were conducted on Tuesdays through Fridays. Interviews concerning the previous day (long RI) were conducted after breakfast, and interviews concerning the prior 24 h (short RI) were conducted after lunch. (Thus, each long RI interview occurred approximately 25 h after the target breakfast and 21 h after the target lunch, with a non-target breakfast intervening between the end of the target period and the interview. Each short RI interview occurred approximately 5 h after the target breakfast and 1 h after the target lunch, with no intervening, non-target meals before the interview.) For prior-24-h-afternoon interviews, children were asked to report intake first for the interview day, and then for the previous day beginning 24 h before the interview start time. This approach, proposed by Buzzard( Reference Buzzard 46 ), has been used previously with children( Reference Baxter, Hardin and Guinn 28 – Reference Baxter, Smith and Litaker 32 ). For each child, different researchers observed meals and conducted the interview.
Training for interviewers included modelling, practice and assessment of pre-data-collection quality control for interviews. Children reported amounts eaten in qualitative terms (e.g. little bit, half, most), and interviewers wrote information reported by children on paper forms. Interviews were audio-recorded and transcribed. Each interviewed child was mailed a $10 cheque. For each interview, quality control was assessed using established procedures( Reference Baxter, Thompson and Smith 25 , Reference Baxter, Hardin and Guinn 28 – Reference Baxter, Hitchcock and Guinn 30 , Reference Baxter, Smith and Litaker 32 , Reference Baxter, Thompson and Litaker 47 , Reference Shaffer, Baxter and Thompson 48 ) to ascertain that the interviewer adhered to the protocol; only interviews that passed quality control were analysed.
Analyses
Analyses were limited to school meals in 24hDRs because only those meals were validated using direct meal observation by research staff. As in past studies( Reference Baxter, Thompson and Litaker 22 , Reference Baxter, Thompson and Smith 25 , Reference Baxter, Hardin and Guinn 28 – Reference Baxter, Hitchcock and Guinn 30 , Reference Baxter, Smith and Litaker 32 , Reference Baxter, Thompson and Litaker 47 ), for a meal reported in a 24hDR to be counted as a school meal, the child had to refer to breakfast as ‘breakfast’ or ‘school breakfast’ and to lunch as ‘lunch’ or ‘school lunch’, the reported location had to be ‘school’, and the reported mealtime had to be within 1 h of the observed mealtime.
To quantify recall accuracy, for each child, for each school meal reported, an established system( Reference Baxter, Thompson and Litaker 22 , Reference Baxter, Thompson and Smith 25 , Reference Baxter, Hardin and Guinn 28 – Reference Baxter, Hitchcock and Guinn 30 , Reference Baxter, Smith and Litaker 32 , Reference Baxter, Thompson and Litaker 47 ) was used to compare the set of food items and amounts reported eaten with the set of food items and amounts observed eaten. Each food item was classified as a match (item observed eaten and reported eaten), an omission (item observed eaten but not reported eaten) or an intrusion (item reported eaten but not observed eaten)( Reference Smith, Jobe and Mingay 49 , Reference Smith 50 ).
Amounts eaten were observed, reported and scored in servings of standard school meal portions as none=0·00, taste=0·10, little bit=0·25, half=0·50, most=0·75, all=1·00 or the actual number of servings if >1·00 serving was observed and/or reported eaten. Information on energy (in kilocalories) for each observed and/or reported item was obtained from the University of Minnesota’s Nutrition Coordinating Center Food and Nutrient Database( 51 ). For observed and reported items for each meal for each child, quantified servings were multiplied by per-serving kilocalories.
For breakfast and lunch separately, a conventional energy measure – report rate – was calculated. Report rate is the reported percentage of the observed energy; it was calculated for each child as (total reported kilocalories/total observed kilocalories)×100. A report rate of 0 % indicates that nothing was reported eaten at a school meal. Report rate has no maximum value, because there is no limit on what a person can report. Traditional interpretation of report rate is that values close to 100 % indicate high accuracy, values >100 % indicate over-reporting and values <100 % indicate under-reporting( Reference Todd and Kretsch 24 , Reference Samuelson 52 , Reference Reynolds, Johnson and Silverstein 53 ).
Also, for breakfast and lunch separately, two reporting-error-sensitive energy measures – correspondence rate and inflation ratio – were calculated( Reference Smith, Baxter and Hardin 37 , Reference Baxter, Guinn and Royer 54 – Reference Baxter, Smith and Hardin 56 ). Correspondence rate is the percentage of the observed kilocalories that are reported correctly; it was calculated for each child as (sum of corresponding kilocalories from matches/sum of observed kilocalories)×100. Corresponding kilocalories from a match are the smaller of the reported kilocalories and the observed kilocalories. A correspondence rate is between 0 %, which indicates that no items observed eaten were reported eaten, and 100 %, which indicates that all items observed eaten were reported eaten, and that all amounts reported eaten were at least as large as amounts observed eaten. Higher correspondence rates indicate better accuracy.
Inflation ratio, a measure of reporting error, indicates the extent to which over-reported kilocalories augment correctly reported kilocalories; it was calculated for each child as (((over-reported kilocalories from matches)+(kilocalories from intrusions))/(total observed kilocalories)))×100. An inflation ratio of 0 % indicates that there were no intrusions and that no amounts of matches were over-reported. Inflation ratio has no maximum value because there is no limit on what a person can report. Smaller inflation ratios indicate better accuracy. For any child for any meal, correspondence rate and inflation ratio sum to report rate.
Data were pooled over three school years for analyses. For each meal, we used χ 2 tests of homogeneity to investigate whether the proportions of children reporting meals that satisfied criteria (to be reports of school meals) varied over levels of RI, prompt, sex and breakfast location.
For breakfast, for report rate as well as for correspondence rate and for square-root-transformed inflation ratio, we used a linear model to ascertain main effects of RI, prompt, sex and breakfast location, their two-way interactions, and the three-way interaction of RI, prompt and sex. For lunch, except for breakfast location, linear models were identical. Control variables were race/ethnicity, school year and district. The transformation of inflation ratio was to help satisfy the normality assumption.
For these linear models, we used generalised estimating equation methodology to account for possible correlation in response values within the same interviewer; an exchangeable correlation structure was assumed. For all models, analysis of residuals was used to check assumptions of constant error variance and normality of errors. We used simultaneous Wald’s tests to jointly test for factor effects in each model, and the Benjamini–Hochberg procedure( Reference Benjamini and Hochberg 57 ) to adjust for simultaneous tests on multiple factors and in multiple models, controlling the false discovery rate at 0·05. All P values reported are adjusted. Statistical analyses used SAS/STAT® (9.4© 2002–2012; SAS Institute Inc.).
Results
The 480 children interviewed were 54 % African American, 31 % white, 10 % Hispanic and 5 % other; their mean age was 10 years and 1 month. Of these children, 245 ate school breakfast in cafeterias and 235 ate school breakfast in their classrooms.
Reporting meals that satisfied criteria to be reports of school meals
A total of 125 children reported no meal that met the criteria to be a report of school breakfast; seventy-one children reported no meal that met the criteria to be a report of school lunch. (In all, twenty-five children are common to these two sets.) We call these children ‘non-reporters’ (for these meals); we call children whose reports satisfied criteria to be reports of school meals ‘reporters’.
Table 1 shows, for each meal, the distribution of meal non-reporters by RI, prompt, sex and breakfast location. A larger proportion of non-reporters than reporters were in the long RI than in the short RI; this was marginally significant for breakfast (χ2=3·13, P=0·08) and significant for lunch (χ2=8·75, P=0·003). For breakfast, a higher proportion of reporters than non-reporters had forward and meal prompts than open and reverse prompts (χ2=7·99, P=0·046). For lunch, meal-reporting status was not associated with prompt (χ2=2·96, P=0·40). Meal-reporting status was not associated with sex (breakfast χ2=0·27, P=0·60; lunch χ2=1·34, P=0·25). For breakfast, meal-reporting status was not associated with breakfast location (χ2=0·06, P=0·80).
Table 1 Number of children who did not report any meal to satisfy criterion to be considered school breakfast (n 125) or school lunch (n 71) for eight conditions created by crossing two retention intervals (RI) with four prompts from a validation study with 480 fourth-grade children

Forward prompts, distant to recent; meal name prompts, breakfast, lunch, etc.; open prompts, no specific instructions; reverse prompts, recent to distant; short RI, recall in the afternoon about the prior 24 h intake; long RI, recall in the morning about the previous day’s intake.
Of the 125 school-breakfast non-reporters, (a) forty-two children (34 %) failed to report any breakfast, (b) twenty-four children (19 %) failed to report ‘school’ as the breakfast location (with twenty-two of twenty-four reporting ‘home’ as the breakfast location), (c) twenty-six children (21 %) failed to report the school-breakfast mealtime within 1 h of the observed mealtime and (d) thirty-three children (26 %) failed to report ‘school’ as the breakfast location and failed to report the school-breakfast mealtime within 1 h of the observed mealtime (with six of thirty-three reporting >1 breakfast). Of the seventy-one school-lunch non-reporters, (a) twenty-three children (32 %) failed to report any lunch, (b) one child failed to report ‘school’ as the lunch location, (c) forty-one children (58 %) failed to report the school-lunch mealtime within 1 h of the observed mealtime (with eight of forty-one reporting >1 lunch), and (d) seven children (10 %) failed to report ‘school’ as the lunch location and failed to report the school-lunch mealtime within 1 h of the observed mealtime.
In analyses of report rate, correspondence rate and inflation ratio described in subsequent sections, we did not include the 125 breakfast non-reporters, nor the seventy-one lunch non-reporters. Our rationale to not include them in analyses is as follows: for these children for these meals, the value of each of report rate, correspondence rate and inflation ratio was 0 %. These values satisfy the intuition that, for these children, the value of report rate should indicate (maximal) under-reporting and the value of correspondence rate should indicate maximum error. However, a 0 % inflation ratio indicates maximum accuracy for the aspect of performance that it quantifies (i.e. it indicates that nothing that should not have been reported was reported), which conflicts with intuition. Although one might argue that meal non-reporters should be included in the analyses of report rate and correspondence rate, including them in analyses of inflation ratio would overestimate reporting accuracy by children in the sample.
Report rate
As explained earlier, report rate is total reported kilocalories divided by total observed kilocalories. We use customary interpretation to describe results, with values closest to 100 % as indicating accurate reporting, values >100 % as indicating over-reporting and values <100 % as indicating under-reporting.
Breakfast
Table 2 shows least squares means for breakfast report rate by RI, prompt, sex and location. The main effects of prompt (P<0·0003) and location (P<0·0019) were significant; these effects must be understood within the context of significant RI×prompt (P<0·0003), prompt×sex (P<0·0003), RI×prompt×sex (P=0·0011) and prompt×location (P=0·0141) interactions. Not significant were the main effects of RI (P=0·92) and sex (P=0·92), and the RI×sex (P=0·89), RI×location (P=0·89) and sex×location (P=0·46) interactions.
Table 2 Report rate – a conventional energy measure – for breakfast by retention interval (RI), prompt, sex and location, and for lunch by RI, prompt and sex, from a validation study of eight 24-h recall interview conditions with fourth-grade children (Mean values with their standard errors)
Report rate, the reported percentage of the observed amount calculated for energy for each child for breakfast and lunch separately as (total reported kilocalories/total observed kilocalories)×100, and with a lower bound of 0 % which indicates nothing was reported, and with no upper bound because there is no limit on what a person can report, and with traditional interpretation that values close to 100 % indicate high accuracy and that values >100 % indicate over-reporting and that values <100 % indicate under-reporting, and with report rate=correspondence rate+inflation ratio; forward prompts, distant to recent; meal name prompts, breakfast, lunch, etc.; open prompts, no specific instructions; reverse prompts, recent to distant; short RI, recall in the afternoon about the prior 24 h intake; long RI, recall in the morning about the previous day’s intake.
* Breakfast report rate – not significant were main effects of RI (P=0·92) and sex (P=0·92), and interactions of RI×sex (P=0·89), RI×location (P=0·89) and sex×location (P=0·46) (Wald’s tests).
† Lunch report rate – not significant were the main effect of RI (P=0·83) and interactions of prompt×sex (P=0·62) and RI×sex (P=0·16) (Wald’s tests).
The three-way interaction was due to different patterns of report rates by the two sexes over the four prompts at the two RIs. With the short RI, girls’ breakfast report rate was most accurate with forward (98·9 %), over-reported with open (113·1 %) and under-reported with meal name (89·9 %) and reverse (91·5 %) prompts, whereas boys’ report rate was most accurate with meal name (101·8 %), over-reported with reverse (113·4 %) and under-reported with forward (94·5 %) and open (85·7 %) prompts. With the long RI, girls’ breakfast report rate was most accurate with open (108·1 %), over-reported with reverse (126·7 %) and under-reported with meal name (77·8 %) and forward (84·6 %) prompts, whereas boys’ report rate was most accurate with forward (97·1 %) and meal name (99·0 %), over-reported with reverse (129·5 %) and under-reported with open (55·2 %) prompts.
Analyses of these data indicated over-reporting for breakfast located in the cafeteria (118·3 %) and under-reporting for breakfast located in the classroom (77·6 %). The prompt×location interaction indicated variation in the size of the difference over the four prompts. Breakfast report rates (cafeteria, classroom) by prompt were as follows: forward (108·6, 79·0 %), meal name (105·3, 79·0 %), open (116·8, 64·3 %) and reverse (142·6, 88·0 %).
It is noteworthy that, overall, breakfast report rate was unrelated to RI. Averaging across all other variables, breakfast report rate for the short RI was 98·6 % and for the long RI was 97·3 % – these values are conventionally interpreted as accurate.
Lunch
Table 2 also shows least squares means for lunch report rate by RI, prompt and sex. The main effects of prompt and sex were significant, as were the RI×prompt and RI×prompt×sex interactions (four P-values<0·0002). Not significant were the main effect of RI (P=0·83) and the prompt×sex (P=0·62) and RI×sex (P=0·16) interactions. For the three-way interaction, with the short RI, girls’ lunch report rate was most accurate with open (92·8 %) and forward (89·6 %) prompts, not over-reported for any of the four prompts, and under-reported with meal name (83·2 %) and reverse (77·2 %) prompts, whereas boys’ lunch report rate was most accurate with reverse (96·5 %), over-reported with open (109·1 %) and under-reported with forward (81·0 %) and meal name (78·1 %) prompts. With the long RI, girls’ lunch report rate was most accurate with reverse (99·6 %), not over-reported for any of the four prompts, and under-reported with forward (82·2 %), meal name (66·0 %) and open (69·5 %) prompts, whereas boys’ lunch report rate was most accurate with meal name (99·8 %), over-reported with forward (113·9 %) and under-reported with open (71·9 %) and reverse (87·1 %) prompts.
It is noteworthy that, as for breakfast report rate, the effect of RI on lunch report rate was not significant. Averaging across all other variables, lunch report rate for the short RI was 88·4 % and for the long RI was 86·2 %.
Correspondence rate
Correspondence rate indicates the extent to which kilocalories from items reported eaten match kilocalories observed eaten; it is the ratio of matching kilocalories to observed kilocalories. As explained earlier, a correspondence rate is between 0 and 100 %. Higher values indicate better accuracy.
Breakfast
Table 3 shows least squares means for breakfast correspondence rate by RI, prompt, sex and location. The main effects of RI, prompt and location were significant, as were interactions of RI×prompt, prompt×sex and RI×prompt×sex (six P-values<0·0003). Not significant was the main effect of sex (P=0·89) and the RI×sex (P=0·98), RI×location (P=0·71) and sex×location (P=0·98) interactions. The prompt×location (P=0·0556) interaction was not quite significant, using a significance level that controls the false discovery rate at 0·05.
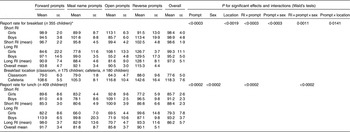
Table 3 Correspondence rate and inflation ratio – reporting-error-sensitive energy measures – for breakfast by retention interval (RI), prompt, sex and location, from a validation study of eight 24-h recall interview conditions with fourth-grade children (Mean values with their standard errors)

Forward prompts, distant to recent; meal name prompts, breakfast, lunch, etc.; open prompts, no specific instructions; reverse prompts, recent to distant; short RI, recall in the afternoon about the prior 24 h intake; long RI, recall in the morning about the previous day’s intake.
* Correspondence rate is the percentage of the observed amount that is reported correctly. It was calculated for energy for each child for breakfast as (corresponding kilocalories from matches/observed kilocalories)×100. A match is observed eaten and reported eaten. Corresponding kilocalories from a match are the smaller of reported kilocalories and observed kilocalories. Correspondence rate may range from 0 to 100 %. Higher rates indicate better accuracy. Breakfast correspondence rate – not significant were the main effect of sex (P=0·89) and interactions of RI×sex (P=0·98), RI×location (P=0·71), sex×location (P=0·98) and prompt×location (P=0·0556) (Wald’s tests).
† Inflation ratio reflects the extent to which reported kilocalories do not match kilocalories observed eaten; it is the ratio of reported non-matching kilocalories to observed kilocalories. It was calculated for energy for each child for breakfast as (((over-reported kilocalories from matches)+(kilocalories from intrusions))/(total observed kilocalories)))×100. The over-reported kilocalories from a match are the amount by which reported kilocalories exceed observed kilocalories (or 0 if reported kilocalories are less than or equal to observed kilocalories). An intrusion is reported eaten, but not observed eaten. The kilocalories from an intrusion are the entire reported kilocalories for each intrusion. Inflation ratio has a lower bound of 0 % but no upper bound. Smaller values indicate better accuracy. For analyses, inflation ratio was square-root transformed to help satisfy the normality assumption. Breakfast inflation ratio – not significant were main effects of prompt (P=0·49) and sex (P=0·89), and interactions of RI×sex (P=0·89), RI×location (P=0·92) and sex×location (P=0·89) (Wald’s tests).
On average, breakfast correspondence rate was higher with the short (67·2 %) than with the long (42·4 %) RI. For the three-way interaction, with the short RI, girls’ breakfast correspondence rate was highest with forward (78·0 %) and reverse (72·4 %) prompts and lowest with meal name (60·2 %) and open (62·3 %) prompts, whereas boys’ breakfast correspondence rate was highest with reverse (75·7 %) and lowest with forward (58·2 %) and meal name (60·9 %) prompts. With the long RI, girls’ breakfast correspondence rate was highest with meal name (55·9 %) and lowest with open (32·5 %) prompts, whereas boys’ breakfast correspondence rate was highest with reverse (53·4 %) and forward (49·9 %) prompts and lowest with meal name (31·7 %) and open (30·0 %) prompts.
Breakfast correspondence rates were higher for breakfast located in the classroom (61·9 %) than for breakfast in the cafeteria (47·7 %). Although the prompt×location interaction was not significant at the 0·05 level, there was some evidence of variation in the classroom advantage over the four prompts. Breakfast correspondence rates (classroom, cafeteria) by prompt were as follows: forward (60·9, 50·5 %), meal name (65·8, 38·6 %), open (53·8, 43·7 %) and reverse (67·0, 58·0 %).
Lunch
Table 4 shows least squares means for lunch correspondence rate by RI, prompt and sex. The main effects of RI and prompt were significant, as was the interaction of RI×prompt (three P-values<0·0002). Not significant was the main effect of sex (P=0·94) and the prompt×sex (P=0·20), RI×sex (P=0·46) and RI×prompt×sex (P=0·84) interactions. On average, lunch correspondence rate was higher with the short (70·6 %) than with the long (53·2 %) RI. For the RI×prompt interaction, with the short RI, lunch correspondence rate was highest with open (76·1 %) and lowest with meal name (66·9 %) prompts, whereas with the long RI, lunch correspondence rate was highest with reverse (67·4 %) and lowest with meal name (45·8 %) and open (47·0 %) prompts.
Table 4 Correspondence rate and inflation ratio – reporting-error-sensitive energy measures – for lunch by retention interval (RI), prompt and sex from a validation study of eight 24-h recall interview conditions with fourth-grade children (Mean values with their standard errors)
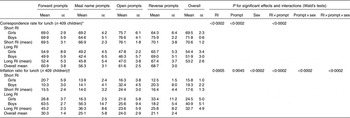
Forward prompts, distant to recent; meal name prompts, breakfast, lunch, etc.; open prompts, no specific instructions; reverse prompts, recent to distant; short RI, recall in the afternoon about the prior 24 h intake; long RI, recall in the morning about the previous day’s intake.
* Correspondence rate is the percentage of the observed amount that is reported correctly. It was calculated for energy for each child for lunch as (corresponding kilocalories from matches/observed kilocalories)×100. A match is observed eaten and reported eaten. Corresponding kilocalories from a match are the smaller of reported kilocalories and observed kilocalories. Correspondence rate may range from 0 to 100 %. Higher rates indicate better accuracy. Lunch correspondence rate – not significant were the main effect of sex (P=0·94) and interactions of prompt×sex (P=0·20), RI×sex (P=0·46) and RI×prompt×sex (P=0·84) (Wald’s tests).
† Inflation ratio reflects the extent to which reported kilocalories do not match kilocalories observed eaten; it is the ratio of reported non-matching kilocalories to observed kilocalories. It was calculated for energy for each child for lunch as (((over-reported kilocalories from matches)+(kilocalories from intrusions))/(total observed kilocalories)))×100. The kilocalories from a match are the amount by which reported kilocalories exceed observed kilocalories (or 0 if reported kilocalories are less than or equal to observed kilocalories). An intrusion is a food that is reported eaten, but not observed eaten. The kilocalories from an intrusion are the entire reported kilocalories for each intrusion. Inflation ratio is a measure of reporting error. It has a lower bound of 0 % but no upper bound. Smaller values indicate better accuracy. For analyses, inflation ratio was square-root transformed to help satisfy the normality assumption. Lunch inflation ratio – not significant was the RI×sex interaction (P=0·0628) (Wald’s test).
Inflation ratio
Inflation ratio indicates the extent to which reported kilocalories do not match kilocalories observed eaten; it is the ratio of reported non-matching kilocalories to observed kilocalories. Higher values indicate more error.
Breakfast
Table 3 also shows least squares means for breakfast inflation ratio by RI, prompt, sex and location. The main effects of RI and location were significant, as were the RI×prompt, prompt×sex, RI×prompt×sex (five P-values<0·0007) and prompt×location (P=0·0016) interactions. Not significant were the main effects of prompt (P=0·49) and sex (P=0·89), and the RI×sex (P=0·89), RI×location (P=0·92) and sex×location (P=0·89) interactions. On average, breakfast inflation ratio was lower with the short (31·3 %) than with the long (55·0 %) RI. For the three-way interaction, with the short RI, girls’ breakfast inflation ratio was lowest with reverse (18·4 %) and forward (21·1 %) prompts and highest with open (51·1 %) prompts, whereas boys’ breakfast inflation ratio was lowest with open (15·4 %) and highest with the other three (36·5–41·0 %) prompts. With the long RI, girls’ breakfast inflation ratio was lowest with meal name (22·0 %) and highest with open (76·0 %) and reverse (78·5 %) prompts, whereas boys’ breakfast inflation ratio was lowest with open (24·9 %) and highest with reverse (76·3 %) prompts.
Breakfast inflation ratio was substantially lower for breakfast located in the classroom (15·6 %) than for breakfast in the cafeteria (70·7 %). The prompt×location interaction was due to variation in the difference in inflation ratios between locations over the four prompts. The average inflation ratios (classroom, cafeteria) by prompt were as follows: forward (18·4, 57·8 %), meal name (13·2, 66·8 %), open (10·3, 73·4 %) and reverse (20·6, 84·9 %).
Lunch
Table 4 also shows least squares means for lunch inflation ratio by RI, prompt and sex. The main effects of RI (P=0·0005), prompt (P=0·0045) and sex (P<0·0002) were significant, as were interactions of RI×prompt, prompt×sex and RI×prompt×sex (three P-values<0·0002). Not quite significant, using a significance level that controls the false discovery rate at 0·05, was the RI×sex interaction (P=0·0628). On average, lunch inflation ratio was lower with the short (17·6 %) than with the long (32·7 %) RI. For the three-way interaction, with the short RI, girls’ lunch inflation ratio was lowest with reverse (12·5 %) and meal name (13·9 %) prompts and highest with forward (20·7 %) prompts, whereas boys’ lunch inflation ratio was lowest with forward (10·3 %) and highest with open (32·4 %) prompts. With the long RI, girls’ lunch inflation ratio was lowest with meal name (16·3 %) and highest with reverse (33·4 %) prompts, whereas boys’ lunch inflation ratio was lowest with reverse (18·2 %) and open (25·6 %) prompts and highest with meal name (56·3 %) and forward (63·5 %) prompts.
Discussion
In the current study, we analysed validation-study data( Reference Baxter, Smith and Hitchcock 36 ) to investigate RI and prompt effects on accuracy of fourth-grade children’s reports of school-breakfast and school-lunch (obtained in 24hDRs) and to compare accuracy of school-breakfast reports by breakfast location (classroom; cafeteria). We used two different approaches to assess accuracy.
According to correspondence rate and inflation ratio – the reporting-error-sensitive measures – accuracy for energy-transformed reports of intake was better with the short RI than with the long RI for breakfast reports and for lunch reports (in 24hDRs). This was not surprising as other validation studies have shown that recall accuracy is related to RI( Reference Baxter, Hardin and Guinn 28 – Reference Moore, Tapper and Murphey 34 ). However, some of those validation studies obtained single-meal recalls, and some validation studies that obtained 24hDRs did not analyse accuracy for breakfast and lunch separately. This finding provides further evidence that recalls should be obtained as close in time to the eating events as possible.
In contrast, according to report rate – the conventional measure – accuracy did not depend on RI for breakfast or for lunch. Past comparisons of the reporting-error-sensitive and conventional approaches for analysing accuracy for reporting energy have found that report rate overestimates and provides a distorted picture of accuracy( Reference Smith, Baxter and Hardin 37 , Reference Baxter, Guinn and Royer 54 – Reference Baxter, Smith and Hardin 56 ). Thus, accuracy results for validation studies from the conventional measure (report rate) and from the reporting-error-sensitive measures (correspondence rate and inflation ratio) suggest different pictures of accuracy. This article’s findings reinforce the importance of analysing recall accuracy in validation studies by examining which items or amounts were reported correctly rather than by simply dividing ‘reported energy’ by ‘reference (e.g. observed) energy’. Aside from our publications( Reference Smith, Baxter and Hardin 37 , Reference Baxter, Guinn and Royer 54 – Reference Baxter, Smith and Hardin 56 ), the reporting-error-sensitive approach has been cited in some publications( Reference Duffey and Popkin 58 – Reference Gleason, Harris and Sheean 60 ), but used in few( Reference Nielsen 61 ).
Analyses of correspondence rate, and especially of inflation ratio, indicate that reporting accuracy appeared better for lunch than for breakfast. This result is likely related to the result that accuracy was better with the short than with the long RI. With the short RI (prior-24-h-afternoon), the approximate number of hours between eating breakfast and the 24hDR was five, and between eating lunch and the 24hDR was one. However, for the long RI (previous-day-morning), the approximate number of hours between eating breakfast and the 24hDR was twenty-five, and between eating lunch and the 24hDR was twenty-one. Thus, on average in this study, the number of hours between eating and the 24hDR for lunch (11 h) was less than for breakfast (15 h).
However, average report rates suggest that accuracy for breakfast appeared better than that for lunch. Thus, report rate provided results that were opposite of those from correspondence rate and inflation ratio concerning accuracy for breakfast v. lunch. Simply dividing ‘reported energy’ by ‘observed energy’ without accounting for which items or amounts were reported correctly distorts the picture of reporting accuracy.
For two past validation studies, we provided accuracy results of fourth-grade children’s school-breakfast reports and school-lunch reports (obtained in 24hDRs) separately. In our 2007 article( Reference Baxter, Royer and Hardin 62 ), when children reported after breakfast about the previous day’s intake, school-lunch reports were more accurate than school-breakfast reports, as indicated by higher correspondence rates for lunch than for breakfast and lower inflation ratios for lunch than for breakfast; report rate was not assessed in the 2007 article. In our 2009 article( Reference Baxter, Guinn and Royer 63 ), accuracy for school-breakfast reports and school-lunch reports in 24hDRs was best when the RIs were shortest, and accuracy decreased as the RI increased. Specifically, as indicated by higher correspondence rates and lower inflation ratios, accuracy for school-breakfast reports was best for prior-24-h recalls conducted in the morning, and accuracy for school-lunch reports was best for prior-24-h recalls conducted in the afternoon, but report rates for school-breakfast reports and for school-lunch reports did not differ significantly by RI condition. However, in neither study did we manipulate prompts to examine their effects on recall accuracy.
For the current study, for each reporting-error-sensitive measure (correspondence rate, inflation ratio), for each of breakfast and lunch, the three-way RI×prompt×sex interaction was significant, except for lunch correspondence rate for which the two-way RI×prompt interaction was significant. Interpretations of the three-way interactions are aided by the bar graphs in Fig. 1 and 2, which show least squares means for each combination of levels of the three factors. In these graphs, the correspondence rate was subtracted from 100 so that in each graph a lower value indicates better accuracy. The most prominent feature of the graphs is that for each sex, for almost all prompts, accuracy was better with the short RI than with the long RI. Exceptions from this differed for boys and girls. Consider the breakfast data (Fig. 1): for girls, the accuracy advantage of the short RI (in correspondence rate and in inflation ratio) disappeared with meal name prompts. For boys, the accuracy advantage of the short RI was mitigated (in correspondence rate) with forward prompts and (in inflation ratio) with forward and open prompts. Consider the lunch data (Fig. 2): accuracy was generally better with the short RI than with the long RI; however, irrespective of sex, the accuracy advantage of the short RI (in correspondence rate) was most prominent with open prompts and decreased or disappeared with reverse prompts. For girls, the accuracy advantage (in inflation ratio) of the short RI was mitigated with forward and meal name prompts. For boys, the accuracy advantage (in inflation ratio) was only substantial for forward and meal name prompts. These results do not provide a clear basis for recommendations concerning prompts. Particular prompts may work differently for boys and for girls.

Fig. 1 Breakfast correspondence rate and breakfast inflation ratio, each for the two-way retention interval (RI)×prompt interaction. The heights of the bars represent averages (per RI-prompt-sex combination) of the correspondence rate subtracted from 100 (top row) and of inflation ratio (bottom row), so that in all cases lower heights represent better accuracy. ![]() , Short RI;
, Short RI; ![]() , long RI; the four categories along the horizontal axis are the four prompts.
, long RI; the four categories along the horizontal axis are the four prompts.

Fig. 2 Lunch correspondence rate and lunch inflation ratio, each for the two-way retention interval (RI)×prompt interaction. The heights of the bars represent averages (per RI-prompt-sex combination) of the correspondence rate subtracted from 100 (top row) and of inflation ratio (bottom row), so that in all cases lower heights represent better accuracy. ![]() , Short RI;
, Short RI; ![]() , long RI; the four categories along the horizontal axis are the four prompts.
, long RI; the four categories along the horizontal axis are the four prompts.
There was a relationship between children’s breakfast accuracy and location of school breakfast. The reporting-error-sensitive measures – correspondence rate and inflation ratio – showed that, regardless of prompt, children’s reporting accuracy was better for breakfast in the classroom than for breakfast in the cafeteria. Yet report rate communicated a very different picture: the average report rate was somewhat closer to 100 % (i.e. more accurate) for breakfast located in the cafeteria than for breakfast located in the classroom for three of the four prompts. With customary interpretation that report rates closer to 100 % are better, the accuracy results by breakfast location were opposite for the reporting-error-sensitive measures and the conventional measure.
Few studies have examined the relationship between children’s dietary recall accuracy and school-breakfast location. In our 2009 study( Reference Baxter, Guinn and Royer 63 ), none of correspondence rate, inflation ratio or report rate was related to accuracy of school-breakfast reports by school-breakfast location.
For the current study, there are several possible explanations for recall accuracy, indexed by the reporting-error-sensitive measures, to have been better for breakfast located in the classroom than in the cafeteria. The cafeteria environment was often noisier and more chaotic than the classroom environment; the calmer classroom environment may have helped those children be more mindful of their food intake. Children had more breakfast options when breakfast was located in the cafeteria than in the classroom. For example, in the cafeteria, children could often choose between a hot (e.g. sausage biscuit) and cold (e.g. ready-to-eat cereal) option, whereas in the classroom often only one option was available. Perhaps having more options in the cafeteria affected children’s recall accuracy.
We conducted post hoc analyses on lunch data with breakfast location as a variable to determine whether recall accuracy for lunch was related to breakfast location. Results showed that for no response variable was lunch accuracy significantly related to breakfast location: report rate (unadjusted P=0·1779), correspondence rate (unadjusted P=0·9385), inflation ratio (unadjusted P=0·2089). Thus, our supposition in the introduction that different school breakfast locations could help children discriminate breakfast and lunch, and thereby improve recall accuracy, appears to not be supported.
The distributions of the 125 school breakfast non-reporters and the seventy-one school lunch non-reporters over conditions deserve discussion. Concerning RI, for breakfast, there were 1·3 times as many meal non-reporters with the long RI than with the short RI (seventy-one v. fifty-four). For lunch, there were twice as many meal non-reporters with the long RI than with the short RI (forty-seven v. twenty-four). This is consistent with findings that recall accuracy for children whose reports satisfied the criteria was worse with the long RI than with the short RI. Concerning prompt, meal non-reporters were distributed across all four prompts for breakfast and for lunch (see Table 1). It is notable that some children did not report meals even when meal name prompts were used. (With meal name prompts, children were directly asked ‘Did you eat breakfast?’ and ‘Did you eat lunch?’). With regard to sex, for breakfast the meal non-reporters were sixty girls and sixty-five boys, and for lunch the meal non-reporters were thirty-one girls and forty boys. Thus, although sex was unrelated to reporting status for breakfast, it was somewhat related for lunch, with 1·3 times as many boys as girls being meal non-reporters. With regard to location, sixty children with breakfast located in the classroom and sixty-five children with breakfast located in the cafeteria were meal non-reporters; thus, location was not a factor.
One limitation of the validation study that provided data analysed for this article was that only fourth-grade children were recruited to participate. Another limitation is that children were not assigned randomly to breakfast location. A third limitation is that because amounts eaten were observed and reported in a qualitative manner (i.e. servings of standard school meal portions), kilocalorie measures are not precise. However, the same procedure was used throughout data collection for all meal observations, and for reported information by all 480 children interviewed. Furthermore, the same method was used to convert qualitative terms from meal observations and 24hDRs into quantities of kilocalories. A fourth limitation is that data collection cells were not stratified by race/ethnicity; however, race/ethnicity was a control variable in analyses.
Strengths include those of the RI-and-prompt validation study. Specifically, reference information was obtained by direct meal observations. More children were recruited than needed for data collection, which made it difficult for children to determine who specifically was being observed, and to anticipate whether they would be interviewed. Rigorous and regular quality control was implemented for meal observations and interviews before and throughout data collection. Few past validation studies have examined the accuracy of children’s school-breakfast reports and school-lunch reports (obtained during 24hDRs) separately.
In conclusion, in deciding to use dietary recalls, researchers and practitioners also decide which RI and prompts will be used for those recalls. To maximise recall accuracy, a short RI should be selected, whereas recommendations concerning the selection of specific prompts are less clear. Report rates provide a misleading picture of accuracy, and thus researchers should use reporting-error-sensitive measures to analyse validation-study data. In future validation studies, if meal location can be investigated as a potential source of systematic variability, it would be helpful to do so to accumulate information about this.
Acknowledgments
The authors thank the children and staff of the schools and districts (Richland 1, Lexington-Richland 5, Lexington 3, Lexington 4) in South Carolina for allowing data collection. The authors thank Kate K. Vaadi for help with data collection and scheduling, and Christina M. Devlin for help with scheduling.
This work was supported by the National Institutes of Health (NIH), National Heart, Lung, and Blood Institute (NHLBI) (grant R01HL103737, principal investigator S. D. B.). The NIH and the NHLBI had no role in the design, analysis or writing of this article. The content of this article is solely the responsibility of the authors and does not necessarily represent the official views of the NIH or the NHLBI. S. D. B.’s current and previous research has been funded by competitive grants from the NIH as well as the United States Department of Agriculture. She has served as a grant reviewer for the NIH and the Centers for Disease Control and Prevention. She is on the Board of Editors for the Journal of the Academy of Nutrition and Dietetics. A. F. S.’s research has been funded externally by competitive grants from the NIH. D. B. H.’s research has been funded by the South Carolina Department of Education and the University of South Carolina Research and Productivity Program.
S. D. B. was principal investigator and wrote the manuscript. S. D. B., A. F. S. and D. B. H. contributed to the interpretation of findings. S. D. B. and A. F. S. contributed to the study design. C. H. G. and A. F. S. contributed to manuscript writing. C. H. G. contributed to data coding and conducted quality control for interviews. D. B. H. contributed to data analyses. J. A. R. programmed data files and analysed data. M. P. P., K. L. C. and A. L. S. contributed to data collection, data coding and data entry. All authors read and approved the final version of the manuscript.
C. H. G., J. A. R., M. P. P., K. L. C. and A. L. S. have no conflicts of interest to disclose.


