


Dairy foods are recognised as an important provider of nutrients, and are rich in many minerals including Ca, Mg, P and Zn, as well as vitamins A, D, E and K( Reference Gaucheron 1 ). Dairy products is the main source of dietary Ca in many countries including the USA( Reference Rafferty and Heaney 2 ), the UK( Reference Bates, Lennox and Prentice 3 ) and most of Northern Europe, providing a source that cannot be replaced easily with other foods in the diet, as shown by nutrient modelling( Reference Fulgoni, Keast and Auestad 4 ). Yet, despite the known beneficial nutritional content of dairy foods, dairy consumption may be in decline. A study in Swiss older adults showed that 27 % had reduced their dairy consumption, mainly via liquid milk intake (25 %), for fat and cholesterol intake, and body weight concerns( 5 ). Limited data are available on recent secular trends of dairy intake, but recent data from the FAO suggest that, although milk and dairy intakes are increasing in developing countries, intakes have declined slightly in developed countries( Reference Muehlhoff, Bennett and McMahon 6 ). Reports from the USA( Reference Posner, Franz and Quatromoni 7 ) and the UK( Reference Ng, Mhurchu and Jebb 8 ) show that whole-milk intake has been in decline since the 1970s, whereas intakes of reduced-fat milk have increased. These declines may be linked to the fact that over-consumption of nutrients such as Na (in the form of sodium chloride; salt) and SFA, both present in dairy foods, have been associated with increased blood pressure( Reference Cruz, Faria and Pollonio 9 ) and risk of CHD( Reference Artaud-Wild, Connor and Sexton 10 , Reference Hu, Stampfer and Manson 11 ), and as such have been targeted in public health campaigns( 12 , Reference Drewnowski, Maillot and Rehm 13 ). In Western countries, the main food sources of dietary Na, excluding discretionary salt added at the table and in home cooking, are ‘breads and cereals’ and ‘meat and meat products’, as shown by the INTERnational study on MAcro/micronutrients and blood Pressure (INTERMAP)( Reference Anderson, Appel and Okuda 14 – 16 ). Dairy foods are also substantial contributors to Na, providing approximately 11 % of dietary Na in the USA and 8 % in the UK( Reference Anderson, Appel and Okuda 14 , Reference Mhurchu, Capelin and Dunford 15 ). Cheese has been highlighted as a target for salt reduction( 16 ), and this area has recently received considerable media attention, following a survey that reported the high salt content of a wide range of supermarket cheeses( Reference Hashem, He and Jenner 17 ). In addition to Na, dairy foods and particularly cheese are also considered significant sources of SFA in the diet( Reference Subar, Krebs-Smith and Cook 18 , Reference Huth, Fulgoni and Keast 19 ), as over 60 % of the fat in bovine milk (and milk products) is saturated( Reference Mansson 20 ). The vast majority of country-specific guidelines have stated that SFA intake should account for no more than 10 % of our daily energy intake (EI)( Reference Aranceta and Perez-Rodrigo 21 ), with the American Heart Association Nutrition Committee and the European Heart Network recommending 7 % as the maximum daily intake( Reference Lichtenstein, Appel and Brands 22 , 23 ). Therefore, cheese may contribute to a significant proportion of dietary SFA. To date, the majority of studies examining intake of dairy foods have focused on milk( Reference Elwood, Pickering and Givens 24 ) or have defined dairy products as milk, cheese and yogurt only( Reference Louie, Flood and Hector 25 ), whereas foods such as cream, crème fraiche and butter, rich sources of dairy fats, are less studied( Reference Elwood, Pickering and Givens 24 ). Further, although cheeses can vary widely in their fat content, and accordingly their SFA content, they are often grouped together as one food group. As dietary intake guidelines are reviewed, it will be important to have up-to-date data on the contribution of dairy foods to nutrients. Thus, there were two main aims of the present analysis: first, to detail dairy intakes in Ireland in their totality, including milk, cheese, yogurt, cream and butter, with a particular focus on cheese; and, second, to examine the contribution of dairy foods, again with an emphasis on cheese, to population nutrient intakes.
Methods
Dietary intake data collection
The data for this analysis were collected as part of the National Adult Nutrition Survey (NANS). Ethics approval was obtained from University College Cork Clinical Research Ethics Committee of the Cork Teaching Hospitals and the Human Ethics Research Committee of University College Dublin, and all participants provided their written informed consent. A nationally representative sample (according to the 2006 Irish census)( 26 ) of 1500 randomly selected, free-living adults aged 18–90 years participated in the study. Participants were selected from a national postal database to deliver at least 100 individuals in the least-populated age and sex subgroups and represented a final response rate of 60 %.
The methodology used in the NANS has been described in detail elsewhere( Reference Hennessy, Hannon and Walton 27 ) and is also available online( 28 ). In brief, food and beverage intake for the n 1500 Irish adults was determined using a consecutive 4-d semi-weighed food diary to include at least one weekend day. All foods and beverages consumed were recorded, including detailed information regarding the amount, type and brand where possible as well as details of leftovers. Foods consumed were quantified according to a specific protocol including weighing, a photographic food atlas, manufacturer’s information and household measures( 28 ). Food packaging was also collected. All food and beverage intakes were assessed using WISP© version 3.0 (Tinuviel Software), which uses compositional information on the foods consumed, based on data from the fifth and sixth editions of McCance and Widdowson’s The Composition of Foods plus all nine supplemental volumes, to generate nutrient intakes( 28 ). The compositional database was adjusted to include recipe information and data regarding foods newly available in the market.
Dairy food intake analysis
Mean daily intakes
Mean daily dairy intakes were calculated from reported intakes of all milk, cheese, yogurt, cream and butter. To calculate the intakes, a two-step approach was taken. The first step identified all dairy foods eaten as discrete food or beverage items. In the second step, all dairy-containing recipes/composite foods were identified and were assigned an amount of dairy/100 g and dairy fat content/100 g. To fully investigate the type of dairy consumed, dairy foods were further categorised into subtypes, whereby milk was categorised into one of the following groups: whole milk, semi-skimmed milk, skimmed milk and fortified milk (milk with added micronutrients). All cheeses consumed were categorised into one the following groups: hard cheese, soft cheese, cottage cheese or processed cheese as well as separately into cheeses characterised by their fat content in DM (skimmed: 0–10 % fat, partially skimmed: 10–20 % fat, medium-fat: 20–40 % fat, full-fat: 40–60 % fat and high-fat cheeses: 60 % fat or over). Yogurt was categorised into yogurt and yogurt drinks; cream was categorised into single cream, double cream, half-fat cream, whipping cream and crème fraiche. Butter was not subcategorised. This information was used to calculate mean daily dairy intakes from all sources (g/d) both for the total population and for the consumers only. Mean daily intakes of each dairy subtype were also calculated (g/d). To put this in context with the recommended intakes, mean dairy servings per d for milk, cheese and yogurt were also calculated( 29 ).
Contribution to nutrients
Percentage contribution to nutrients was calculated by grouping each food consumed into one of the following eleven food groups – ‘rice, grains, breads and cereals’, ‘biscuits, cakes and pastries’, ‘savoury snacks and confectionery’, ‘beverages’, ‘potato and potato products’, ‘fruit and vegetables’, ‘meat, fish and their dishes’, ‘other foods’, ‘dairy’, ‘recipes/composite foods containing dairy’ and ‘other dairy’. Foods within the ‘dairy’ food group were further classified as per the ‘dairy analysis’ mentioned above. The food groupings were used to determine total nutrient intake from each food type. Using this, the contribution of dairy and cheese (i.e. cheese intakes from all discrete sources, excluding recipes) to nutrient intakes was calculated. When considering the percentage contribution to nutrient intake, only sources of nutrient intakes from foods were included (supplements were excluded).
Data analysis
Statistical analyses were carried out using SPSS version 20 for Mac (IBM). Mean daily intakes (g/d) were calculated, and intakes of dairy and cheese per 10 MJ were used to determine intake tertiles. Mean daily servings of dairy products (milk, cheese and yogurt)( 29 ) were calculated and used to determine tertiles of dairy servings. A serving was calculated as follows: 200 ml milk, fortified milk and yogurt drinks; 25 g hard cheese, 50 g soft cheese and 35 g processed cheese; 75 g cottage cheese; and 125 g yogurt. Nutrients across intake tertiles were analysed using the general linear model procedure in SPSS, adjusting for covariates where necessary; χ 2 analyses were used to examine differences in categorical variables. P<0·05 was considered to be statistically significant. Some of the dietary variables were positively skewed; therefore, dairy intakes are presented as mean intakes, medians and 97·5 percentiles (Table 1). The ‘consumers only’ figure included the intake values of those who reported an intake >0 g for the 4-d period. Reporting bias was estimated using EI:BMR calculations and applying Goldberg’s cut-off limits to identify misreporters( Reference Goldberg, Black and Jebb 30 ), which was calculated to be 28·2 % in this cohort( Reference Hennessy, Hannon and Walton 27 ). The exclusion of misreporters did not change the main findings, and therefore misreporters were not excluded from this analysis.
Table 1 Mean daily dairy intakes – total population (n 1500) and consumers only (% of population) (Mean values and standard deviations; medians and 97·5 percentiles; numbers and percentage of consumers)
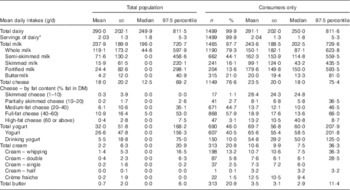
* Mean daily servings of dairy calculated for milk, cheese and yogurt as per current recommendations( 29 ); 1 serving equates to 200 ml of milk, fortified milk and yogurt drinks; 25 g hard cheese, 50 g soft cheese and 35 g processed cheese; 75 g cottage cheese; and 125 g yogurt.
Results
Dietary intake data were collected from n 1500 participants (740 males, 760 females) aged between 18 and 90 years as part of the NANS survey. The mean age was 44·5 (sd 17·0) years, and the mean BMI was 27·1 (sd 5·0) kg/m2. More detailed demographic information and mean nutrient data from the study have been published previously, and are available online( 28 ).
Dairy products consumption
In total, 99 % of the Irish population reported consuming dairy products in their diet, through discrete dairy food consumption or composite foods and recipes. The mean daily dairy intake of the total population was 290 (sd 202·0) g (Table 1). Mean daily servings of dairy products (milk, cheese and yogurt) were just over two servings per d (2·03) in the total population. This was one daily serving lower than the recommended intake( 29 ). The mean intake of total milk was 237·9 (sd 189·9) g, and the mean cheese intake was 18·0 (sd 20·2) g in the total population. Total yogurt intake was 32·0 (sd 51·8) g, and the mean total cream intake in the total population was 2·2 (sd 6·3) g. Intakes were also calculated for ‘consumers only’ of each dairy food, where mean intake of total milk among the consumers only was 243·6 (sd 188·5) g, the mean intake of cheese (consumers only) was 23·5 (sd 20·0) g, the mean intake of yogurt (consumers only) was 69·7 (sd 56·8) g and the mean intake of total cream (consumers only) was 10·6 (sd 9·9) g (see Table 1 for a detailed breakdown).
Mean daily nutrient intakes were examined across the tertiles of dairy consumption (Table 2). Non-consumers of dairy products were excluded from this analysis. The percentage contribution to energy from carbohydrate and from SFA (but not total fat) was higher in those who consumed the most dairy products (P<0·01, P<0·01, P=0·28, respectively, Table 2). The per cent energy from MUFA and PUFA was lower in those who consumed the most dairy products (P<0·01) (Table 2). The percentage contribution to energy from protein did not differ across the tertiles (P=0·2). Ca and Mg intakes/10 MJ EI were significantly higher in the high dairy tertile, whereas Na intake/10 MJ EI was significantly lower (P<0·01 for each, respectively). There was no difference in the mean age across the tertiles of dairy consumption (P=0·12). However, in addition to nutrient intake, EI was also higher in the greater tertile of intake (P<0·01), and there was a significant difference in the sex profiles across the tertiles (with more men in the higher tertiles and more women in the lower-intake group) (P<0·01). BMI (adjusted for age, sex and EI) was significantly lower in the higher tertiles of dairy intake (P=0·01) (Table 2).
Table 2 Percentage of energy from macronutrients, selected nutrient density and demographic information across tertiles of dairy intake in Ireland (Mean valuesFootnote * and standard deviations)

MD, mean daily; M:F ratio, male:female ratio; % TE, percentage of total energy; CHO, carbohydrate; SES, socio-economic status.
a,b,c Mean values within a row with unlike superscript letters were significantly different groups (using pair-wise comparisons based on estimated marginal means, adjusted for multiple comparisons).
* Unadjusted mean intake values are presented for descriptive purposes, but P values are presented for age-, energy- and sex-adjusted analyses.
† Tertiles calculated on dairy intakes/g per 10 MJ. Servings based on intakes of milk, cheese and yogurt only, as per national recommendations: 200 ml milk, fortified milk and yogurt drinks; 25 g hard cheese, 50 g soft cheese and 35 g processed cheese; 75 g cottage cheese; and 125 g yogurt.
‡ Adjusted for age, sex and energy intakes.
§ χ 2 analyses.
‖ SES groups: 1=professional/managerial/technical, 2=non-manual skilled, 3=manual skilled, 4=semi-skilled/unskilled.
¶ Figures do not add to exactly 100 due to rounding.
** Tertiles calculated using servings based on 200 ml milk, fortified milk and yogurt drinks; 25 g hard cheese, 50 g soft cheese and 35 g processed cheese; 75 g cottage cheese; and 125 g yogurt.
Cheese and nutrient intakes
To examine the impact of cheese consumption on nutrient intakes, the data were split according to non-consumers of cheese (those who reported no cheese intake over the 4-d period; n 352) and tertiles of cheese consumption (g/d) (Table 3). Individuals with the highest intakes of cheese had higher mean EI (P<0·01) and higher intakes of Ca/10 MJ (P<0·01). Na intake/10 MJ EI trended towards being greater in the higher cheese tertile, but was not significantly different (P=0·06). There was a significant difference in mean age across the tertiles of cheese consumption; those who consumed the most cheese were an average of 11 years younger compared with the group that consumed the least (P<0·01) (Table 3). There was also a significant difference in the sex profiles of the intake groups, with males more likely to be in the higher-intake group of cheese and females more likely to be in the lower-intake group (P<0·01). The proportion of those in various socio-economic classes differed across the tertiles, with more of those from the non-skilled/manual/students group falling into the higher cheese intake group compared with the lower-intake group (P=0·03). Energy-, sex- and age-adjusted values of BMI did not differ across groups of total cheese intake (Table 3).
Table 3 A comparison of percentage of energy from macronutrients, selected nutrient density and demographic information across tertiles of cheese intake, higher-fat cheese and lower-fat cheese in IrelandFootnote *

MD, mean daily; % TE, percentage of total energy; CHO, carbohydrate; M:F ratio, male:female ratio; SES, socio-economic status.
a,b,c Mean values within a row with unlike superscript letters were significantly different groups (using pair-wise comparisons based on estimated marginal means, adjusted for multiple comparisons).
* Unadjusted mean intake values are presented for descriptive purposes, but P values are presented for age-, energy- and sex-adjusted analyses.
† Tertiles calculated on dairy intakes per 10 MJ.
‡ Adjusted for age, sex and energy intakes.
§ χ 2 analyses.
‖ Figures do not add to exactly 100 due to rounding.
¶ SES groups: 1=professional/managerial/technical, 2=non-manual skilled, 3=manual skilled, 4=semi-skilled/unskilled.
Nutrient density and cheese fat content
To further examine the effect of cheese consumption on dietary quality, the population was grouped into tertiles of consumption per MJ of EI for higher-fat cheeses (full- and high-fat cheeses) (Table 3) and for lower-fat cheeses (cheeses categorised as skimmed-milk cheeses, partially skimmed-milk cheeses and medium-fat cheeses) (Table 3).
Mean total cheese intake per MJ and selected macronutrient and micronutrient intakes across the groups of higher-fat and lower-fat cheese consumption are shown. Total cheese consumption was significantly higher in the ‘high’-intake group of the higher-fat cheeses (Table 3), as was total EI, percentage of total energy from fat and from SFA and Ca intake/10 MJ EI. The percentage contribution to energy from carbohydrate was lower in the higher-intake tertile, as was Mg/10 MJ EI (Table 3). There was no difference in the percentage contribution to energy from protein, from MUFA or PUFA across the groups of high-fat cheese intakes, no difference in Na intake/10 MJ EI and no difference in age, BMI or socio-economic status. A sex effect was observed, whereby a significantly greater proportion of males:females was found in the highest-intake group (62 v. 38 %, respectively) (Table 3). When intakes of lower-fat cheeses were examined, mean daily total cheese intake per MJ was higher in the higher-intake group (Table 3). EI was also higher in the highest-intake group, as was Ca (Table 3). However, unlike the higher-fat cheeses, there was no difference in total percentage of energy from protein, carbohydrate or fat (either total fat, SFA, MUFA or PUFA); nor was there a difference in Na/10 MJ or in BMI or socio-economic status. There was an age difference, with the higher-intake group for the low-fat cheeses being slightly younger (an average of 2–4 years younger than the medium- and low-intake groups), and there was a sex difference, with more males in the higher-intake group.
Contribution of dairy foods and cheese to nutrients
The percentage contribution of total dairy foods and cheese to various nutrients is displayed in Table 4. Dairy foods contributed to over 30 % of the population intakes of Ca, retinol, vitamin B12 and riboflavin (38·8, 37·4, 34·5 and 28·9 %, respectively), and were important contributors (>10 % of population intakes) of protein (13·3 %), fat (12·8 %), SFA (19·8 %), vitamin D (10·9 %) and Zn (13·4 %). Dairy products also contributed to 9·4 % of energy and 8·7 % of Na intakes. Cheese was a significant contributor to retinol intakes (12·6 %) and also contributed to 2·3 % of EI, 9·1 % of Ca, 5 % of total fat and 8·3 % of SFA intakes. The contribution to Na intake from cheese was 3·9 %.
Table 4 Mean percentage contribution of dairy foods and cheese to nutrients in the Irish population
Discussion
The present analyses show that dairy foods contribute to a range of important micronutrients in the Irish diet, including Ca, retinol, vitamin B12, riboflavin, vitamin D and Zn. Research shows that these dairy sources of micronutrients cannot reasonably be substituted by other foods( Reference Fulgoni, Keast and Auestad 4 ). The importance of dairy products to nutrients, particularly Ca, was also noted by Trichterborn et al.( Reference Trichterborn, Harzer and Kunz 31 ) while examining nutrient profiling methods. Nutrient profiling aims to classify or rank foods based on their composition. However, methods that target SFA acids, sugars and Na may require separate criteria for cheeses and other dairy products, in order to avoid a reduction in the Ca content of the category( Reference Trichterborn, Harzer and Kunz 31 ). In this cohort, individuals in the low dairy intake tertile had an average intake of 860 mg of Ca/10 MJ, whereas those in the highest tertile had an intake of 1326 mg/10 MJ (Table 2). The estimated average requirement for Ca is given in absolute amounts – 525 mg/d( 32 ). EI vary considerably, but for an average EI of 8·5 MJ (the mean in this cohort), an intake of 525 mg daily would equate to 618 mg/10 MJ of energy. Although there was no difference in percentage of energy from protein or from total fat across the groups of dairy tertiles, those who consumed the greatest amounts of dairy products had a greater percentage of energy from SFA and from carbohydrate. High consumers of total cheese and of higher-fat cheeses (but not lower-fat cheeses) also consumed a greater percentage of energy from SFA. Current guidelines from the World Health Organization( 33 ) recommend that individuals limit their EI from SFA and replace it with unsaturated fats. On the basis of these guidelines, the present data appear to show that current recommendations to consume reduced-fat dairy foods where possible is warranted in order to increase micronutrient intakes without increasing SFA consumption. However, it should also be noted that recent evidence from various meta-analyses( Reference Harcombe, Baker and Cooper 34 – Reference Chowdhury, Warnakula and Kunutsor 36 ) suggests that these intake recommendations for SFA may not be fully supported by the literature. Different SFA from different foods do not have the same biological effect( Reference Hu, Stampfer and Manson 11 ), and dairy fatty acids may in fact have beneficial heath effects( Reference Astrup 37 ), with observational studies suggesting an inverse relationship between dairy intake and CVD incidence( Reference Soedamah-Muthu, Ding and Al-Delaimy 38 , Reference Astrup 39 ). Data on current levels of dairy food consumption and on the contribution to dietary nutrient intakes will provide valuable information when guidelines are reviewed.
High dairy consumers also had lower Na intakes/10 MJ energy and higher Mg intakes, despite the fact that dairy products as a group contributed an average of 8·7 % to dietary Na intakes. This could be due to the other foods in which dairy foods are generally consumed. Cheese on other hand contributed a total of 3·9 % of dietary Na, which was less than expected, given recent concern over the Na content of cheese( Reference Hashem, He and Jenner 17 ). These data demonstrate that, although a food may be considered a ‘significant’ contributor to a nutrient, based on nutrient profiles per 100 g, it is also important to consider both the frequency and the average portion size of the food consumed in order to fully understand the dietary contribution of a food. The intakes reported in the present study are comparable with UK intakes, which show that cheese contributes an average of 5 % to dietary Na intake( Reference Bates, Lennox and Prentice 3 ). It should be noted that these figures refer to the contribution to the total reported dietary Na from food sources and do not include ‘discretionary’ salt such as that added during cooking or at the table. The true Na intakes in this cohort, measured via urinary Na levels, were approximately 25–30 % higher than the reported dietary intakes( 40 ), meaning that the true % contribution to total Na from dairy products may be even lower than those reported here. Although cheese contributed to <4 % of dietary Na, when tertiles of cheese consumption were considered, Na intakes were greater in the high cheese tertiles – a result that approached significance. These data suggest that cheese is being consumed in conjunction with other Na-containing foods – for example, breads. Despite efforts to raise awareness of the dangers associated with excess Na intakes, over 70 % of UK adults currently exceed the recommended maximal daily Na intake( Reference Sadler, Nicholson and Steer 41 ), whereas, although Irish intakes appear to have decreased by 1 g on average over the past decade, the mean reported salt intake is still above the recommended maximum at 7·0 g( Reference Lorenzen, Nielsen and Holst 42 ). Efforts should be taken to highlight the importance of the totality of the diet to consumers and to advise that cheese should be consumed as part of a healthy, balanced diet with minimally processed foods to avoid excess Na consumption.
Some research suggests that dairy consumption may also contribute favourably to weight control( Reference Zemel, Donnelly and Smith 43 – Reference Wang, Troy and Rogers 46 ), although not all studies have observed favourable effects( Reference Berkey, Rockett and Willett 47 , Reference Barr 48 ), and a two recent meta-analyses caution that beneficial effects are generally observed under conditions of energy restriction, in short-term studies only( Reference Chen, Pan and Malik 44 , Reference Abargouei, Janghorbani and Salehi-Marzijarani 45 ). Hypothetical mechanisms for the weight management effects observed in previous studies include dairy products Ca forming insoluble soaps with fat, and thus reducing absorption, increased fat oxidation( Reference Zemel, Donnelly and Smith 43 ) and potential bioactivity from peptides contained in the whey fraction( Reference Zemel 49 ). The present findings follow the same pattern observed with these studies, as the high consumers of dairy products in this cohort had significantly lower mean BMI, after adjustment for age, sex and EI. When cheese intakes were considered, the percentage energy from fat and from SFA was higher in the high cheese consumers, but the BMI measurements not differ with cheese intake. Ca/10 MJ was significantly higher in the higher cheese intake group and consumption of dairy products Ca is thought to be one factor in the role of dairy products in weight management( Reference Lorenzen, Nielsen and Holst 42 , Reference Zemel, Donnelly and Smith 43 , Reference Abargouei, Janghorbani and Salehi-Marzijarani 45 ), although the mechanisms are not fully supported by empirical data using Ca supplementation( Reference Yanovski, Parikh and Yanoff 50 ). It is still unclear whether some dairy foods are more effective than others for weight loss. A recent 8-week intervention study observed a beneficial effect of low-fat dairy products on weight loss and on waist circumference measures, but mixed effects on other metabolic health markers( Reference El Khoury, Huot and Barkhordari 51 ). This analysis also adds to the growing body of literature on associations between dairy food intake and body weight. Further interventional studies are required to determine the optimal dairy composition for weight loss and/or maintenance effects, as well as to elucidate the underlying modes of action, if any.
The strengths of this study include the detailed dietary intake data available for the participants at a nationally representative level and the ability to determine the mean intake of dairy products from composite sources. Potential weaknesses of the study include the inability to calculate the individual nutrient contributions from dairy ingredients and the reliance on participants to maintain an accurate 4-d food diary. This latter issue is universal to dietary intake studies of this nature. Although every effort was taken to ensure compliance in recording food consumption and a semi-weighed food diary is deemed one of the best dietary intake assessment methods in free-living individuals, misreporting based on EI:BMR was evident in this cohort. However, as noted above, the exclusion of misreporters did not change the overall findings.
Conclusion
Dairy foods are widely consumed in the Irish population. Dairy products and particularly cheese are shown here to be important sources of a range of micronutrients in the Irish diet, including Ca and retinol. Dairy products and cheese contributed to SFA intake, although they were not significant contributors to Na intake. This suggests that current guidelines to consume reduced fat dairy products are warranted in order to limit the percentage EI from SFA. Information on the individual contributions should be useful in the event that current guidelines come under review. Although reports that examined the Na content of cheese/100 g, and not dietary intakes( Reference Hashem, He and Jenner 17 ), may have over-stated the contribution of cheese to dietary Na, which stands at just under 4 % in Ireland, the foods with which cheese is consumed may contribute to Na intakes. Consumers should be made aware of the benefits of choosing reduced-salt and reduced-fat dairy foods. The potential role of dairy products in weight management warrants further investigation.
Acknowledgements
The authors thank Niamh Devlin and Aoife Murphy, who conducted some of the recordings in the pre-analysis. This work builds on previous reports conducted for the National Dairy Council on milk, cheese and yogurt consumption in Ireland.
This work was supported by Food for Health Ireland (EI grant no. TC-2013-001). The funding body had no role in the decision to publish. E. L. F. is supported by Food for Health Ireland, a research organisation that receives funding from Enterprise Ireland and from the members of the Irish dairy industry.
E. L. F. analysed the data. E. L. F. and E. R. G. wrote the article. E. L. F., E. R. G. and A. P. N. formulated the research questions for this analysis. E. R. G. and A. P. N. contributed to the initial study design. J. W. and B. M. N. were project coordinators of the NANS study. A. F., A. P. N. and E. R. G. were principal investigators on the NANS study. All the authors read and approved the completed article.
The authors declare no conflict of interest.
Supplementary Material
For supplementary material/s referred to in this article, please visit http://dx.doi.org/doi:10.1017/S000711451500495X


