


Because of its strong associations, in individuals and in society, with physical and mental health as well as economic development, WB has become a topic of interest across different scientific disciplines (Seaford, Reference Seaford2011; Steptoe et al., Reference Steptoe, Deaton and Stone2014; Stiglitz et al., Reference Stiglitz, Sen and Fitoussi2009). In general, WB is conceptualized to include a continuous spectrum of positive feelings and subjective life assessment that can be assessed with a series of measures, such as SAT, happiness (HAP), and quality of life (QoL).
Twin-family studies report that in the general population, a substantial part of the variation in the different measures of WB is explained by genetic differences between individuals (Stubbe et al., Reference Stubbe, Posthuma, Boomsma and Geus2005). A large meta-analysis (Bartels, Reference Bartels2015) showed that the weighted average heritability for WB was 36% (95% CI: 34–38, and for SAT 32% (95% CI: 29–35). A multivariate twin-sibling study exploring the etiology of the covariance among multiple WB indices revealed that the genetic variance in the different measures was explained by one underlying set of genes (Bartels & Boomsma, Reference Bartels and Boomsma2009). These results also emphasize the importance of environmental factors in the variation of WB, and a dynamic interplay between genes and environment is to be expected for a complex trait like WB.
Epigenetic regulation of gene expression by mechanisms such as DNA methylation may mediate the interplay between the genetic make-up of individuals and their exposure to the environment (Bernstein et al., Reference Bernstein, Meissner and Lander2007; Rakyan et al., Reference Rakyan, Down, Balding and Beck2011; Reik, Reference Reik2007). Methylation changes can be caused by external conditions, such as long-term stress exposure (Klengel et al., Reference Klengel, Pape and Binder2014; Romens et al., Reference Romens, McDonald, Svaren and Pollak2015), (prenatal, maternal) smoking exposure (Allione et al., Reference Allione, Marcon, Fiorito and Guarrera2015; Lee et al., Reference Lee, Richmond, Hu, French, Shin, Bourdon and Reischl2015) and dietary modifications at conception (Dominguez-salas et al., Reference Dominguez-salas, Moore, Baker, Bergen, Cox, Dyer and Hennig2014). There are no epigenetic studies of the association between DNA methylation and WB, but some epigenetic studies have been performed involving complex traits related to WB. From twin studies, it is known that there is a negative association between psychopathology and WB, with the strongest association between WB and anxiety/depression (Bartels et al., Reference Bartels, Cacioppo, van Beijsterveldt and Boomsma2013). Epigenetic differences in candidate genes related to major depressive disorder (MDD) have been reported in multiple studies (Dalton et al., Reference Dalton, Kolshus and McLoughlin2014; Oh et al., Reference Oh, Wang, Pal, Chen, Khare, Tochigi and Petronis2015). Additionally, a DNA methylation EWAS of monozygotic twins discordant for adolescent depression (Dempster et al., Reference Dempster, Wong, Lester, Burrage, Gregory, Mill and Eley2014) found two reproducible differentially-methylated probes (DMPs) that were located within STK32C, which encodes a serine/threonine kinase of unknown function.
Here, we describe the first EWAS for WB performed in a population-based sample from the NTR. Our aim was to identify genomic locations where differences in DNA methylation in blood level are associated with differences in WB.
Methods
Subjects and Samples
The subjects in this EWAS participated in longitudinal survey studies conducted by the NTR (Van Beijsterveldt et al., Reference Van Beijsterveldt, Groen-Blokhuis, Hottenga, Franić, Hudziak, Lamb and Boomsma2013; Willemsen et al., Reference Willemsen, Vink, Abdellaoui, den Braber, van Beek, Draisma and Boomsma2013) and in the NTR biobank project (Willemsen et al., Reference Willemsen, de Geus, Bartels, van Beijsterveldt, Brooks, Estourgie-van Burk and Boomsma2010). Peripheral blood samples were drawn from the NTR participants in the morning after an overnight fast, and for biomarkers studies and for DNA and RNA isolation (see Willemsen et al. (Reference Willemsen, Vink, Abdellaoui, den Braber, van Beek, Draisma and Boomsma2013). In 3,264 peripheral blood samples from 3,221 participants, genome-wide methylation probes were assessed. After quality control (QC) of the methylation data, 3,089 samples from 3,057 participants were retained (for a detailed description of the QC procedures, see van Dongen, 2015, this issue). For the present study, we included participants if the following information was available: SAT score, and good quality methylation data and data on white blood cell counts, leaving 2,519 samples from 2,456 subjects for the final analyses. The dataset included 606 complete MZ and 291 complete DZ pairs, 102 fathers of twins, 112 mothers of twins, 15 siblings, and 2 spouses of twins.
All subjects provided written informed consent and study protocols were approved by the Central Ethics Committee on Research, involving Human Subjects of the VU University Medical Centre, Amsterdam, an Institutional Review Board certified by the US Office of Human Research Protections (IRB-2991 under Federal wide Assurance-3703: IRB/institute codes, NTR 03-180).
Wellbeing
WB was assessed by a short inventory that measures SAT (Diener et al., Reference Diener, Emmons, Larsen and Griffin1985). Data on SAT were collected in multiple NTR surveys. For the current study, data from surveys 6 (2002), 8 (2009), and 10 (2013) were analyzed. The SAT scale consists of five items that have to be answered on a 7-point scale ranging from 1 = strongly disagree to 7 = strongly agree. A typical question included in this questionnaire is ‘If I could live my life over, I would change almost nothing’ (for all items, see Table 1). Internal consistency of the scale was good with a Chronbach's alpha of 0.86 and test–retest scores in the range of 0.24 (over 16 years), to 0.54 (over 4 years) to 0.84 for a period of 2 weeks to 1 month (Fujita & Diener, Reference Fujita and Diener2005). Within this NTR sample, the test–retest scores were 0.53 between surveys 6 and 8 (7-year interval), 0.48 between surveys 6 and 10 (11-year interval), and 0.63 between surveys 8 and 10 (4-year interval), and the phenotypic correlation of SAT with an overall WB factor score was 0.97. For individuals who completed surveys 6, 8, and 10, the WB score closest to the moment of blood draw was selected.
TABLE 1 Satisfaction with Life Scale (Diener et al., Reference Diener, Emmons, Larsen and Griffin1985)

Infinium HumanMethylation450 BeadChip Data
DNA methylation was assessed with the Infinium HumanMethylation450 BeadChip Kit (Illumina, Inc.) (Bibikova et al., Reference Bibikova, Barnes, Tsan, Ho, Klotzle, Le and Shen2011). 500ng of genomic DNA from whole blood was treated by bisulfite using the Zymo Research EZ DNA Methylation kit (Zymo Research Corp, Irvine, CA, USA) following the standard protocol for Illumina 450K micro-arrays, by the department of Molecular Epidemiology from the Leiden University Medical Center (LUMC), the Netherlands. Subsequent steps (i.e., sample hybridization, staining, scanning) were performed by the Erasmus Medical Center micro-array facility, Rotterdam, the Netherlands. QC and processing of the blood methylation dataset has been described in detail previously (Van Dongen et al., Reference Van Dongen, Nivard, Baselmans, Zilhão, Ligthart and Boomsma2015). A number of sample-level and probe-level quality checks were performed. Sample-level QC was performed using MethylAid (van Iterson et al., Reference Van Iterson, Tobi, Slieker, den Hollander, Luijk, Slagboom and Heijmans2014). Probes were set to missing in a sample if they had an intensity value of exactly zero, or a detection p value > .01, or a bead count < 3. After these steps, probes that failed based on the above criteria in >5% of the samples were excluded from all samples (only probes with a success rate ≥0.95 were retained). Probes were also excluded from all samples if they mapped to multiple locations in the genome (Chen et al., Reference Chen, Lemire, Choufani, Butcher, Grafodatskaya, Zanke and Weksberg2013), or if they had a SNP within the CpG site (at the C or G position) irrespective of minor allele frequency in the Dutch population (Genome of the Netherlands Consortium, 2014). Only autosomal methylation sites were analyzed in the EWAS. The methylation data were normalized with functional normalization (Fortin, Reference Fortin2014), and normalized intensity values were converted into beta (β) values. The β value represents the methylation level at a site, ranging from 0 to 1, and is calculated as:
 $$\begin{equation*}
{\rm \beta} = \frac{M}{{M + U + 100}}
\end{equation*}$$
$$\begin{equation*}
{\rm \beta} = \frac{M}{{M + U + 100}}
\end{equation*}$$
where M = Methylated signal, U = Unmethylated signal, and 100 represents a correction term to control the β value of probes with very low overall signal intensity. After QC and normalization, principal component analysis was conducted on genome-wide methylation sites.
Covariates
White blood cell percentages were included as covariates in the EWAS to account for variation in cellular composition between whole blood samples. The following subtypes of white blood cells were counted in blood cells: neutrophils, lymphocytes, monocytes, eosinophils, and basophils (Willemsen et al., Reference Willemsen, Vink, Abdellaoui, den Braber, van Beek, Draisma and Boomsma2013). Because of its strong correlation with neutrophil counts (r = −0.93), lymphocyte counts were not included in the model, while basophil counts were not included because they showed little variation between subjects (many subjects having 0% of basophils in their blood). Inspection of the PCs that were computed on the genome-wide methylation data indicated that PC1 reflected, as expected, sex (r = 0.99), PC 2 showed a strong correlation with lymphocyte percentage (r = −0.8) and neutrophil percentage (r = 0.79). Additionally, PC3 showed a modest correlation with age (r = −0.41) and a weak correlation with white blood cell percentages (absolute r ~0.1). However, it is possible that this PC is reflective of unmeasured white blood cell subtypes and was therefore included in the model. Because of their correlation with several lab procedures, such as sample plate and order of processing, PC4 and PC5 were included to account for technical variability (for a graphical representation of the included PCs, see Supplemental Figure S1).
Epigenome-Wide Association Analysis
Using generalized estimation equation (GEE) models, we tested whether DNA methylation was associated with WB for each methylation site, with DNA methylation β value as outcome variable and the following predictors: WB score, sex, age at blood sampling, age squared, monocyte percentage, eosinophil percentage, neutrophil percentage, HM450k array row, and principal components (PCs) 3, 4, and 5 from the methylation data. Age squared was included as a covariate as several studies suggest a U-shaped relationship between WB and age, with the lowest point approximately in midlife (Blanchflower & Oswald, Reference Blanchflower and Oswald2008; Layard, Reference Layard2010). GEE models were fitted with the R package gee, with the following specifications: Gaussian link function (for continuous data), 100 iterations, and the ‘exchangeable’ option to account for the correlation structure within families and within persons.
FDR q value was computed with the R package q value with default settings. The genomic inflation factor (λ) was calculated with the default regression method from the R package GenABEL. In all analyses, an FDR q value <0.05 was considered statistically significant (Benjamini & Hochberg, Reference Benjamini and Hochberg1995). Additionally, a more stringent Bonferonni correction was applied by dividing 0.05 by the number of observations (N = 411,169). Follow-up analyses, including a test for enrichment of genomic locations and gene ontologies, were performed based on the output from the EWAS.
Genomic Annotation
As described in detail by Slieker et al. (Reference Slieker, Bos, Goeman, Bovée, Talens, van der Breggen and Heijmans2013), methylation sites were mapped to genomic features and DNase I hypersensitive sites (DHS). These genomic features consists of five gene-centric regions: (1) intergenic regions (>10 kb to -1.5 kb from the nearest transcription start site [TSS]), (2) proximal promotor (−1.5 kb to +500 kb form the nearest TSS), (3) distal promotor (−10 kb to −1.5 kb from the nearest TSS), (4) gene body (+500bp to 3′ end of the gene) and (5) downstream region (3′end to +5 kb from 3′end). Additionally, CpG were mapped to CG island (CGIs; CG content > 50%, length > 200bp, and observed/expected ratio of CpGs > 0.6), CGI shore (2 kb region flanking CGI), CGI shelf (2 kb region flanking CGI shore), or non-CGI regions. Locates were obtained from the UCSC genome browser (Kent et al., Reference Kent, Sugnet, Furey, Roskin, Pringle, Zahler and Haussler2002). DHS locations, mapped by the ENCODE project (The ENCODE Project Consortium, 2012) were also downloaded from the UCSC genome browser (Kent et al., Reference Kent, Sugnet, Furey, Roskin, Pringle, Zahler and Haussler2002).
Enrichment of Genomic Locations
To test whether specific genomic locations showed a stronger association between DNA methylation and WB, eight categories were tested for being enriched using the EWAS test statistics for all genome-wide methylation sites The locations tested were: (1) gene body, (2) proximal promoter, (3) distal promoter, (4) downstream region, (5) CGI, (6) CGI shore, (7) CGI shelf, and (8) DHS. To account for differences in variability between methylation sites we also included the mean and standard deviation of DNA methylation level in the model as covariates. For a detailed description of the method used for this analysis, see also Van Dongen et al. (Reference Van Dongen, Nivard, Baselmans, Zilhão, Ligthart and Boomsma2015), published in this issue.
Enrichment of the Gene Ontology Terms
Methylation sites with a stronger association with WB were tested for enrichment of GO terms. To do so, all methylation sites that were tested were ranked by EWAS p value and the resulting ranked gene list was supplied to the online software tool GOrilla (Eden et al., Reference Eden, Navon, Steinfeld, Lipson and Yakhini2009). GOrilla performs GO enrichment analyses based on gene rank, and therefore no p value cut-off for defining the input list of genes is required. The background in this analysis consisted of all genes for which methylation sites were analyzed in the EWAS. In all analyses, we accounted for multiple testing by controlling the false discovery rate (FDR). An FDR q value < 0.05 was considered statistically significant.
Results
Characteristics of the Study Sample
Data on WB were available for 1,747 individuals who filled out survey 6, 2,056 individuals who filled out survey 8, and 1,059 individuals who filled out survey 10. The EWAS was performed on 2,519 blood samples from 2,456 subjects (mean age at blood sampling = 36.8 years, SD = 13% male = 31.1), for which the WB score closest to the moment of blood draw was selected: For 1,799 samples, WB was assessed after blood draw (mean 3.1 years), and for 720 samples, WB was assessed before blood drawn (mean 2.5 years). Table 2 summarizes the characteristics of the WB data and EWAS study sample. The average WB score of the EWAS study sample was comparable to the averages of the different survey waves (mean EWAS study = 27.0, mean survey 6 = 26.8, mean survey 8 = 27.5, mean survey 10 = 27.0), and was also comparable to the mean of the overall NTR survey database SAT score (26.9, n = 38,740). (For a distribution of the WB data, see Supplementary Figure S1).
TABLE 2 Characteristics of the Wellbeing Data
aIncludes individuals with 450k methylation data and data on white blood cell counts.
EWAS
After QC, we tested 411,169 autosomal sites in the genome for their association between DNA methylation and WB score, while correcting for white blood cells counts, age at blood sampling, age squared, sex, array row and three PCs from the methylation data. Figure 1 shows the Quantile–Quantile (QQ) plot. The genomic inflation factor (λ) was 1.227.
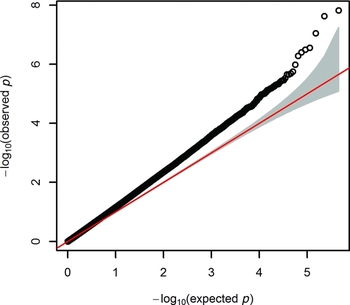
FIGURE 1 Quantile–quantile (QQ) plot from the EWAS of wellbeing.
Two of the methylation sites reached the genome wide significant threshold of p = 1.22 * 10−7 when Bonferroni corrected and six of the methylation sites reached genome significance when using a threshold of FDR q value < 0.05 (p = 5.23 * 10−7; Figure 2). The highest ranking methylation site was cg10845147 (UCSC Genome Browser hg19 assembly; p = 1.51 * 10−8), located on chromosome 5: 172149624, which was negatively associated with WB (Figure 3a). The nearest gene associated with this site is the DKFZP761M1511 gene (synonym is NEURL1B). This gene spans 50,274 bps of chromosome 5 and ranges from 172641266 to 172691540. The other site reaching Bonferroni genome-wide significance is cg01940273 (p = 2.34 * 10−8), located on chromosome 2:233284934, which showed a positive relationship between DNA methylation and WB (Figure 3b). The gene closest located to this site is the ALPPL2 gene, which ranges from chromosome 2:232406843 to 2: 232410714 (3871 bps) (Supplementary Figure S2). The four additional CpG sites that were genome-wide significant using FDR q value < 0.05 are cg03329539 (p = 2.76* 10−7, chromosome 2), cg09716613 (p = 3.23 * 10−7, chromosome 13), cg04387347 (p = 3.95 * 10−7, chromosome 16), and cg02290168 (p = 5.23 * 10−7, chromosome 1). The significant CpG sites located on chromosomes 1 and 2 were positively associated with WB, whereas the CpG sites located on chromosomes 13 and 16 were negative associated with WB. Characteristics of genome-wide significant methylation sites as well as the location of the nearest genes are provided in Table 3.
TABLE 3 Top-Ranking CpG Sites From the EWAS of Wellbeing
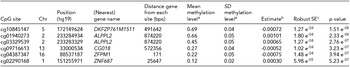
Top hits from the EWAS for the association between methylation and wellbeing. aMean and standard deviation of the methylation proportion (β-value) in the entire 450K cohort. bEstimate from the regression of methylation proportion on wellbeing score. cRobust standard error of the estimate (accounting for the clustering of observations within families).
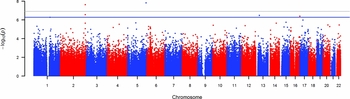
FIGURE 2 Manhattan plot showing the p values for the association between wellbeing and DNA methylation level at genome-wide autosomal sites.
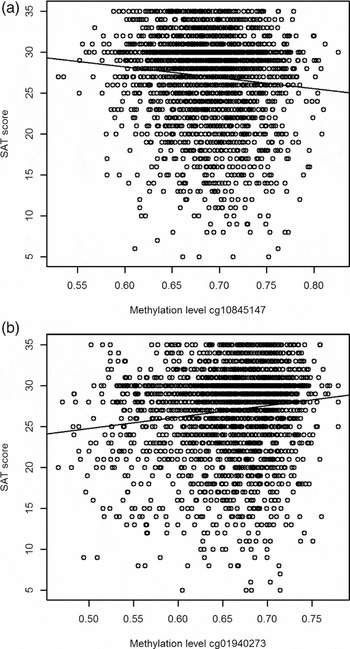
FIGURE 3 Scatterplots for the two top CpGs based on the entire NTR study sample. (a) The relationship between WB and methylation level of CpG site cg10845147. (b) The relationship between WB and methylation level of CpG site cg01940273.
Next, we looked at the association with WB for all CpGs in relatively close proximity (within 10 kb) of each significant CpG site (for an overview of all CpG sites located within this window and their p value and regression coefficient, see Supplementary Table S1). For the highest ranked CpG site (cg10845147, chromosome 5), CpG site cg07853407 was located closest at 2563 bp. This side showed no association with WB (p = 8.17 * 10−1, β-1.22 * 10−5). The two genome-wide significant CpG sites on chromosome 2 were located within 1,606 bp from each other. Within this window, five additional probes were measured. All of these probes showed a change in methylation in the same direction of association with WB (see Supplementary Table S1). On chromosome 13, CpG site cg12054869 was located closest to the significant CpG site (cg09716613) at 716 bp, while for chromosome 16, the CpG site located most closely to the leading CpG site cg04387347 was located 73 bp away. Finally, the CpG site located closest to the leading CpG site at chromosome 1 was cg01062937, 668 bp away. For each of these probes, the regression coefficient for WB indicated a similar direction of effect as the significant probe in that specific region.
Enrichment of Genomic Locations
Table 4 shows the results of the regression of the EWAS test statistics on annotation categories across all genome-wide sites. Enrichment of signal was seen in the gene body (p = 1.34 * 10−5), proximal promoters (p = 6.01 * 10−18), CGI shores (p = 9.26 * 10−10), and DHS (p = 3.68 * 10−14). CpG sites with a lower mean methylation level, showed, on average, a stronger association with WB (p = 9.13 * 10−15). To account for the fact that the errors in this regression are not normally distributed, jackknife standard errors were computed, but this analysis led to the same conclusions as the normal linear regression standard errors (see Supplementary Table S2). These findings indicate that methylation sites associated with WB are enriched in gene bodies promoter areas and other regions of regulatory active DNA.
TABLE 4 Results From the Regression of EWAS Test Statistics on Genomic Annotation Categories
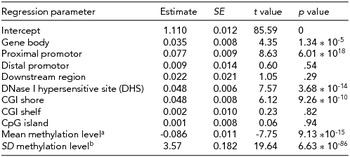
aMean methylation level of the site. bStandard deviation of the methylation level. Results based on jackknife are presented in Supplementary Table 2.
Gene Ontology Analysis
GO enrichment analysis based on EWAS p value rank identified a large number of GO terms that were significantly enriched among higher ranked methylation sites. The strongest enriched GO term were positive regulation of biological processes (GO:0048518, p = 5.38 * 10−21), positive regulation of cellular processes (GO:0048522, p = 1.34 * 10−16) and developmental processes (GO:0032502, p = 2.38 * 10−16). Also, many brain and central nervous system processes, such as regulation of neurogenesis (GO:0050767, p = 3.72 * 10−12), neuron projector guidance (GO:0097485, p = 5.77 * 10−10), neurotrophic signaling pathway (GO:0038179, p = 2.53 * 10−8), as well as regulation of neuron differentiation (GO:0045664, p = 1.81 * 10−8), were significantly enriched among higher ranking methylation sites (see Supplementary Table S3 for a complete list of significant GO terms).
Discussion
By performing an epigenome-wide methylation analysis, the aim of the present study was to identify genomic locations at which differences in DNA methylation level are associated with differences in WB in a population-based sample of adults. Six genome-wide significant hits were identified after correction for multiple testing (FDR q value < 0.05), while two hits remained significant after applying the stricter Bonferonni correction. Annotation analysis showed that enrichment of signal was seen in the gene body, proximal promoters, CpG shores and DHS. GO analysis, which tests categories of genes instead of single methylation sites, revealed that genes involved in regulation of cellular processes and central nervous system processes were enriched among higher-ranking genes from our EWAS. Here, we describe the six CpGs that were genome-wide significant using an FDR q value < 0.05. The gene located closest (at ~500 kb distance) to our top-ranked CpG site cg10845147 (genomic location: chr5:172149624) is DKFZP761M1511 (synonym is NEURL1B). NEURL1B (Neuralized E3 Ubiquitin Protein Ligase 1B) is a ligase that is involved in the regulation of the Notch pathway by influencing the stability and activity of several Notch ligands. Notch pathways acts as a regulator of cell survival and cell proliferation (Artavanis-tsakonas et al., Reference Artavanis-tsakonas, Rand and Lake1999; Miele & Osborne, Reference Miele and Osborne1999) and are suggested to play a role in human mammary development (Dontu et al., Reference Dontu, Jackson, McNicholas, Kawamura, Abdallah and Wicha2004). ENCODE data on transcription factor binding sites (TFBS) and DHS were accessed through the UCSC genome browser and showed that our top CpG, cg10845147, does not overlap with a TFBS but is located within a DHS peak in several cell types, suggesting that it is located within a regulatory region (ENCODE TFBS ChIP-seq data Mar 2012 Freeze).
The second- and third-ranked CpG sites (cg01940273, location: chr2:233,284,934 and cg03329539, location: chr:233283329) are approximately 875 kb located from the nearest gene called alkaline phosphatase, placental-like 2 (ALLPL2). Alkaline phosphatases (ALPs) are responsible for the dephosphorylation of various molecules, including proteins, nucleotides or alkaloids. Circulating ALP concentration is associated with premature birth (Meyer et al., Reference Meyer, Thompson, Addy, Garrison and Best1995), and low birth weight (Brock & Barron, Reference Brock and Barron1988). ALLP2 enzyme levels are increased up to 10-fold in 80% of cigarette smokers (Koshida et al., Reference Koshida, Stigbrand, Hisazumi and Wahren1990) and elevated in patients with a number of cancers (Koshida et al., Reference Koshida, Uchibayashi, Yamamoto and Hirano1996). Both CpGs found in our study have been associated with smoking in several studies (Kleinschmidt et al., Reference Kleinschmidt, Klopp, Zeilinger, Ku, Gieger, Weidinger and Illig2013; Philibert et al., Reference Philibert, Hollenbeck, Andersen, Osborn, Gerrard, Gibbons and Wang2015; Tsaprouni et al., Reference Tsaprouni, Yang, Bell, Dick, Kanoni, Nisbet and Deloukas2014). In those studies, it was shown that methylation at multiple CpGs, including our two CpGs, was decreased among heavy smokers, but slowly increased among former smokers. Because of their association with smoking, we tested whether adding smoking as a covariate would alter the significance level of the two CpGs. For both sites, the p values did not reach the genome-wide significance threshold when adjusting for smoking (cg01940273, p = 1.21 * 10−5 and cg03329539, p = 7.89 * 10−5). Although no longer significant, the association with WB was reduced rather than fully attenuated when correcting for smoking. The regression coefficient remained in the same direction as before, suggesting a positive relationship between WB and an increase in methylation. A growing field of research has been focusing on the effects of smoking cessation on WB. The general findings of these studies are all pointing in the same direction: smoking cessation improves WB. For instance, a study by Wilson et al. (Reference Wilson, Parsons and Wakefield1999) found that light, moderate, and heavy smokers scored significantly lower than never-smokers as well as ex-smokers on the health-related quality-of-life scale (HR-QoL), with the strongest difference between heavy smokers and never-smokers. A similar finding was found by Piper et al. (Reference Piper, Kenford, Fiore and Baker2012) and Shahab & West (Reference Shahab and West2012), who found that successful quitters reported improved subjective WB, in contrast to continuing smokers, after one to three years. Finally, the genes located nearby the other significant CpG sites, were CGO18/N4BP2L1 (chromosome 13), ZFPM1 (chromosome 16), and ZNF687 (chromosome 1) and have not been previously linked to WB or related phenotypes.
Additionally, we looked up the top three probes associated with depression as reported by Dempster et al. (Reference Dempster, Wong, Lester, Burrage, Gregory, Mill and Eley2014), and the genes located most closely to these probes (DPYSL4, STK32C, KIF13B, DUSP4, PQLC3, and KCNF1) to investigate whether these genes are also associated with WB. The six genes were located in close proximity to 341 probes in our dataset, but none of these probes reach genome-wide significance, with p values ranging from p = .001 to p = .99. Also, alterations in DNA methylation of the BDNF pathway have been associated with depression (Dalton et al., Reference Dalton, Kolshus and McLoughlin2014). However, the 80 probes lying in close proximity in our dataset did not show an association with WB with p values ranging from .003 to .99 (for a complete overview see Supplementary Table S4).
A limitation of this study is that we did not have access to a validation data set. Therefore, future studies are warranted, especially for follow-up of the CpG sites that reached genome-wide significance. Additionally, we limited this study to WB and did not consider other aspects of behavior such as different personality traits or psychiatric symptoms. Since WB is strongly associated with a wide range of mental health diseases like depression or neuroticism, DNA methylation levels associated with WB as measured in this study may be informative for associated phenotypes. The ideal EWAS approach would therefore encompass WB and related phenotypes (e.g., different aspects of personality and depression). Such an approach would give insight into which methylation sites are common for WB and its related phenotypes and which sites are specific for WB.
In conclusion, this study provides the first genome-wide methylation association study of WB. We found six genome-wide significant DNA methylation sites of which two remained significant after the more stringent Bonferonni correction. Once genetic variants have been identified for WB, future studies that integrate both genetic and epigenetic information are warranted to investigate the intriguing interplay between genetic and environmental mechanisms in a complex trait like WB.
Acknowledgments
This study was supported by the BBRMI-NL -financed BIOS Consortium (NWO 184.021.007), the European Research Council: ERC-230374: Genetics of Mental Illness, and ERC-284167: Beyond the genetics of Addiction, and the Netherlands Organization for Scientific Research [NWO 904-61-193: Resolving cause and effect in the association between regular exercise and psychological wellbeing and ZONMW 31160008: Genetic determinants of risk behavior in relation to alcohol use and alcohol use disorder]. MN is supported by Royal Netherlands Academy of Science Professor Award (PAH/6635) to DIB. M. Bartels is and was financially supported by a senior fellowship of the (EMGO+) Institute for Health and Care and a VU University Research Chair position.
Supplementary Material
To view supplementary material for this article, please visit http://dx.doi.org/10.1017/thg.2015.85


