


As with most developing and middle-income countries, Mexico is currently going through rapid demographic and epidemiological transitions with diverse impacts on its social arrangements, the provision of healthcare services and informal care, among other areas. In the first half of the twentieth century, the main causes of death were the result of communicable diseases such as respiratory and digestive tract infections( Reference Kuri-Morales 1 ). However, the incidence and prevalence of chronic non-communicable diseases as well as deaths due to violence and accidents have increased significantly( Reference Kuri-Morales 1 ). In parallel processes, a marked increase in life expectancy at birth from 36 to 75 years in the period from 1930 to 2012, a marked decrease in women’s fertility from 7·0 children on average in 1960 to 2·2 in 2013 and constant internal and international migration that gradually transformed Mexico from a predominantly rural (57·4 % in 1950) to a predominantly urban population (76·8 % in 2010) have taken place( Reference Partida Bush 2 – 5 ). By the year 2010, the 60 years and older age group had become the fastest-growing segment of the population, with a yearly growth rate of 3·4 %( Reference Hernández López, López Vega and Velarde Villalobos 3 ).
Although the ageing process is a global occurrence, this age group is heterogeneous. Rates of ageing from person to person and from one physiological system to another within the same person can be different, and two individuals of the same age can have completely different health and ageing profiles. This worldwide and within-nation variation in older adult populations reflects lifestyle differences over the life span, environmental influences that affect genetic potential and differences in health status( Reference Kuczmarski, Kuczmarski and Najjar 6 ). As a result, large geographic, sociocultural and ethnic variations in anthropometric and nutritional characteristics such as height, weight and BMI are common( 7 – Reference Perissinotto, Pisent and Sergi 9 ). Consequently, health standards including anthropometric reference values derived from adult populations may not be applicable to the elderly due to body composition changes occurring during ageing( Reference Perissinotto, Pisent and Sergi 9 , Reference Rosnah, Mohd Rizal and Sharifah-Norazizan 10 ), just as standards from older adults in one country may not be applicable to older adults in other countries. Thus, data should be obtained by country and within countries, from different age and ethnic groups and for men and women separately.
As shown in several studies, anthropometry can be an essential tool for clinical evaluation in geriatric nutritional assessment, as it can be used to evaluate underweight and obesity conditions, as they are important risk factors for severe diseases and disability among the elderly( Reference Perissinotto, Pisent and Sergi 9 , Reference Milanovic, Pantelic and Nebojsa 11 ). As nutritional disorders are very frequent in old people and involve a high risk of morbidity and mortality( Reference Ravaglia, Morini and Forti 12 , Reference Kuczmarski 13 ), in clinical practice and epidemiological surveys, anthropometric measurements represent an important component of comprehensive assessments in the elderly( Reference Perissinotto, Pisent and Sergi 9 ). Given the increase in total number and proportional increase of people reaching older ages, the need for accurate body composition information for this population group becomes equally important( Reference Kuczmarski 13 ).
The WHO’s Expert Committee recommends that, given the wide variability in the elderly, validation data should be presented in at least 10-year age groups and by sex, and must report means, standard deviations and percentiles for each anthropometric index and age group ideally including data for those 80 years and older( 7 , Reference de Onís and Habicht 8 , 14 ). Although WHO’s Expert Committee recommends that population-based anthropometric studies ideally should include individuals free from major disabilities and those living in a healthy environment, they recognise the unlikeliness of achieving this, given the fact that most elderly people probably have one or more diseases( 7 , Reference de Onís and Habicht 8 , 14 ).
In order to adequately evaluate the nutritional status of older adults, non-pathological factors affecting the distribution of anthropometric characteristics, such as sex- and age-specific data, geographical area, among others, should be taken into account. Such data may be derived as references or as standards. References are data that present cross-sectional descriptions of a well-defined population. Typically, such data are presented as observed range values for distributions of selected variables according to characteristics such as age and sex categories( Reference Kuczmarski, Kuczmarski and Najjar 6 – Reference de Onís and Habicht 8 ). Standards, on the other hand, describe desirable values to be attained for selected variables. In a clinical sense, standards may be thought of as target values to be achieved. Standards are usually arrived at through studies of values for variables that are associated with optimal health and minimal morbidity or mortality outcomes( Reference Kuczmarski, Kuczmarski and Najjar 6 – Reference de Onís and Habicht 8 ).
Despite recognition of the need for age- and sex-specific anthropometric reference values for nutritional status assessment of older adults, existing reference data, especially for the oldest old are still limited( Reference Velásquez-Alva, Irigoyen and Zepeda 15 , Reference Sánchez-García, García-Peña and Duque-López 16 ). In the case of Mexico, data from the National Health and Nutrition Survey 2006 (Encuesta Nacional de Salud y Nutrición, ENSANUT 2006) showed an overall prevalence of obesity of 20·2 % in men and 35·5 % in women who were 60 years and older( Reference Shamah-Levy, Cuevas-Nasu and Mundo-Rosas 17 ). Two studies using small samples of elderly Mexico City residents of median socio-economic status showed high prevalence of overweight( Reference Velásquez-Alva, Irigoyen and Zepeda 15 , Reference Arango-Lopera, Arroyo and Gutiérrez-Robledo 18 ); however, they included very small numbers of the oldest old and were only representative of the locality the studies were conducted in. A similar situation exists in other developing countries where few normative data exist, and only more recently studies and national surveys worldwide have started including specific data on representative samples of individuals aged 60 years and above( Reference Barbosa, Souza and Lebrao 19 , Reference Santos, Albala and Lera 20 ).
The aim of the present study was to provide reference data on anthropometric measures and body composition of Mexican older adults based on a large cross-sectional (representative) sample of Mexican adults aged 60 years and older living in the community (non-institutionalised). Specifically, we aimed to report distribution values for anthropometric measures, by evaluating height, weight, waist circumference (WC), hip circumference (HC) and calf circumference (CC), by computing prevalence of underweight, overweight and obesity, as well as by determining the waist:hip ratio (WHR). In addition, we also aimed to describe age and sex differences of anthropometric characteristics in the sample.
Methods
Sample
Data were obtained from the National Health and Nutrition Survey 2012 (Encuesta Nacional de Salud y Nutrición, ENSANUT 2012), which is part of the Mexican National System of Health Surveys. Details of the sampling structure design and methodology for the survey have been previously described( Reference Romero-Martínez, Shamah-Levy and Franco-Núñez 21 ). In brief, this is a cross-sectional probabilistic population-based survey with a multi-stage and stratified sampling structure. Data were weighted to allow for survey design and differences in non-response by age, sex, region and educational level. Recognising the challenges of a rapid ageing transition, ENSANUT 2012 extended its study objects in order to include a specific module on characteristics and relevant conditions of adults 60 years and older, including in its sampling structure design and methodology a representative sample of the total population in this age group. For each selected individual in the household, the protocol consisted of face-to-face interviews by a health group followed by a second visit by a nutrition group. ENSANUT 2012 gathered complete information from 50 528 households where 96 031 face-to-face interviews selected by age were obtained. Of the total interviews, 8883 were applied to adults 60 years and older, representing 10 162 705 older adults when taking into account the survey design( Reference Romero-Martínez, Shamah-Levy and Franco-Núñez 21 ). All operative procedures for ENSANUT 2012 were reviewed and approved by the Ethics, Biosecurity and Research Commissions at the National Institute of Public Health. For each instrument and population age group, an informed consent document was obtained. All data sets and documentation are made public as required by public funding norms.
Anthropometric measures
Regarding adults aged 60 years and older, the measures included in the survey were weight, height, sitting height using knee height and body circumferences including calf, waist and hip. Determination of measures was in accordance with protocols established for previous nutrition projects( Reference Shamah-Levy, Villalpando-Hernández and Rivera-Dommarco 22 ).
Weight was measured using SECA brand portable solar scales with a precision of ±0·2 kg. Determination of height in adults was carried out using an SECA brand stadiometer, which is made up of a 2-m-long flexible metal metric tape and a mobile angle measuring ruler with a 90° angle. Subjects were measured without shoes, wearing light clothing and standing on a flat surface. The observed data to the closest decimal centimetre (0·1 cm) were registered. Knee–heel height was determined using a non-extensible glass fibre measuring tape, according to the technique established by Chumlea et al.( Reference Chumlea, Roche and Steinbaugh 23 ).
Body circumferences
A glass fibre metric tape with 200 cm maximum length and a precision of 1 mm was used for all measurements. CC was measured at the maximum height of the calf or the midpoint between the knee and the base of the heel. WC was measured at the narrowest part of the trunk. In highly obese individuals with no narrowing of the trunk, where no waist or narrowing of the trunk was present, we measured the minimal circumference of the abdomen in the zone between the inferior border of the ribs and the iliac crest. HC was measured from the maximum perimeter of the buttocks.
From these measurements, BMI according to Quetelet’s calculation was estimated: weight (kg)/height (m2). In addition to total BMI, the four-category scale defined by the World Health Organization( 7 , 24 ) was estimated as follows: underweight (<18·5 kg/m2), normal BMI (18·5–24·9 kg/m2), overweight (25·0–29·9 kg/m2) and obesity (≥30·0 kg/m2). Most authors agree that there are no specific BMI cut-off values for older adults. In the present study, cut-off points recommended by the WHO were used in order to make comparisons with previously published statistics in Mexican groups or in populations from other countries( Reference Castillo-Martínez, García-Peña and Juárez-Cedillo 25 ).
In order to identify abdominal obesity or adiposity, WHR, which has also been identified as risk for health conditions and part of the metabolic syndrome, was calculated. Following World Health Organization( 26 ) recommendations of WC cut-off points made for overweight or obesity and association with disease risk, a binary variable indicating risk based on WC was calculated using the following cut-off points: for men, WC>102 cm; and for women, WC>88 cm. Finally, following Bray( Reference Bray 27 ), WHR cut-off points of ≥1·0 for women and ≥0·85 for men were defined as an additional indicator of adiposity or abdominal obesity.
Statistical analysis
Sex- and age group-specific (60–64, 65–69, 70–74, 75–79, 80–84 and ≥85 years) mean, standard deviations and percentiles (5th, 10th, 25th, 50th, 75th, 90th, 95th) of the anthropometric measures were calculated. In order to evaluate dispersion, the CV (sd/mean) of all anthropometric measurements was also calculated. Finally, the median was calculated in order to compare these values with the mean as an additional indicator of the distribution in the anthropometric measures and how close to a normal distribution they were. Although the study had no upper age limit and the oldest person reported was of 114 years of age, sample sizes of persons aged 85 years and older were small, and therefore they were combined to form a single age group. Given the impact of secular trends in height and normal effect of ageing on height, knee height was estimated, given the lesser effect of ageing on the long bones of the body.
Student’s t test analysis was performed to investigate differences in mean values of anthropometric measures between men and women, and the χ 2 analysis was performed in order to measure the relationship between sex and BMI categories. The effect of age group on anthropometric measures was investigated by ANOVA and Tukey’s test for multiple comparisons among all age groups. Tukey’s test performs all possible pairwise comparisons between groups. For each measure (weight, height, knee height, BMI, WC, HC, CC and WHR), the results of Tukey’s test are indicated with superscript letters next to their mean values. Means sharing a superscript letter indicate that mean values between the age groups are not significantly different from each other, whereas mean values with different superscript letters indicate that they are significantly different from each other. Mean values that show two superscript letters indicate that the specific age group is significantly different from one group(s) (those showing a different letter) but not significantly different from the other(s) (those showing the same letter). For all estimations, statistical significance was defined with 5 % CI (P<0·05). All the data were processed and analysed using the statistical software STATA© ( 28 , 29 ).
Results
The final working sample consisted of 7865 adults aged 60 years and older, of which 53·9 % were women (n 4239). Age ranged from 60 to 114 years, with a mean of 70·6 (sd 8·1) years. For women, mean age was 70·5 (sd 8·1) years and for men 70·65 (sd 8) years. In this sample of older Mexican adults, 29 % had no formal education, 60·9 % completed primary or secondary school and only 9·3 % had some high school or higher education; 33·2 % of women reported having no formal education, 58 % completed primary education and 8·4 % reported having secondary education or higher. For men, the reported values were 25·8, 63·8 and 10·4 %, respectively, and these differences in educational attainment were statistically significant (P<0·001). Moreover, 14·8 % of women in the sample were single (including divorced or separated) at the time of the survey, whereas the proportion of those married and widowed was almost equal with values of 43 and 42·2 %, respectively. In contrast, 71·3 % of the men reported being married, whereas 12 and 16·7 % reported being single (including divorced or separated) or widowed, respectively. These differences were statistically significant (P<0·001); 15 % of older adults in the sample reported having no health insurance, 46 % were affiliated to a social security institution and 38 % were affiliated to the Seguro Popular, which provides services through federal- and state-level Ministry of Health institutions. No statistically significant difference in health insurance status was found between men and women.
Following definitions set by ENSANUT 2012( Reference Gutiérrez, Rivera-Dommarco and Shamah-Levy 30 ), data for height between 1·3 and 2·0 m and values of BMI between 10 and 58 kg/m2 were considered valid. Data outside these intervals for height (n 25, 0·3 %) and for BMI (n 7, 0·09 %) were excluded from the analysis. For WC, values between 50 and 180 cm were considered valid, and data outside these intervals were excluded from the analysis. Accordingly, for WC, 0·11 % (n 8) of observations were deleted. Descriptive statistics show that, with the exception of weight, statistical distribution of anthropometric measures were close to normal judging from the similarity between the means and the 50th percentiles, and the relatively small magnitude of the variation coefficients, most of them about 10–15 %. Tests of normality showed slight kurtosis for weight, knee height, HC and CC and slightly skewed data for knee height and CC.
ANOVA showed a statistically significant difference by age group for weight, height, BMI and knee height (P<0·001) (Tables 1 and 2) as well as for WC, HC and CC (P<0·001) (Tables 2 and 3), but no significant difference in waist–hip circumference by age group (Tables 2 and 3). In addition, statistically significant differences were found between men and women in height, weight, circumferences, BMI and knee height (P<0·001).
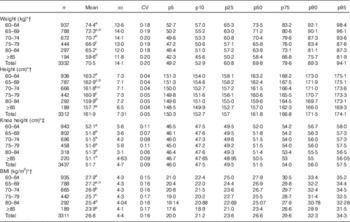
Table 1 Weight, height, knee–heel height and BMI in women aged 60 years and older (Numbers; mean values and standard deviations)

p5, p10, p25, p50, p75, p90 and p95, 5th, 10th, 25th, 50th, 75th, 90th and 95th percentiles.
a,b,c,d,e For each measure, superscript letters next to the mean values indicate results of Tukey’s test. Means sharing a letter indicate that values between the age groups are not significantly different from each other, whereas mean values with different superscript letters indicate that they are significantly different from each other. Mean values that show two superscript letters indicate that the specific age group is significantly different from one group(s) but not significantly different from the other(s) (P<0·05).
* Mean values were significantly different between men and women (Student’s t test; P<0·001).
† Mean values were significantly different across all age groups (ANOVA; P<0·001).
‡ Mean values were significantly different across all age groups (ANOVA; P<0·01).
Table 2 Weight, height, knee–heel height and BMI in men aged 60 years and older (Numbers; mean values and standard deviations)
p5, p10, p25, p50, p75, p90 and p95, 5th, 10th, 25th, 50th, 75th, 90th and 95th percentiles.
a,b,c,d,e For each measure, superscript letters next to the mean values indicate results of Tukey’s test. Means sharing a letter indicate that values between the age groups are not significantly different from each other, whereas mean values with different superscript letters indicate that they are significantly different from each other. Mean values that show two superscript letters indicate that the specific age group is significantly different from one group(s) but not significantly different from the other(s) (P<0·05).
* Mean values were significantly different between men and women (Student’s t test; P<0·001).
† Mean values were significantly different across all age groups (ANOVA; P<0·001).
‡ Mean values were significantly different across all age groups (ANOVA; P<0·01).
Table 3 Body circumferences (cm) in women aged 60 years and older (Numbers; mean values and standard deviations)

p5, p10, p25, p50, p75, p90 and p95, 5th, 10th, 25th, 50th, 75th, 90th and 95th percentiles.
a,b,c,d,e For each measure, superscript letters next to the mean values indicate results of Tukey’s test. Means sharing a letter indicate that values between the age groups are not significantly different from each other, whereas mean values with different superscript letters indicate that they are significantly different from each other. Mean values that show two superscript letters indicate that the specific age group is significantly different from one group(s) but not significantly different from the other(s) (P<0·05).
* Mean values were significantly different between men and women (Student’s t test; P<0·001).
† Mean values were significantly different across all age groups (ANOVA; P<0·001).
Tables 1 and 2 show results for weight, height, BMI and knee–heel height (mean, standard deviation, CV and percentiles) for women and men, respectively, and distributed by age group. Both for women and for men, mean weight and height were lower in the oldest age groups compared with the youngest (P<0·001). Median values for weight were slightly lower than the mean in both sexes, with this difference being larger as age increased. Along with values of 20 % for the CV, these showed a slightly skewed distribution, higher dispersion and heterogeneity in the values for weight in men and women. Comparing the age groups with each other showed a trend towards smaller values in median weights between the youngest (60–64 years) and the oldest (≥85 years) groups of 27 % (18·1 kg) for women and 20·4 % for men (15·1 kg). Multiple comparison procedures using Tukey’s test showed that for women differences were significant between all groups, with the exception of the 75–79 and 80–84 years groups (Table 1), whereas for men differences were significant between most groups, except of each age group with the preceding one. The oldest group was significantly different from the rest (Table 2). The difference in mean height between the youngest and the oldest age groups (60–64 v. ≥85 years) was 6·1 cm (6·4 cm for median) for women and 5·5 cm (6·2 cm median) for men. This corresponds to 4 % smaller values in mean for women (of 4·3 % median) and 3·4 % (3·8 % median) for men. The observed low values of 4 % in the CV for height shows little dispersion, and thus more evenly distributed and homogeneous values in this population sample (Tables 1 and 2).
Difference in knee height with age was much smaller than the observed effect of ageing on height, representing approximately 50 % less than that observed in height. In women, the reduction in mean knee height was 1·4 cm (1·1 cm median), representing a 2·9 % difference (2·3 % median) between the 60–64 and ≥85 years age groups. For men, the mean difference was 1 cm (1·5 cm median), representing a 1·9 % difference in the mean value (2·9 % in median) between these same age groups. The proportion in the trend towards smaller values was similar between men and women. Tukey’s test of multiple comparisons revealed a significant difference between the three youngest age groups (60–64, 65–69 and 70–74 years) and the oldest group in women, and no statistically significant difference was found in men when all the age groups were compared between each other.
Mean BMI was higher in women than in men in all age groups (P<0·001) and for both sexes, and it was lower with increasing age (P<0·001) (Tables 1 and 2). Multiple comparisons showed a significant difference between the two youngest age groups (60–64 and 65–69 years) and all the other age groups in women (Table 1). For men, there were no significant differences between the 60–64 and 65–69 years age groups or between the 65–69 and 70–74 years age groups, whereas the oldest age groups (75–79, 80–84 and ≥85 years) were significantly different from each of the other age groups (Table 2).
Distributions of body circumferences (means, standard deviations, percentiles and CV) are shown in Tables 3 and 4. Mean WC values were similar between women and men, with values of 95·5 (sd 13·2) cm and 96·7 (sd 12·2) cm, respectively. On the other hand, mean HC was higher in women than in men by approximately 5 cm, and the difference was statistically significant (P<0·001). For both men and women, WC, HC and CC presented lower values with increasing age, with the exception of the group 80–84-year-old men, which showed greater mean value than the precedent group.
Table 4 Body circumferences (cm) in men aged 60 years and older (Numbers; mean values and standard deviations)

p5, p10, p25, p50, p75, p90 and p95, 5th, 10th, 25th, 50th, 75th, 90th and 95th percentiles.
a,b,c For each measure, superscript letters next to the mean values indicate results of Tukey’s test. Means sharing a letter indicate that values between the age groups are not significantly different from each other, whereas mean values with different superscript letters indicate that they are significantly different from each other. Mean values that show two superscript letters indicate that the specific age group is significantly different from one group(s) but not significantly different from the other(s) (P<0·05).
* Mean values were significantly different between men and women (Student’s t test; P<0·001).
† Mean values were significantly different across all age groups (ANOVA; P<0·001).
Multiple comparisons showed that both in men and in women most significant differences were found between the three youngest and the three oldest age groups. In men and women, median values for WC and HC were slightly lower than the mean indicating a slightly skewed distribution. On the other hand, there was a significant difference in CC between the youngest (60–64 years) and the oldest (≥85 years) group of 15·1 % (5·3 cm) and 12·5 % (4·5 cm) for women and men, respectively.
Categories of BMI are useful to make comparisons between populations and to characterise those at risk by underweight or obesity. Table 5 presents the prevalence of BMI categories according to the World Health Organization( 7 , 24 ) cut-off points, showing that the prevalence of overweight and obesity combined is larger in women (73 %) than in men (64·3 %). Specifically, obesity is the most prevalent category in women with 37 % of the sample, whereas in men obesity represents 21·9 % of the sample. In men, overweight is the most prevalent category with 42·4 % of the sample. Only 33 % of men and 25 % of women were in the normal BMI category. Looking at BMI categories by age groups, it is clear that for both women and men the lowest values are found in the oldest old (≥85 years), showing the highest prevalence of underweight, which was identified in 4·2 % of the sample (<18·5 kg/m2), with values of 2·3 and 1·9 % for women and men, respectively.
Table 5 Categories of BMI in men and women aged 60 years and older. Mexico, Encuesta Nacional de Salud y Nutrición 2012 (Numbers and percentages)

The results of the indicator of adiposity or excess central adipose tissue as potential high health risk showed that 72 % of women had values of WC equal or larger than 88 cm, and 33 % of men had values equal or higher than 102 cm, thus classifying them within the at-risk group( Reference Barbosa, Souza and Lebrao 19 ). Women presented the maximum prevalence of adiposity in the 65–69 years age group with 78 % of the sample in this group, and with lower values afterwards as age increased. For men, maximum prevalence (36·7 %) was observed in the youngest age group (60–64 years).
According to the binary indicator of abdominal obesity( Reference Bray 27 ), 86 % of women and 42 % of men fall in the at-risk group by presenting WHR of ≥0·85 and ≥1 for women and men, respectively (table not shown, available at request). Women of all age groups presented similar percentages of at-risk WHR, whereas for men values were smaller as age increased with a difference of approximately 20 percentage points between the youngest (60–64 years) and oldest (≥85 years) age groups with values of 42·5 and 25·6 %, respectively.
Discussion
This study presents summary values for anthropometric measures in a representative sample of Mexican community-dwelling adults aged 60 years and older. It used the ENSANUT 2012 – a population-based household survey of Mexicans – which, for the first time in 2012, included in its sampling structure design and methodology a specific sample of adults aged 60 years and older, representative of the total population in this age group, and thus the results could be extrapolated to the total population and used as reference data and for comparison and assessment of older adults in other local samples.
In addition, it can be compared with samples in other countries with similar social and economic conditions such as Latin American countries or with similar background such as the population with Mexican background in the USA. Given the size of the sample, with the exception of weight in men and women, most statistical distributions were normally shaped, judging from the similarity between the means and the 50th percentiles and the relatively small magnitude of the variation coefficients, most of them being about 10–15 %. Notwithstanding the cross-sectional nature of the study, the effect of age can be appreciated in the declining means with age of height, BMI, WC, HC and CC; in all of these variables, this effect was greater in women. Of all these anthropometric variables, the decline of height with age has been studied more systematically because it is the denominator in the calculation of BMI, thus overestimating the prevalence of overweight and obesity( Reference Trotter and Gleser 31 – Reference Sorkin, Mueller and Andres 33 ).
Decrease of stature with ageing is a process that responds to diverse factors. It is partly represented by actual shrinkage over the life span due to postural changes, thinning of the disks of the spinal column, the diminution in the height of the vertebrae and problems such as scoliosis, which are all associated with ageing, and partly due to the secular trend towards greater stature where younger generations are taller than previous ones( Reference Trotter and Gleser 31 – Reference Sorkin, Mueller and Andres 33 ). Given these factors, further studies of height decline with age and maximum height attained using this national population-based survey should be carried out in order to investigate how all these mentioned factors play out in the Mexican population and their ageing process.
An unexpected finding was the average 1 cm difference in mean knee–heel height between the youngest and the oldest subjects, in both women and men. This was a significant observation as most formulae proposed to correct height decline with age assume that the knee height remains stable with ageing. However, the magnitude of knee–heel height reduction in this study is quite small compared with the reductions found in the upper segment of the body of 5–6 cm, or approximately 4 %, between the youngest and the oldest age groups in both men and women. Although small, this reduction in knee height has been observed in samples from previous studies( Reference Roubenoff and Wilson 34 ) and it is attributed to changes in soft tissues as well as to osteoporosis.
Another finding of interest was the observed decline in CC as age increased, as CC, in addition to dual-energy X-ray absorptiometry and bioelectrical impedance analysis, is commonly used to estimate muscle mass and muscle mass loss for the definition and operational criteria for the presence of sarcopenia. Sarcopenia has been defined as mainly, but not only, an age-related condition defined by the combined presence of reduced muscle mass, muscle function and strength that occurs with advancing age( Reference Lauretani, Russo and Bandinelli 35 , Reference Cruz-Jentoft, Baeyens and Bauer 36 ). As shown in Tables 3 and 4, muscle mass loss with age is significant in both men and women as observed in the approximately 5-cm reduction in the mean CC between the youngest (60–64 years) and the oldest (≥85 years) age groups. Although a few studies use CC as the sole indicator of muscle mass, previous anthropometric studies measuring muscle mass using CC have used a cut-off point of 31 cm( Reference Rolland, Lauwers-Cances and Cournot 37 , Reference Pagotto and Silveira 38 ). Using this cut-off point, 22·0 % of the sample – 26·7 % of women and 16·5 % of men – would classify as having low muscle mass. In both men and women, there was an increasing prevalence of this category as people aged, with significant differences between the youngest (60–64 years) and the oldest (≥85 years) age groups, and this trend was more prevalent in women than in men. In women, in the 60–64 years group, 15·3 % would classify as having low muscle mass compared with 54·1 % in the ≥85 years group, whereas in men 8·5 and 33·0 % would present this characteristic in these age groups, respectively. Using a combined measurement of muscle mass with CC, muscle strength by grip strength and physical performance through gait speed, a study on sarcopenia in a sample of adults aged 70 years and older in Mexico City( Reference Arango-Lopera, Arroyo and Gutiérrez-Robledo 18 ) interestingly reported similar results with a prevalence of sarcopenia in 33·6 % of the subjects (48·5 % in women and 27·4 % in men), with prevalence increasing with age reaching 50 % in those 80 years and older.
The use of the same cut-off points for anthropometric measures for older adults as young adults, including BMI, has been contested, and some authors have recommended using alternative cut-off points that are specific for the sample or population group and developed through the use of longitudinal studies( Reference Sergi, Perissinotto and Pisent 39 ). A recent example developing specific population cut-off points includes the work by Sergi et al.( Reference Sergi, Perissinotto and Pisent 39 ) who confirmed that low BMI is a predictive factor of short-term mortality in elderly persons in the Italian Longitudinal Study of Aging. In the future, prospective studies should be carried out in different populations, taking into account the loss of stature with ageing in order to validate current or alternative cut-off points.
In spite of using cross-sectional data and this being a limitation as real effects of ageing on measures such as height and BMI cannot be estimated and are only possible with longitudinal studies, the data presented allow for a preliminary estimation of the prevalence of overweight and obesity in the Mexican population, as no correction for height decline in Mexico has been made at the population level. The results of BMI categories presented in Table 5, along with the analysis of the percentile distribution of BMI shown in Table 1, allow for a deeper insight on these values. In women aged 60–64 years, the 25th and 50th percentiles of BMI are 26·0 and 29·3 kg/m2, respectively, which means that nearly one half of this group is obese, according to the cut-off value ≥30 kg/m2 proposed for the adult population. On the other side of the age spectrum, women aged 80 years and older, the same percentile values are 24·3 and 27·6, indicating a reduction in the prevalence of both overweight and obesity, but leaving an important proportion of women with these two health-risk conditions. In men, the percentile distributions of BMI show the same pattern, but at lower levels.
Although these figures overestimate the prevalence of both overweight and obesity due to height decline with age, as it has already been mentioned, their magnitude in the Mexican old population re-inforces the need for establishing cut-off points specific for these age groups and for men and women separately. The data presented in Table 3 indicate that in women the distribution of adiposity is predominantly abdominal and that there is a reduction in both WC and HC with age. In men (Table 4), although the central adiposity is less marked, a decline in adiposity with age was also present. The comparison of these distributions with proposed cut-off points for women and men, shown in Table 6, was consistent with the analysis of the percentile distribution. Using the World Health Organization’s categories( 7 , 24 ), in this study, 2·3 % of men and 1·9 % of women were underweight and likely malnourished or at high risk of being so. The fact that 7 % of men and 4 % of women in the oldest age group (≥85 years) are underweight should be taken into account by public officials in order to identify them and provide them with the needed support as to overcome associated risks for this condition. However, as it in the case of categories for the definition of overweight and obesity, estimation of the prevalence of malnutrition needs, besides the correction for height decline, the definition of proper cut-off points for older adults. It seems that a cut-off point between 20 and 22 is a better predictor of risk of underweight than the current WHO cut-off point( Reference Sergi, Perissinotto and Pisent 39 , Reference Perissinotto, Pisent and Sergi 9 ).
Table 6 Adiposity according to waist circumference thresholds for men and women aged 60 years and older (Numbers and percentages)

Although there are scarce previous studies on anthropometric measures in Mexican older adults, the samples used are only representative of specific populations in the country, such as social security affiliates( Reference Sánchez-García, García-Peña and Duque-López 16 ) and/or residents of Mexico City( Reference Velásquez-Alva, Irigoyen and Zepeda 15 ). Average values reported in these studies are, in general, higher than those reported in the present study, possibly implying that these samples the other studies used belonged to selected urban segments of the Mexican population. In a report of health and nutrition conditions of older adults using the ENSANUT 2006, Shamah-Levy et al.( Reference Shamah-Levy, Villalpando-Hernández and Rivera-Dommarco 22 ) report slightly lower BMI prevalence of obesity in women and of underweight in men. All the studies presented similar values, where men were taller and had higher body mass (weight), whereas women presented larger means in HC and BMI than men. Similar to studies in other countries, CC was quite similar in men and women in the previous Mexican studies that included this measure( Reference Velásquez-Alva, Irigoyen and Zepeda 15 , Reference Sánchez-García, García-Peña and Duque-López 16 ). Notwithstanding, comparison among studies should be carried out with caution, especially because of the differences in samples and methods used, and these are still considered valuable to identify common patterns in anthropometric measures as well as trends by sex and age in diverse populations.
Although the use of community-dwelling population includes both healthy individuals and those with functional diseases, it excludes those living in institutions. Although there are no national-level data on number and characteristics of institutionalised older adults in Mexico, they are estimated to represent about 5 % of total population aged 60 years and older( Reference Gutiérrez-Robledo, Reyes-Ortega and Rocabado-Quevedo 40 ). Although small, these individuals are usually the frailest, and therefore their characteristics should also be obtained, and this can be an additional limitation to the present study.
In conclusion, this study presents sex- and age-specific reference data for a number of anthropometric measurements for Mexican adults aged 60 years and older. To our knowledge, this is the first study to present detailed reference values for anthropometric measures and body composition, by age group and for men and women separately. The main findings are as follows. First, women have higher prevalence of overweight, obesity and adiposity than men, whereas men are taller, heavier and present larger WC than women. Second, although this study used cross-sectional data, we found an age trend towards lower values in the distributions of anthropometric measures, including CC, suggesting a tendency to muscle mass loss with ageing. Third, significant differences were found between men and women in height, weight, circumferences, BMI and knee height. Although small, the latter index showed lower values in the oldest categories of women, but not in men, and these differences were statistically significant. Finally, an increasing prevalence of underweight with ageing was observed. These results are consistent with studies of older adults in other countries, and can be used for comparison with state/local samples and as reference in clinical settings as a tool for detection of individuals at risk of either underweight or overweight and obesity.
Acknowledgements
Data files and documentation for the ENSANUT 2012 are for public use.
The authors received no financial support for the design and analysis of the study or the writing of the manuscript.
The authors’ contributions are as follows: M. L.-O. designed the study, analysed the data and wrote initial draft of the manuscript; P. A. and M. L.-O. contributed to the interpretation of data and critical review of the manuscript. Both authors approved the final version of the manuscript.
The authors declare that there are no conflicts of interest.


