


Fluoride (F) has an important nutritional and public health impact due to its beneficial role in mineralisation of bones and teeth( Reference Palmer and Wolfe 1 ). Following gastrointestinal absorption, F is mainly incorporated into calcified tissues that contain >99 % of body burden of F. The role of F in improving oral health by providing a protective effect against dental caries is well established( Reference Featherstone 2 , Reference McDonagh, Whiting and Wilson 3 ). However, excessive F intake during tooth development can increase the risk of dental fluorosis (tooth mottling). The optimal total daily intake of F to benefit dental health, while minimising the risk of developing dental fluorosis, has been suggested to range between 0·05 and 0·07 mg/kg body weight (bw) per d( Reference Burt 4 ), whereas an intake of 0·1 mg/kg bw per d has been termed as the tolerable upper intake level (UL)( 5 ) – the level at which moderate forms of dental fluorosis can develop. Due to the narrow margin between optimal and excessive F intake, knowledge of total daily F intake (TDFI) at the individual and population level is essential when recommendations for F use, particularly in young children, are being considered.
The common sources of systemic F are diet and toothpaste. According to the literature, the reported contribution of diet to TDFI ranges from 20 % in 1–3-year-old Brazilian children( Reference de Almeida, da Silva Cardoso and Buzalaf 6 ) to 75 % in 6-year-old children living in an optimally fluoridated area in the USA( Reference Levy, Warren and Broffitt 7 ). Such variations could be due to the differences in age, tooth brushing, dietary habits and F concentration of the diet as well as the dietary methods used to assess dietary F intake in these groups of children.
In a group of 6–7-year-old UK children, diet has been reported to contribute between 44 and 41 % of TDFI to those living in a low F area (0·30 mgF/l) and natural F area (1·06 mgF/l), respectively( Reference Zohoori, Walls and Teasdale 8 ). Tap water, fruit squashes (prepared with tap water) as well as cooked rice, pasta and vegetables were reported as the main sources of dietary F intake in 6–7-year-old children receiving optimally fluoridated water (0·82 mgF/l), whereas carbonated soft drinks and bread were the most important contributors to dietary F intake in those children receiving non-fluoridated water (0·08 mgF/l)( Reference Zohouri, Maguire and Moynihan 9 ).
Depending on the purpose of the evaluation, different methods have been used to assess dietary intake of energy and nutrients, with a 7-d weighed food diary regarded frequently as the ‘gold standard’ method( Reference Willett 10 ). However, the two most commonly used dietary assessment methods for daily dietary F intake (DDFI) are duplicate plate and food diary methods. Although the food diary method estimates F intake on the basis of Food Composition Tables, the actual foods and drinks collected in duplicate diets are analysed for F when a duplicate plate method is used. However, both methods have drawbacks, which may limit their use in some populations. Due to F analysis of the duplicated diets, this method is suggested to reflect the actual F content of the diet( Reference Guha-Chowdhury, Drummond and Smillie 11 ). However, this estimate might be affected by reporting bias if any food or drink items are omitted from the duplicate. In addition, as all the food and drinks are pooled, the primary food or drink sources of dietary F intake cannot be identified. In contrast, using the food diary method, a full description is provided for consumed food and drinks, allowing individual sources of F intake to be identified( Reference Maguire, Zohouri and Hindmarch 12 ). Furthermore, if food and drinks are recorded at the time of consumption, the measurement is less likely to be affected by misreporting. The food diary method is also less burdensome for participants, and therefore more practical for use with large numbers of study subjects. However, the food diary method may also be affected by coding errors and/or non-inclusion of a given food type in the Food Composition Table( Reference Basiotis, Welsh and Cronin 13 ). The major burden of the duplicate plate collection is the cost, which may result in individuals altering their dietary habits. Although the cost of duplicating is usually reimbursed to participants, applying this method to large-scale epidemiological studies can be very costly and may result in a lower response rate( Reference Willett 10 , Reference Gibson 14 ).
Regular monitoring of F intake in children has been suggested by the WHO( Reference Petersen, Baez and Marthaler 15 , Reference Marthaler 16 ). To maximise prevention of dental caries and minimise the risk of dental fluorosis, assessment of F intake at both an individual and a community level is crucial before making any decision on F use or F supplementation.
No robust evidence is available to suggest the use of one method over another for the assessment of dietary F intake, although the choice is dependent on the aims and objectives of a given study – for example, to identify the main dietary sources of F or to provide baseline data for public health administrators when determining whether any additional fluoridisation programme for caries prevention is needed.
There is only one pilot study in the literature that has reported dietary F intake estimated by both duplicate plate and food diary methods in a group of 15–30-month-old children living in an area with fluoridated water supply in Indiana, USA( Reference Martinez-Mier, Kelly and Eckert 17 ). However, the major limitation of that study was the small sample size (n 12), all of whom were recruited from a single day-care centre. Furthermore, findings from one population and in a particular setting can be limited in terms of representativeness and potential for extrapolation, and therefore additional research in different populations and settings is warranted. Therefore, the aim of this present study was to compare DDFI, at group and individual levels, estimated by the following two methods: ‘2-d duplicate plate (2-d DP)’ and ‘3-d food diary (3-d FD)’. The subsidiary aims were to compare daily variation in dietary F intake at the individual level obtained by each method.
Methods
This study was conducted according to the guidelines laid down in the Declaration of Helsinki. All the procedures involving human subjects were approved by the County Durham and Tees Valley I Research Ethics Committee (Ethics no. 08/H0905/116). Written informed consent was obtained from all the participants before the study was initiated.
The study was undertaken in Newcastle upon Tyne, a city located in the north-east of England with the tap water supply fluoridated at 0·9 ppm. Before the study was initiated, the Director of the Children’s Service Directorate and Local Education Authorities were contacted and informed of the study. Parents of all healthy children aged 4–6 years were contacted through the primary schools, which agreed to take part in the study. In total, sixty-one parental consents were obtained.
The study had a randomised cross-over design, comparing observations within and between individuals. Each child underwent two data and sample collection sessions in which a different dietary method was used, with an interval of approximately 1 week between each session. Children were randomised to the order in which the two allocated dietary methods were used and each family was visited three times at home between April and November 2009 to collect samples and data.
During Visit 1, the weight of child was measured without shoes and jacket to the nearest 0·1 kg using a portable digital balance (Soehnle Linea; ADE GmbH & Co.). Height was also measured to the nearest 0·1 cm using a stadiometer (Soehnle MZ10020; ADE GmbH & Co.). Parents were provided with collection containers and bottles as well as written instructions for collecting duplicated meals and verbal instructions for sample collection. A sample of tap water was collected at each visit and dietary data were collected during the second and third visits. The importance of maintaining the usual dietary habits during the dietary data collection period was emphasised to the parents.
Dietary data collection
3-d food diary method
A food diary, with complete instructions on how to record food/drink items, was given to parents. They were also instructed verbally on how to estimate serving portion sizes using common everyday household items( Reference Zohouri, Maguire and Moynihan 9 , Reference Maguire, Zohouri and Hindmarch 12 , Reference Zohouri and Rugg-Gunn 18 ). They were asked to take the food diary with them anywhere they went outside the home and record all the food items and drinks consumed by their child over 3 consecutive days, comprising 2 weekdays and 1 weekend day. During weekdays, if the child took a packed lunch to school, food and drinks included in the packed lunch were recorded by the parents. Parents were asked to remind their child to bring back any leftovers in order for them to record the correct amount of consumed food. However, if the child was receiving a school dinner, the study researcher attended the school to record the items. In addition, for each home-made food and drink consumed, parents were requested to keep a sample of approximately 50 g in a plastic storage container provided for this purpose and record the recipe in the food diary. During weekdays, the study researcher visited the school to record the items consumed by each study child. A post-completion interview with parents was conducted on Day 4 (Visit 2) to ensure that all dietary data had been recorded as precisely as possible. The accuracy of estimates of food portion sizes made by parents was also checked using a photographic food atlas( Reference Nelson, Atkinson and Meyer 19 ).
2-d duplicate plate method
Parents were asked to duplicate portions of all food and drink items consumed by their child by carefully observing and replicating the actual consumed amounts over 2 consecutive days – 1 weekday and 1 weekend day( Reference Guha-Chowdhury, Drummond and Smillie 11 , Reference Chowdhury 20 ). Parents were provided with (1) storage containers for duplicated food, (2) storage bottles for duplicated water and (3) storage bottles for other duplicated drinks and were instructed to separate the parts of food items not usually eaten such as bones, fruit skin, cores, etc., before placing them in the provided container, keeping containers for each day separate. During the school days, an identical duplicate of each child’s school dinner as well as any other consumed items such as midday snack was obtained from the school by the researcher.
At the post-completion interview, which was conducted on Day 3 (Visit 3), all the duplicate items were checked with parents to ensure that no food and drinks had been omitted from the duplicated collection.
Sample preparation and fluoride analysis
2-d duplicate plate
Duplicate food samples collected daily at home and school were pooled, weighed and homogenised using an industrial blender (Thermomix TM31; Vorwerk).
3-d food diary
Collected home-made food samples were also homogenised using a small domestic food processor (Kenwood CH180A; Kenwood).
The F concentrations of water and non-milk-based drinks were measured by a direct method and in triplicate using an F ion-selective electrode (F-ISE) (Model 9409; Orion) and meter (Model 720; Orion) after sample buffering with a total ionic strength adjustment buffer (TISAB III)( Reference Martinez-Mier, Cury and Heilman 21 ). Food samples and milk-based drinks were analysed in triplicate for F concentration after overnight hexamethyldisiloxane-facilitated diffusion at room temperature using an F-ISE and meter( Reference Martinez-Mier, Cury and Heilman 21 , Reference Taves 22 ). Reliability of the F measurements was checked by re-analysis of 10 % of all food and drink samples, and a known amount of F was added to 10 % of all the samples to evaluate the validity of the F analysis method.
Assessment of daily dietary fluoride intake
3-d food diary
The dietary records of each child were analysed using Weighed Intake Analysis Software Package (WISP) developed by Tinuviel, UK( 23 ). WISP is a nutritional analysis program based on nutrient files compiled from McCance and Widdowson’s Food Composition Tables (5th and 6th Editions and their supplements)( Reference McCance, Widdowson and Holland 24 ). However, WISP, like any other nutrient software, does not include information on F content of food and drinks. An in-house F database developed by both Newcastle and Teesside Universities( Reference Zohoori and Maguire 25 ) was used, from which information on the F content of several hundred food and drink items were added to WISP.
2-d duplicate plate
Measured F concentrations of foods (µg/g), drinks and water (µg/ml) representing the average of triplicate readings were multiplied by the weight of the corresponding items consumed by each child per d to estimate DDFI from each source.
Statistical analysis
Data were descriptively analysed using SPSS version 17.0 (SPSS), and a paired t test was used to compare the two dietary methods at the group level.
Dietary data at the individual level were compared using linear regression analysis.
The typical within-child variability (expressed as a standard deviation) in dietary F intake from one measurement to the other was derived from the root of the mean square error for the within-subject effect.
Results
Anthropometric data
All sixty-one children completed all the aspects of the study. The mean age, weight, height and BMI were 5·5 (sd 0·9) years, 21·2 (sd 4·1) kg, 113·1 (sd 7·3) cm and 16·4 (sd 1·9) kg/m2, respectively.
Quality control of fluoride analysis
The mean difference in F concentration from test to re-test ranged from 0·003 µg/g for food to 0·018 µg/ml for water samples. The mean percentage recovery of F added to the samples before F analysis was 99·3 (sd 0·53) %.
Comparison of the weight of consumed foods, drinks and water recorded using the two methods
The mean weights of foods, drinks and water obtained by each method are presented in Table 1. There was no statistically significant difference in the mean weight of consumed drinks (excluding water) between the two methods. However, the mean weight of collected water recorded by the 2-d DP method (204 g) was significantly higher (P<0·001) than the corresponding weight recorded by the 3-d FD method (139 g). For solid foods, the mean weight reported by the 3-d FD method (839 g) was significantly higher (P<0·001) than that obtained by the 2-d DP method (734 g). Overall, no statistically significant difference (P=0·88) was observed in the total weight of all foods and drinks consumed by the children between the 3-d FD (1271 g) and 2-d DP (1266 g) methods.
Table 1 Comparing the mean estimated weight (g) of foods, drinks and water consumed, measured by 3-d food diary (3-d FD) and 2-d duplicate plate (2-d DP) methods (Mean values and standard deviations; mean differences and 95 % confidence intervals)
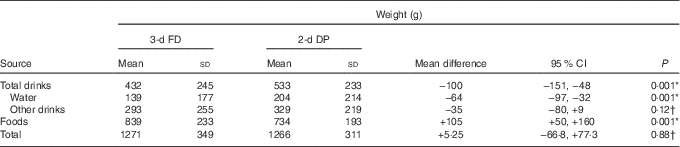
* Statistically significant.
† Not statistically significant.
Comparison of daily dietary fluoride intake from foods, drinks and water using the two methods at the group level
The DDFI from three major dietary sources – food, drinks and water – recorded by each method are presented in Table 2. The mean DDFI from drinks (excluding water) and from foods (mg/d and mg/kg bw per d) was not statistically significantly different between the two methods when analysed using a paired t test. However, a statistically significantly higher DDFI from water (P<0·001) was obtained when the 2-d DP method was used. The mean DDFI from all dietary sources (mg/d and mg/kg bw per d) estimated by the 3-d FD method was 0·533 (sd 0·319) mg/d (0·025 (sd 0·016) mg/kg bw per d), whereas the corresponding values estimated by the 2-d DP method were not statistically significantly different at 0·583 (sd 0·263) mg/d (0·028 (sd 0·013) mg/kg bw per d).
Table 2 Comparison of mean fluoride (F) intake from each dietary source (mg/d) and mean total daily dietary F intake (DDFI) estimated by 3-d food diary (3-d FD) and 2-d duplicate plate (2-d DP) methods (mg/d and mg/kg body weight (bw) per d) (Mean values and standard deviations; mean differences and 95 % confidence intervals)

* Statistically significant.
† Not statistically significant.
Comparison of daily dietary fluoride intake using the two methods at the individual level
Based on the linear regression analysis, at the individual level, the typical error (95 % CI) in estimating F intake using the 3-d FD method compared with the 2-d DP method was within ±0·011 (95 % CI 0·009, 0·013) mg/kg bw per d. Table 3 describes the higher within-child variation of ±0·280 (95 % CI 0·240, 0·340) mg/d in DDFI when dietary data were collected using the 3-d FD method compared with the 2-d DP method, for which the within-child variation was ±0·191 (95 % CI 0·160, 0·230) mg/d.
Table 3 Comparison of within-child day-to-day variability in daily dietary fluoride intake (DDFI) (mg/d) estimated by each dietary method (Mean values and standard deviations; typical within-child variability and 95 % confidence intervals)

3-d FD, 3-d food diary; 2-d DP, 2-d duplicate plate.
* This is the 1st day of the 2-d DP method.
Comparison of the percentage of children with suggested optimal and tolerable upper intake level for fluoride intake using the two methods at the individual level
When dietary data were collected by the 3-d FD method, the DDFI of only 3·3 % of the children was within the suggested optimal range for F intake (i.e. 0·05–0·07 mg/kg bw per d), whereas for 1·6 % of the children the DDFI was higher than the threshold of the UL for F intake (i.e. 0·1 mg/kg bw per d). However, when DDFI was estimated by the 2-d DP method, 9·8 % of the children received optimal F intake and no child exceeded the UL for F intake (Fig. 1).

Fig. 1 Percentage of children with suggested suboptimal (![]() , <0·05 mg fluoride (F)/kg body weight (bw) per d), optimal (
, <0·05 mg fluoride (F)/kg body weight (bw) per d), optimal (![]() , 0·05–0·07 mgF/kg bw per d), supra-optimal (
, 0·05–0·07 mgF/kg bw per d), supra-optimal (![]() , >0·07 to <0·1 mgF/kg bw per d) and tolerable upper intake level of F intake (
, >0·07 to <0·1 mgF/kg bw per d) and tolerable upper intake level of F intake (![]() , ≥0·1 mgF/kg bw per d) by the method of data collection – 3-d food diary (3-d FD) and 2-d duplicate plate (2-d DP).
, ≥0·1 mgF/kg bw per d) by the method of data collection – 3-d food diary (3-d FD) and 2-d duplicate plate (2-d DP).
Discussion
This study compared DDFI recorded by the 3-d FD and 2-d DP methods at the group and individual levels and for the first time from the three major dietary groups: food, water and drinks. The selection of the number of data collection days for this study was mainly based on other F intake studies that used 2 d and 3 d for duplicate and food diary methods, respectively( Reference Guha-Chowdhury, Drummond and Smillie 11 , Reference Maguire, Zohouri and Hindmarch 12 , Reference Zohouri and Rugg-Gunn 26 ). The present study showed no statistically significant differences in the estimated mean total weight of food and drinks consumed per d between the two methods (Table 1). Although the mean weight (g) of food consumed per d was lower when dietary data were collected by the 2-d DP method, this difference was not statistically significant. A possible explanation for the difference seen is the high level of co-operation required from participants while using the 2-d DP, as participants need to keep food containers with them for duplication of food and drinks consumed and/or purchase a similar portion of the food when they eat out. This is an extra cost and might result in participants altering their dietary habits, and therefore presents a problem with using this method, as such changes in dietary habits are not desirable in studies investigating customary nutrient intakes. The parents in the present study commented that they tended to change their customary dietary habits slightly (e.g. decided not to eat out) when duplicating meals (i.e. when using the 2-d DP method).
The 3-d FD method potentially offers several advantages, compared with the 2-d DP method, as it is cheaper with fewer burdens on the participants. Food diaries are pocket-sized and can be carried easily, allowing food and drink recordings to be made at the time of consumption, reducing the risk of omissions. The post-collection interview used with this method also enhances the accuracy of the methods by clarifying areas of potential misunderstanding by respondents as well as identifying omitted food and drinks. Furthermore, food and drink quantification is improved by the use of models of food and drink servings. As details of consumed food and drinks, including brand name, cooking and preparation methods and ingredients of mixed dishes, are recorded, the sources of F intake can also be identified more thoroughly and accurately( Reference Maguire, Zohouri and Hindmarch 12 ). It is not a common practice to collect food/drink items for analysis when assessing intakes of most nutrients using a food diary, as the Food Composition Tables provide information on the nutrient content of foods and drinks. However, in view of the impact of F concentration of the water used for preparation on the F content of a prepared meal, as well as the lack of F information in Food Composition Tables and reliance on an in-house F database( Reference Zohoori and Maguire 25 ) for commonly consumed foods and drinks that requires regular updating, collection of home-made as well as school-made meals increased the precision of the food diary method when assessing dietary F intake.
In the present study, both the methods provided similar results for mean total DDFI at the group level. The majority of F intake studies have used a duplicate method to collect dietary data. The estimate for DDFI (mg/kg bw per d) in the present study when a duplicate method was used was lower than the 0·040 mg/kg bw per d reported for 1·5–3-year-old children living in fluoridated areas of Indianapolis, USA( Reference Martinez-Mier, Kelly and Eckert 17 , Reference Rojas-Sanchez, Kelly and Drake 27 ), and Piracicaba, Brazil( Reference Paiva, Lima and Cury 28 ) and for 4–6-year-old children living in optimally fluoridated Bauru, Brazil( Reference Rodrigues, Leite and Arana 29 ). However, it was higher than 0·019 and 0·018 mg/kg bw per d reported for 3–4-year-old and 4–7-year-old children living in water fluoridated communities of New Zealand( Reference Guha-Chowdhury, Drummond and Smillie 11 ) and Brazil( Reference Paiva, Lima and Cury 28 , Reference Pessan, de Silva and Buzaluf 30 ). Conversely, for another group of 1–3-year-old Brazilian children living in fluoridated Ibia and Bauru( Reference de Almeida, da Silva Cardoso and Buzalaf 6 , Reference Paiva, Lima and Cury 28 ), the reported DDFI of 0·027 and 0·025 mg/kg bw per d, respectively, were close to the findings of the present study.
The present study’s estimate for DDFI when the 3-d FD method was used can be compared with those reported for UK and Iranian children, as those studies also used a food diary method to collect dietary data( Reference Maguire, Zohouri and Hindmarch 12 , Reference Pessan, de Silva and Buzaluf 30 ). The DDFI for children in the present study at 0·025 mg/kg bw per d was similar to that reported for 6–7-year-old UK children( Reference Maguire, Zohouri and Hindmarch 12 ), but was lower than the 0·049 mg/kg bw per d reported for 4-year-old Iranian children( Reference Zohouri and Rugg-Gunn 18 ). Within these studies that used the same dietary methods, differences in the preparation of food as well as in dietary habits could have contributed to the differences in DDFI. Between those studies that have used different dietary methods, discrepancies in DDFI could also be attributed to the use of different dietary data collection methods.
A recent study in the USA( Reference Martinez-Mier, Kelly and Eckert 17 ) used and compared the same two dietary methods used in this study on a group of 15–30-month-old children. The mean DDFI of 0·038 (sd 0·011) and 0·040 (sd 0·016) mg/kg bw per d obtained when dietary data were collected by food diary and duplicate plate methods, respectively, were higher than the corresponding values obtained in the present study. Age differences between the American children and those from the present study could have contributed to the difference in DDFI, as dietary habits/consumption patterns of children vary depending on age. In addition, the actual F content of food and drinks consumed by the US children might have been higher. Based on the individual dietary sources, the present study found a similar F intake from food between the two methods, whereas in the US study a higher F intake from food was reported when the food diary method was used – 0·188 mg/d compared with 0·130 mg/d reported for the duplicate plate method. In the present study, a statistically significantly higher F intake from all drinks including water was observed when using the 2-d DP method, whereas for the US children no statistically significant difference in DDFI from drinks was reported between the two methods. Higher F intakes from water have been reported for Iranian( Reference Zohouri and Rugg-Gunn 18 ) and Brazilian( Reference Rodrigues, Leite and Arana 29 ) children due to increased air temperatures during summer; however, drinks consumption of the children in the present study was not affected by seasonal temperature because in north-east England, where the data collection was performed, seasonal temperature variation is low. During data collection, between April and November, the mean annual temperature was 9°C ranging from 2°C in December to 16°C in August( 31 ).
In this study, the lack of a statistically significant difference in the mean DDFI estimated by the 3-d FD and 2-d DP methods at the group level suggests that either method can be used at the population level to estimate DDFI. There are many potential sources of errors in any dietary assessment method, and although these may cancel each other out at the group level, they might introduce a large source of error at the individual level. To investigate this, the agreement between the methods at the individual level was also examined using linear regression analysis. The use of linear regression in preference to the Bland–Altman method( Reference Bland and Altman 32 ) in the present study was mainly due to the proportional bias that was observed in the Bland–Altman plot and it was not removed after log transformation of the data. Based on regression analysis, at an individual level, the agreement in estimating F intake (mg/kg bw per d) using the 3-d FD method compared with the 2-d DP method was within ±0·011 (95 % CI 0·009, 0·013) mg/kg bw per d.
This typical error, although small, may put individuals in a different F intake category due to the narrow margin between the suggested optimal and excessive F intakes, as observed in the present study (Fig. 1). This is particularly important when a study aims to determine the percentage of children with optimal, suboptimal or excess F intakes in order to plan a community-based fluoridation scheme. These findings suggest that DDFI data obtained by one of these dietary methods cannot replace those obtained by the other method when individual intakes are compared.
Some authors have suggested( Reference Martinez-Mier, Kelly and Eckert 17 ) and/or used both methods( Reference Guha-Chowdhury, Drummond and Smillie 11 , Reference Haftenberger, Viergutz and Neumeister 33 ) in their studies in order to check the validity of collected duplicate diets. Although this approach might enhance the reliability of duplicated dietary data, the feasibility of such an approach should be considered carefully as it creates extra work for the participants, which may affect the compliance rate and the tendency to under-report. In addition, the use of both methods alongside each other in large-scale studies might not be practical and the feasibility of this approach would benefit from further investigation.
Generally, none of the dietary assessment tools have been validated and/or calibrated for measurement of dietary F intake in any population. Therefore, validation and calibration studies are required to develop a universal standardised dietary assessment method to assess dietary F intake over time within a population as well as to compare population F intakes and body burden between countries. Among different dietary assessment methods, the 7-d weighed food diary, referred to as the ‘gold standard’ method( Reference Willett 10 ), has been used for calibration studies. However, validation studies have usually used 24-h urine as a biomarker to compare intake of a nutrient assessed from a dietary method against levels estimated from urine samples.
The reliability analysis showed a greater typical day-to-day within-child variation with the 3-d FD method compared with the 2-d DP method. Within-child variation in F intake for the US children was also reported to be higher when the food diary method was used. However, the extent of within-child variation in DDFI was smaller than the variation found in this study. This could be due to recruiting children from a single day-care centre with identical food menus and limited choice of food, whereas in the present study variation in food types was greater as the majority of children had their own packed lunch and also the possibility of swapping their food/snacks with friends. The other possibility that may have contributed to a smaller variation in DDFI seen in the US children is that dietary data for those children were only collected on weekdays, which, according to the authors, was done to avoid variations in diet during weekends. In contrast, in the present study, dietary data collection covered both weekdays and weekend days.
Greater within-child variation in DDFI found when the food diary method was used also suggests an ability of this method to capture more variations compared with the duplicate method. This could be due to a more detailed recording of consumed food and drinks, although it should be noted that recalling such detail can sometimes be difficult for participants, resulting in researchers being tempted to use assumptions.
Conclusion
At the group level, either of the two dietary methods (2-d DP or 3-d FD) is suitable for estimating DDFI. However, at an individual level, due to the narrow margin between optimal and excessive F intake, DDFI data obtained by one of these methods cannot replace those data estimated from the other method during the same data collection period. A validated standardised dietary assessment method is needed to monitor dietary F intake over time and also enable multi-country comparisons.
Acknowledgements
The authors thank the schools and parents for their invaluable assistance during data/sample collection.
This study was supported by grants from Teesside University Research Doctoral Scholarships and The Borrow Foundation.
N. O. and F. V. Z. designed the research. N. O. collected the information and samples and analysed the samples and data. N. O., F. V. Z., A. M. and W. T. O’ H. were involved in manuscript drafting. All the authors read and approved the final version of the manuscript. Sample preparation and analysis was carried out in the School of Dental Sciences and School of Science and Engineering at Newcastle and Teesside Universities, respectively, and Newtec Food Laboratory, Billingham.
The authors have no conflicts of interest to disclose.


